
Introduction to Econometrics 3rd Edition by James Stock, Mark Watson
النسخة 3الرقم المعياري الدولي: 978-9352863501Introduction to Econometrics 3rd Edition by James Stock, Mark Watson
النسخة 3الرقم المعياري الدولي: 978-9352863501 تمرين 6
Using the data set TeachingRatings described in Empirical Exercise 1, carry out the following exercises.
a. Run a regression of Course_Eval on Beauty. Construct a 95 % confidence interval for the effect of Beauty on Course_Eval.
b. Consider the various control variables in the data set. Which do you think should be included in the regression Using a table like Table 1, examine the robustness of the confidence interval that you constructed in (a). What is a reasonable 95% confidence interval for the effect of Beauty on Course_Eval
Exercise 1
Suppose that a random sample of 200 twenty-year-old men is selected from a population and that these men's height and weight are recorded. A regression of weight on height yields
 = -99.41 + 3.94 X Height, R 2 = 0.81, SER = 10.2,
where Weight is measured in pounds and Height is measured in inches.
a. What is the regression's weight prediction for someone who is 70 in. tall 65 in. tall 74 in. tall
b. A man has a late growth spurt and grows 1.5 in. over the course of a year. What is the regression's prediction for the increase hi this man's weight
c. Suppose that instead of measuring weight and height in pounds and inches these variables are measured in centimeters and kilograms. What are the regression estimates from this new centimeter-kilogram regression (Give all results, estimated coefficients, R 2 , and SER.)
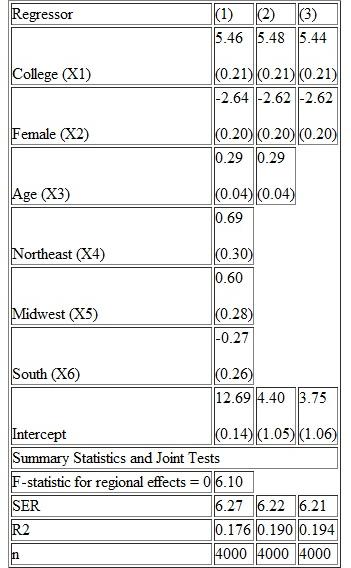
Table 1
Results of Regressions of Average Hourly Earnings on Gender and Education Binary Variables and Other Characteristics Using 1998 Data from the Current Population Survey
Dependent Variable: average hourly earnings (AHE).
a. Run a regression of Course_Eval on Beauty. Construct a 95 % confidence interval for the effect of Beauty on Course_Eval.
b. Consider the various control variables in the data set. Which do you think should be included in the regression Using a table like Table 1, examine the robustness of the confidence interval that you constructed in (a). What is a reasonable 95% confidence interval for the effect of Beauty on Course_Eval
Exercise 1
Suppose that a random sample of 200 twenty-year-old men is selected from a population and that these men's height and weight are recorded. A regression of weight on height yields
= -99.41 + 3.94 X Height, R 2 = 0.81, SER = 10.2,where Weight is measured in pounds and Height is measured in inches.
a. What is the regression's weight prediction for someone who is 70 in. tall 65 in. tall 74 in. tall
b. A man has a late growth spurt and grows 1.5 in. over the course of a year. What is the regression's prediction for the increase hi this man's weight
c. Suppose that instead of measuring weight and height in pounds and inches these variables are measured in centimeters and kilograms. What are the regression estimates from this new centimeter-kilogram regression (Give all results, estimated coefficients, R 2 , and SER.)
Table 1
Results of Regressions of Average Hourly Earnings on Gender and Education Binary Variables and Other Characteristics Using 1998 Data from the Current Population Survey
Dependent Variable: average hourly earnings (AHE).
التوضيح موثّق
موثّق
a.
The mechanism:
Poor nutrition and ot...
Introduction to Econometrics 3rd Edition by James Stock, Mark Watson
لماذا لم يعجبك هذا التمرين؟
أخرى 8 أحرف كحد أدنى و 255 حرفاً كحد أقصى
حرف 255


