Contemporary Mathematics for Business & Consumers 8th Edition by Robert Brechner,Geroge Bergeman
النسخة 8الرقم المعياري الدولي: 978-1305585454Contemporary Mathematics for Business & Consumers 8th Edition by Robert Brechner,Geroge Bergeman
النسخة 8الرقم المعياري الدولي: 978-1305585454 تمرين 22
The following data represent the monthly sales figure in thousands of dollars for the New York and California branches of universal Corporation.
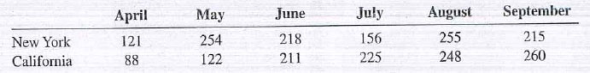
a. Construct a multiple-line chart depicting the monthly sales for the two branches. Showthe New York branch as a solid line and the California branch as a dashed line.
b. Construct a comparative bar chart for the same data. Highlight the bars for each branch differently.
a. Construct a multiple-line chart depicting the monthly sales for the two branches. Showthe New York branch as a solid line and the California branch as a dashed line.
b. Construct a comparative bar chart for the same data. Highlight the bars for each branch differently.
التوضيح موثّق
موثّق
Contemporary Mathematics for Business & Consumers 8th Edition by Robert Brechner,Geroge Bergeman
لماذا لم يعجبك هذا التمرين؟
أخرى 8 أحرف كحد أدنى و 255 حرفاً كحد أقصى
حرف 255


