Contemporary Mathematics for Business & Consumers 8th Edition by Robert Brechner,Geroge Bergeman
النسخة 8الرقم المعياري الدولي: 978-1305585454Contemporary Mathematics for Business & Consumers 8th Edition by Robert Brechner,Geroge Bergeman
النسخة 8الرقم المعياري الدولي: 978-1305585454 تمرين 38
Use the line chart "Widget Sales 2009-2016" to answer the following questions.
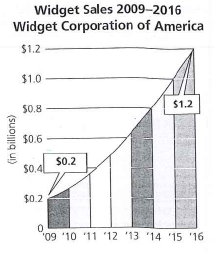
a. What was the amount of widget sales in 2009
b. In what year did widget sales reach $0.8 billion

c. What does this line graph represent
d. What variables are represented on the x-axis and the y-axis
e. What was the amount of widget sales in 2015
f. In which year did sales reach $0.6 billion
g. Calculate how much greater widget sales were in 2016 compared with 2009.
a. What was the amount of widget sales in 2009
b. In what year did widget sales reach $0.8 billion
c. What does this line graph represent
d. What variables are represented on the x-axis and the y-axis
e. What was the amount of widget sales in 2015
f. In which year did sales reach $0.6 billion
g. Calculate how much greater widget sales were in 2016 compared with 2009.
التوضيح

هذا السؤال ليس له إجابة موثقة من أحد الخبراء بعد، دع الذكاء الاصطناعي Copilot في كويز بلس يساعدك في إيجاد الحل.
Contemporary Mathematics for Business & Consumers 8th Edition by Robert Brechner,Geroge Bergeman
لماذا لم يعجبك هذا التمرين؟
أخرى 8 أحرف كحد أدنى و 255 حرفاً كحد أقصى
حرف 255


