
Microeconomics 6th Edition by Robert Hall, Shirley Kuiper, Marc Lieberman
النسخة 6الرقم المعياري الدولي: 978-1133708735Microeconomics 6th Edition by Robert Hall, Shirley Kuiper, Marc Lieberman
النسخة 6الرقم المعياري الدولي: 978-1133708735 تمرين 17
The following table gives hypothetical data for the quantity of gasoline demanded and supplied in Los Angeles per month.
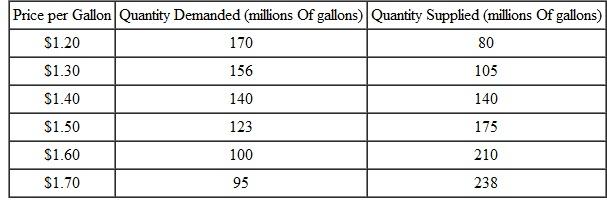 a. Graph the demand and supply curves.
b. Find the equilibrium price and quantity.
c. Illustrate on your graph how a rise in the price of automobiles would affect the gasoline market
a. Graph the demand and supply curves.b. Find the equilibrium price and quantity.
c. Illustrate on your graph how a rise in the price of automobiles would affect the gasoline market
التوضيح موثّق
موثّق
(a)Following graph shows the demand curv...
Microeconomics 6th Edition by Robert Hall, Shirley Kuiper, Marc Lieberman
لماذا لم يعجبك هذا التمرين؟
أخرى 8 أحرف كحد أدنى و 255 حرفاً كحد أقصى
حرف 255


