
A Visual Approach to SPSS for Windows 2nd Edition by Leonard Stern
النسخة 2الرقم المعياري الدولي: 978-0205706051A Visual Approach to SPSS for Windows 2nd Edition by Leonard Stern
النسخة 2الرقم المعياري الدولي: 978-0205706051 تمرين 1
The data for this problem are adapted from the article by Card, David and Krueger, Alan, "Minimum Wages and Employment: A Case Study of the Fast-Food Industry in New Jersey and Pennsylvania" published in The American Economic Review 84.4 (Sept. 1994), 772-793. The data are available at the UCLA Statistics Data Sets website, http://www.stat.ucla.edu/data/, and appear here by permission of the authors.
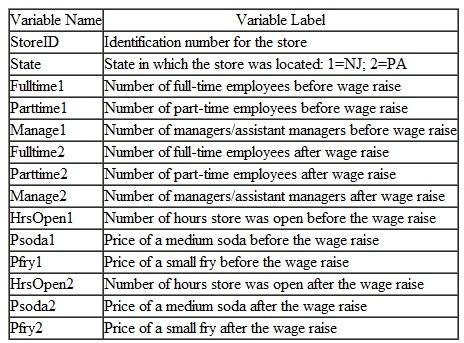
In April, 1992, the minimum wage in New Jersey went from $4.25 to $5.05 an hour. The data in file MinWage.sav was obtained from randomly selected fast food restaurants about one month before and eight months after the minimum wage increase took effect. The variable names and identifying information about the variables is shown in the table below:
 1. Select just the stores in New Jersey. Do an appropriate statistical test to determine whether the change in minimum wage is associated with a significant effect on the number of full-time employees.
2. Repeat the analysis performed in question 1 separately for the part-time employees and managers/assistant managers. What are the outcomes of the analyses
3. For just the stores in New Jersey, determine if the wage raise was significantly associated to the price of a medium soda or the price of a small fry.
4. Calculate the effect size for any difference that was significant for questions 1-3, and characterize the magnitude of the effect.
In April, 1992, the minimum wage in New Jersey went from $4.25 to $5.05 an hour. The data in file MinWage.sav was obtained from randomly selected fast food restaurants about one month before and eight months after the minimum wage increase took effect. The variable names and identifying information about the variables is shown in the table below:
1. Select just the stores in New Jersey. Do an appropriate statistical test to determine whether the change in minimum wage is associated with a significant effect on the number of full-time employees.2. Repeat the analysis performed in question 1 separately for the part-time employees and managers/assistant managers. What are the outcomes of the analyses
3. For just the stores in New Jersey, determine if the wage raise was significantly associated to the price of a medium soda or the price of a small fry.
4. Calculate the effect size for any difference that was significant for questions 1-3, and characterize the magnitude of the effect.
التوضيح موثّق
موثّق
1.
Test the null hypothesis.
![]() The chang...
The chang...
A Visual Approach to SPSS for Windows 2nd Edition by Leonard Stern
لماذا لم يعجبك هذا التمرين؟
أخرى 8 أحرف كحد أدنى و 255 حرفاً كحد أقصى
حرف 255


