
A Visual Approach to SPSS for Windows 2nd Edition by Leonard Stern
النسخة 2الرقم المعياري الدولي: 978-0205706051A Visual Approach to SPSS for Windows 2nd Edition by Leonard Stern
النسخة 2الرقم المعياري الدولي: 978-0205706051 تمرين 3
Note: The data files named in these exercises are available at the publisher's website for this text, http://www.pearsonhighered.com/stern2e.
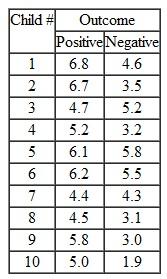
Olson, Banaji, Dweck, and Spelke (2006) read male and female children between 5-7 years old are scenarios that included positive uncontrollable outcomes for a target child (e.g., the child found $10.00 on the street) or negative uncontrollable outcomes (e.g., the child's soccer game was cancelled due to bad weather). Each child heard and number of such scenarios and rated how much he/she liked the target child on a 6-point scale where 1 = really don't like the target child and 6 = really like the target child. The mean liking rating for each set of positive and negative scenarios produced by each child was compared. Use the data shown in the table below to determine whether there was a significant difference in the median ratings given to positive vs. negative outcomes. (Note: the data shown below were created to resemble some of the data described by Olson et al.).
Olson, Banaji, Dweck, and Spelke (2006) read male and female children between 5-7 years old are scenarios that included positive uncontrollable outcomes for a target child (e.g., the child found $10.00 on the street) or negative uncontrollable outcomes (e.g., the child's soccer game was cancelled due to bad weather). Each child heard and number of such scenarios and rated how much he/she liked the target child on a 6-point scale where 1 = really don't like the target child and 6 = really like the target child. The mean liking rating for each set of positive and negative scenarios produced by each child was compared. Use the data shown in the table below to determine whether there was a significant difference in the median ratings given to positive vs. negative outcomes. (Note: the data shown below were created to resemble some of the data described by Olson et al.).
التوضيح موثّق
موثّق
Type the given data into the SPSS work s...
A Visual Approach to SPSS for Windows 2nd Edition by Leonard Stern
لماذا لم يعجبك هذا التمرين؟
أخرى 8 أحرف كحد أدنى و 255 حرفاً كحد أقصى
حرف 255


