
A Visual Approach to SPSS for Windows 2nd Edition by Leonard Stern
النسخة 2الرقم المعياري الدولي: 978-0205706051A Visual Approach to SPSS for Windows 2nd Edition by Leonard Stern
النسخة 2الرقم المعياري الدولي: 978-0205706051 تمرين 3
The file BodyDimensions.sav , described earlier in Exercise 1, contains measurements of various physical characteristics of healthy male and female adults. Use all the variables except age to determine how effectively cases can be classified according to their gender (0 = female, 1 = male). In performing the analysis, assume there is an equal proportion of males and females in the population. Report the following information:
1. Does the discriminant function significantly aid prediction of group membership
2. What is the overall percent correct classification rate using the classification functions
3. Using structure coefficients, what two variables correlate most strongly with the discriminant function Based on other information included in the output, which two variables independently contribute most to the discriminant function
4. Use just the variables obtained as answers to question 3 as predictors of gender. Based on the four predictors what are the answers to questions 1 and 2 above What equations should be used to determine a person's gender based on values of the four variables
Exercise 1
Heinz and Peterson measured the body characteristics of healthy, active adults. Ten of the measurements, including height, were of skeletal properties that could be used to define each person's body build. Twelve measurements were of girths that either were changeable (they could be affected, for example, by how much muscle or fat a person had) or constant. In addition, each person's weight was measured. Age and gender were recorded. The variables' names and each one's category are shown in the table below:
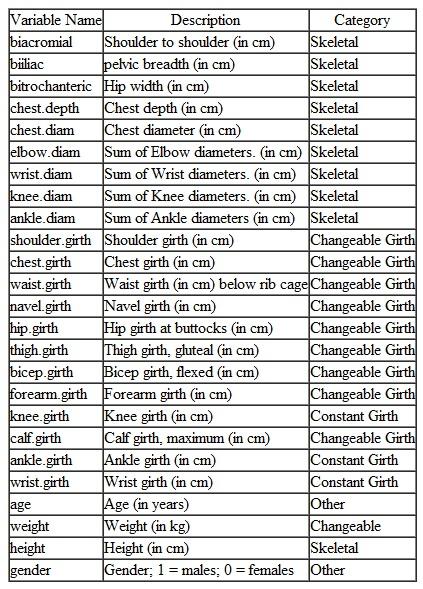 These data are available on the publisher's website for this text at the address http://www.pearsonhighered.com/stern2e in the file BodyDimensions.sav. This dataset is adapted from data published in the article by Heinz, Grete, Peterson, Louis J., Johnson, Roger W., and Kerk, Carter J. (2003), "Exploring relationships in body dimensions", Journal of Statistics Education Volume 11, Number 2, www.amstat.org/publications/jse/v11n2/datasets.heinz.html. Full measurement descriptions are given in this article. Permission to use the data has been granted by the authors.
1. What is the equation that predicts a person's weight from the skeletal variables including the variable height
2. How well does the equation derived in question 1 explain variability in weight Is the relation statistically significant Provide supporting data.
3. Create a prediction equation for weight from the changeable girths and height. Does it predict weight more accurately than the above equation Which equation is a better guide for what would be a reasonable weight over the lifespan
4. Use a stepwise procedure to determine the best equation for predicting weight from the skeletal variables, including height, and the changeable girth variables. Specify how well the equation works in predicting weight.
1. Does the discriminant function significantly aid prediction of group membership
2. What is the overall percent correct classification rate using the classification functions
3. Using structure coefficients, what two variables correlate most strongly with the discriminant function Based on other information included in the output, which two variables independently contribute most to the discriminant function
4. Use just the variables obtained as answers to question 3 as predictors of gender. Based on the four predictors what are the answers to questions 1 and 2 above What equations should be used to determine a person's gender based on values of the four variables
Exercise 1
Heinz and Peterson measured the body characteristics of healthy, active adults. Ten of the measurements, including height, were of skeletal properties that could be used to define each person's body build. Twelve measurements were of girths that either were changeable (they could be affected, for example, by how much muscle or fat a person had) or constant. In addition, each person's weight was measured. Age and gender were recorded. The variables' names and each one's category are shown in the table below:
These data are available on the publisher's website for this text at the address http://www.pearsonhighered.com/stern2e in the file BodyDimensions.sav. This dataset is adapted from data published in the article by Heinz, Grete, Peterson, Louis J., Johnson, Roger W., and Kerk, Carter J. (2003), "Exploring relationships in body dimensions", Journal of Statistics Education Volume 11, Number 2, www.amstat.org/publications/jse/v11n2/datasets.heinz.html. Full measurement descriptions are given in this article. Permission to use the data has been granted by the authors.1. What is the equation that predicts a person's weight from the skeletal variables including the variable height
2. How well does the equation derived in question 1 explain variability in weight Is the relation statistically significant Provide supporting data.
3. Create a prediction equation for weight from the changeable girths and height. Does it predict weight more accurately than the above equation Which equation is a better guide for what would be a reasonable weight over the lifespan
4. Use a stepwise procedure to determine the best equation for predicting weight from the skeletal variables, including height, and the changeable girth variables. Specify how well the equation works in predicting weight.
التوضيح موثّق
موثّق
Perform discriminant analysis for the gi...
A Visual Approach to SPSS for Windows 2nd Edition by Leonard Stern
لماذا لم يعجبك هذا التمرين؟
أخرى 8 أحرف كحد أدنى و 255 حرفاً كحد أقصى
حرف 255


