The Living World 6th Edition by George Johnson, Jonathan Losos,William Ober,Claire Garrison
النسخة 6الرقم المعياري الدولي: 978-0077280086The Living World 6th Edition by George Johnson, Jonathan Losos,William Ober,Claire Garrison
النسخة 6الرقم المعياري الدولي: 978-0077280086 تمرين 16
Do Vertebrate Genomes Evolve as Darwin Predicted
The genomic comparisons presented in figure 15.5 establish clearly that the genomes of close relatives are more similar than those of more distant ones, just as Darwin's theory predicts. Such comparisons are relative, however, as the analysis in the figure says nothing about how rapidly a particular taxonomic category evolves. Taxonomic categories are listed on the left side of figure 15.5, with orders being more distantly related than families, and classes even more distantly related. Do the genomes of vertebrates (animals with a backbone) in different classes from one another evolve more slowly than the genomes of vertebrates in different orders And if we don't know about such evolutionary rates, how can we be sure how much the differences in genomic relatedness analyzed in figure 15.5 truly reflect the ongoing accumulation of evolutionary change Might they instead be the result of some unsuspected peculiarity in how we define the taxonomic categories
Fortunately, a more direct analysis is possible. The evolutionary history of the vertebrates is quite well known from fossils, and because many of these fossils have been independently dated using tools such as radioisotope dating (see page 47), it is possible to recast the analysis of figure 15.5 in terms of concrete intervals of time, and test directly whether or not vertebrate genomes accumulate more differences over longer periods of time as Darwin's theory predicts.
For each of the 17 nonhuman vertebrates in figure 15.5, the graph to the upper right plots genomic similiarity-the percent (%) alignment with humans of 44 ENCODE regions (that is, how alike the DNA sequences of these regions are to that of the human genome)- plotted against that vertebrate's divergence time (that is, how many millions of years have elapsed since that vertebrate and humans shared a common ancestor in the fossil record). Thus the last common ancestor shared by birds and humans was an early reptile called a dicynodont that lived some 240 million years ago, and since then the genomes have changed so much that only 7% of their ENCODE sequences are still the same.
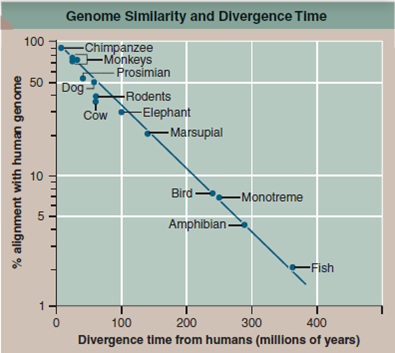
Figure 15.5
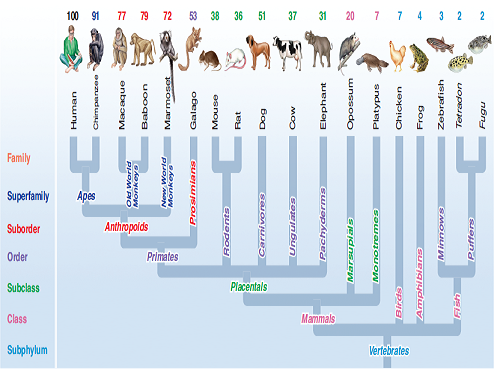
Figure 15.5 Genomic similarity refl ects evolutionary relatedness.
The number above each organism is the percent of the nucleotides in selected regions of that organism's genome that match those of the same regions in the human genome. The more distantly-related animals to humans, found toward the right side of the figure, also have fewer similarities with the human genome, compared to the more closely-related animals.
Drawing Conclusions Does this survey support the contention that evolution as seen in the fossil record is reflected at the DNA level Do vertebrate genomes accumulate more differences over longer periods of time
The genomic comparisons presented in figure 15.5 establish clearly that the genomes of close relatives are more similar than those of more distant ones, just as Darwin's theory predicts. Such comparisons are relative, however, as the analysis in the figure says nothing about how rapidly a particular taxonomic category evolves. Taxonomic categories are listed on the left side of figure 15.5, with orders being more distantly related than families, and classes even more distantly related. Do the genomes of vertebrates (animals with a backbone) in different classes from one another evolve more slowly than the genomes of vertebrates in different orders And if we don't know about such evolutionary rates, how can we be sure how much the differences in genomic relatedness analyzed in figure 15.5 truly reflect the ongoing accumulation of evolutionary change Might they instead be the result of some unsuspected peculiarity in how we define the taxonomic categories
Fortunately, a more direct analysis is possible. The evolutionary history of the vertebrates is quite well known from fossils, and because many of these fossils have been independently dated using tools such as radioisotope dating (see page 47), it is possible to recast the analysis of figure 15.5 in terms of concrete intervals of time, and test directly whether or not vertebrate genomes accumulate more differences over longer periods of time as Darwin's theory predicts.
For each of the 17 nonhuman vertebrates in figure 15.5, the graph to the upper right plots genomic similiarity-the percent (%) alignment with humans of 44 ENCODE regions (that is, how alike the DNA sequences of these regions are to that of the human genome)- plotted against that vertebrate's divergence time (that is, how many millions of years have elapsed since that vertebrate and humans shared a common ancestor in the fossil record). Thus the last common ancestor shared by birds and humans was an early reptile called a dicynodont that lived some 240 million years ago, and since then the genomes have changed so much that only 7% of their ENCODE sequences are still the same.
Figure 15.5
Figure 15.5 Genomic similarity refl ects evolutionary relatedness.
The number above each organism is the percent of the nucleotides in selected regions of that organism's genome that match those of the same regions in the human genome. The more distantly-related animals to humans, found toward the right side of the figure, also have fewer similarities with the human genome, compared to the more closely-related animals.
Drawing Conclusions Does this survey support the contention that evolution as seen in the fossil record is reflected at the DNA level Do vertebrate genomes accumulate more differences over longer periods of time
التوضيح موثّق
موثّق
Evolutionary changes have been going on ...
The Living World 6th Edition by George Johnson, Jonathan Losos,William Ober,Claire Garrison
لماذا لم يعجبك هذا التمرين؟
أخرى 8 أحرف كحد أدنى و 255 حرفاً كحد أقصى
حرف 255


