
Introduction to Econometrics 3rd Edition by James Stock, James Stock
النسخة 3الرقم المعياري الدولي: 978-9352863501Introduction to Econometrics 3rd Edition by James Stock, James Stock
النسخة 3الرقم المعياري الدولي: 978-9352863501 تمرين 4
A is a continuous variable that takes on values between 5 and 100. Z is a binary variable. Sketch the following regression functions (with values of X between 5 and 100 on the horizontal axis and values of Y on the vertical axis):
a.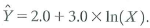
b.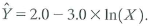
c.
i.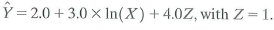
ii. same as (i), but with Z=0.
d.
i.
ii. same as (i), but with Z=0.
e.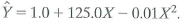
a.
b.
c.
i.
ii. same as (i), but with Z=0.
d.
i.
ii. same as (i), but with Z=0.
e.
التوضيح موثّق
موثّق
Consider the provided details and use MS...
Introduction to Econometrics 3rd Edition by James Stock, James Stock
لماذا لم يعجبك هذا التمرين؟
أخرى 8 أحرف كحد أدنى و 255 حرفاً كحد أقصى
حرف 255


