
Introduction to Econometrics 3rd Edition by James Stock, James Stock
النسخة 3الرقم المعياري الدولي: 978-9352863501Introduction to Econometrics 3rd Edition by James Stock, James Stock
النسخة 3الرقم المعياري الدولي: 978-9352863501 تمرين 1
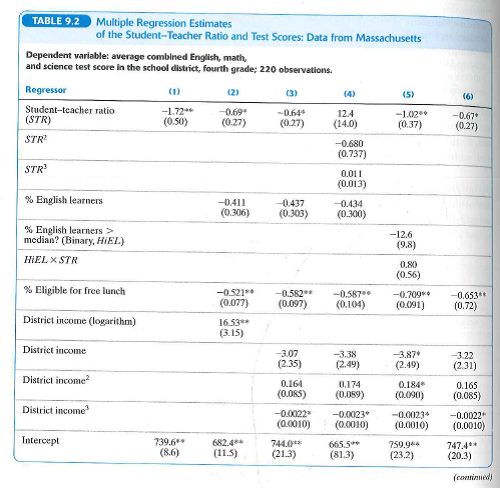
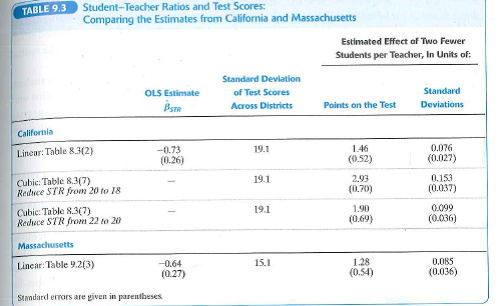
Using the regressions shown in column (2) of Table 8.3 and column (2) of Table 9.2, construct a table like Table 9.3 to compare the estimated effects of a 10% increase in district income on test scores in California and Massachusetts. 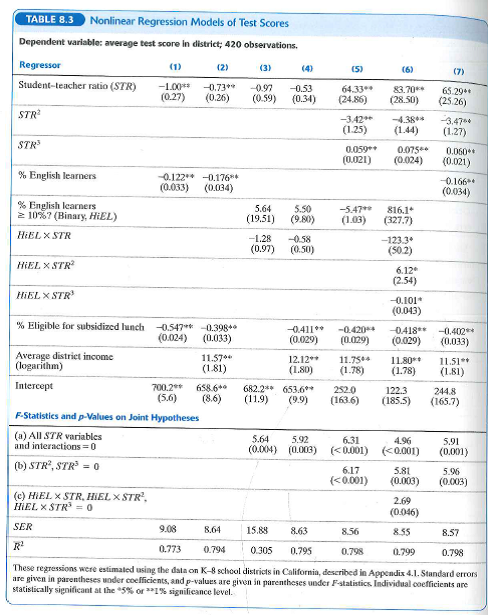
التوضيح موثّق
موثّق
The general regression formula for test ...
Introduction to Econometrics 3rd Edition by James Stock, James Stock
لماذا لم يعجبك هذا التمرين؟
أخرى 8 أحرف كحد أدنى و 255 حرفاً كحد أقصى
حرف 255


