Environmental Science 12th Edition by William Cunningham,Mary Ann Cunningham
النسخة 12الرقم المعياري الدولي: 978-0077431204Environmental Science 12th Edition by William Cunningham,Mary Ann Cunningham
النسخة 12الرقم المعياري الدولي: 978-0077431204 تمرين 1
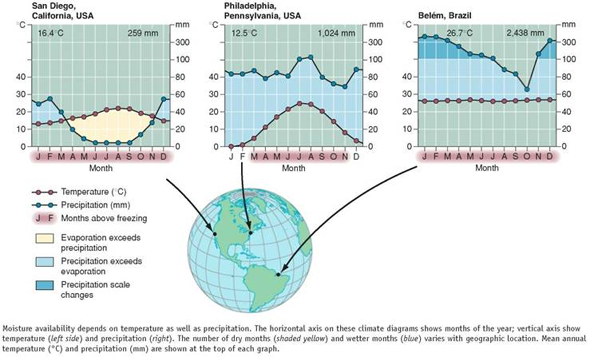
As you've learned in this chapter, temperature and precipitation are critical factors in determining the distribution of terrestrial biomes. Understanding climate graphs and what they tell us is extremely helpful in making sense of these differences. In the figure below, reproduced from figure 5.5 , the graphs show annual patterns in temperature and precipitation (rainfall and snow). They also indicate how much of the year evaporation exceeds precipitation (yellow areas), and when precipitation exceeds evaporation, leaving moisture available for plant growth. Examine these graphs to answer the following questions.
What do these temperatures correspond to in Fahrenheit ( Hint: look at the conversion table in the back of your book).
What do these temperatures correspond to in Fahrenheit ( Hint: look at the conversion table in the back of your book).
التوضيح موثّق
موثّق
Climate graphs- represent the annual pre...
Environmental Science 12th Edition by William Cunningham,Mary Ann Cunningham
لماذا لم يعجبك هذا التمرين؟
أخرى 8 أحرف كحد أدنى و 255 حرفاً كحد أقصى
حرف 255


