
Introductory Econometrics 4th Edition by Jeffrey Wooldridge
النسخة 4الرقم المعياري الدولي: 978-0324660609Introductory Econometrics 4th Edition by Jeffrey Wooldridge
النسخة 4الرقم المعياري الدولي: 978-0324660609 تمرين 6
For positive random variables X and Y, suppose the expected value of Y given X is E(Y/X) = X. The unknown parameter shows how the expected value of Y changes with X.
(i) Define the random variable Z =Y/X. Show that E(Z) = .
(ii) Use part (i) to prove that the estimator W 1 = n -1 (Y i /X i ) is unbiased for , where {(X i ,Y i ): i = 1, 2,…., n} is a random sample
(iii) Explain why the estimator W 2 = , where the overbars denote sample averages, is not the same as W 1. Nevertheless, show that W 2 is also unbiased for .
(iv) The following table contains data on corn yields for several counties in Iowa. The USDA predicts the number of hectares of corn in each county based on satellite photos. Researchers count the number of "pixels" of corn in the satellite picture (as opposed to,for example, the number of pixels of soybeans or of uncultivated land) and use these to predict the actual number of hectares. To develop a prediction equation to be used for counties in general, the USDA surveyed farmers in selected counties to obtain corn yields in hectares. Let Y i = corn yield in county i and let X i = number of corn pixels in the satellite picture for county i. There are n=17 observations for eight counties. Use this sample to compute the estimates of devised in parts (ii) and (iii). Are the estimates similar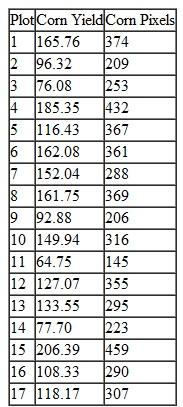
(i) Define the random variable Z =Y/X. Show that E(Z) = .
(ii) Use part (i) to prove that the estimator W 1 = n -1
(Y i /X i ) is unbiased for , where {(X i ,Y i ): i = 1, 2,…., n} is a random sample(iii) Explain why the estimator W 2 =
, where the overbars denote sample averages, is not the same as W 1. Nevertheless, show that W 2 is also unbiased for .(iv) The following table contains data on corn yields for several counties in Iowa. The USDA predicts the number of hectares of corn in each county based on satellite photos. Researchers count the number of "pixels" of corn in the satellite picture (as opposed to,for example, the number of pixels of soybeans or of uncultivated land) and use these to predict the actual number of hectares. To develop a prediction equation to be used for counties in general, the USDA surveyed farmers in selected counties to obtain corn yields in hectares. Let Y i = corn yield in county i and let X i = number of corn pixels in the satellite picture for county i. There are n=17 observations for eight counties. Use this sample to compute the estimates of devised in parts (ii) and (iii). Are the estimates similar
التوضيح موثّق
موثّق
(i)
Given that there are two positive ra...
Introductory Econometrics 4th Edition by Jeffrey Wooldridge
لماذا لم يعجبك هذا التمرين؟
أخرى 8 أحرف كحد أدنى و 255 حرفاً كحد أقصى
حرف 255


