
Introductory Econometrics 4th Edition by Jeffrey Wooldridge
النسخة 4الرقم المعياري الدولي: 978-0324660609Introductory Econometrics 4th Edition by Jeffrey Wooldridge
النسخة 4الرقم المعياري الدولي: 978-0324660609 تمرين 4
Regression analysis can be used to test whether the market efficiently uses information in valuing stocks. For concreteness, let return be the total return from holding a firm's stock over the four-year period from the end of 1990 to the end of 1994. The efficient markets hypothesis says that these returns should not be systematically related to information known in 1990. If firm characteristics known at the beginning of the period help to predict stock returns, then we could use this information in choosing stocks.
For 1990, let dkr be a firm's debt to capital ratio, let eps denote the earnings per share, let netinc denote net income, and let salary denote total compensation for the CEO.
(i) Using the data in RETURN.RAW, the following equation was estimated: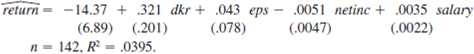
Test whether the explanatory variables are jointly significant at the 5% level. Is any explanatory variable individually significant
(ii) Now, reestimate the model using the log form for netinc and salary: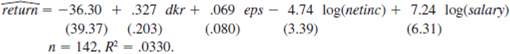 .
.
Do any of your conclusions from part (i) change
(iii) In this sample, some firms have zero debt and others have negative earnings. Should we try to use log(dkr) or log(eps) in the model to see if these improve the fit Explain.
(iv) Overall, is the evidence for predictability of stock returns strong or weak
For 1990, let dkr be a firm's debt to capital ratio, let eps denote the earnings per share, let netinc denote net income, and let salary denote total compensation for the CEO.
(i) Using the data in RETURN.RAW, the following equation was estimated:
Test whether the explanatory variables are jointly significant at the 5% level. Is any explanatory variable individually significant
(ii) Now, reestimate the model using the log form for netinc and salary:
.Do any of your conclusions from part (i) change
(iii) In this sample, some firms have zero debt and others have negative earnings. Should we try to use log(dkr) or log(eps) in the model to see if these improve the fit Explain.
(iv) Overall, is the evidence for predictability of stock returns strong or weak
التوضيح موثّق
موثّق
Regression analysis shows the linear rel...
Introductory Econometrics 4th Edition by Jeffrey Wooldridge
لماذا لم يعجبك هذا التمرين؟
أخرى 8 أحرف كحد أدنى و 255 حرفاً كحد أقصى
حرف 255


