
Managing for Quality and Performance Excellence 9th Edition by James Evans,William Lindsay
النسخة 9الرقم المعياري الدولي: 978-1285069463Managing for Quality and Performance Excellence 9th Edition by James Evans,William Lindsay
النسخة 9الرقم المعياري الدولي: 978-1285069463 تمرين 46
Many one-tenth scale remote control (RC) model car racing enthusiasts believe that spending more money on high-quality batteries, using expensive gold-plated connectors, and storing batteries at low temperatures will improve battery life performance in a race. To test this hypothesis, an electrical test circuit was constructed to measure battery discharge under different configurations. Each factor (battery type, connector type, and temperature) was evaluated at two levels, resulting in 2 3 = 8 experimental conditions, shown in Table 6.5.
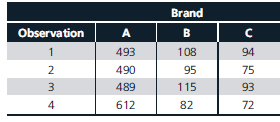
Model race car enthusiasts are also interested in determining whether any significant differences exist between various brands of batteries. Understanding possible differences in battery performance could be a first step in examining whether connection or temperature has an effect on performance. Table 6.6 shows discharge times for three different brands of batteries, gathered through a measurement process.
TABLE 6.5 Experimental Design for Testing Battery Performance
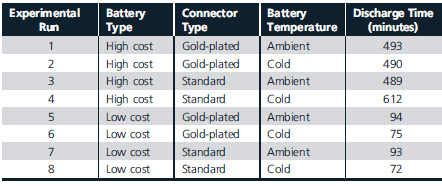
TABLE 6.6 Battery Discharge Time Data by Brand
Use the data in Table 6.5 to find the main effects, interactions, and interaction plots for the three factors (use the Excel template 2x3 Factorial Experiment.xlsx on the Student Companion Site). Thoroughly explain your results.
Model race car enthusiasts are also interested in determining whether any significant differences exist between various brands of batteries. Understanding possible differences in battery performance could be a first step in examining whether connection or temperature has an effect on performance. Table 6.6 shows discharge times for three different brands of batteries, gathered through a measurement process.
TABLE 6.5 Experimental Design for Testing Battery Performance
TABLE 6.6 Battery Discharge Time Data by Brand
Use the data in Table 6.5 to find the main effects, interactions, and interaction plots for the three factors (use the Excel template 2x3 Factorial Experiment.xlsx on the Student Companion Site). Thoroughly explain your results.
التوضيح

هذا السؤال ليس له إجابة موثقة من أحد الخبراء بعد، دع الذكاء الاصطناعي Copilot في كويز بلس يساعدك في إيجاد الحل.
Managing for Quality and Performance Excellence 9th Edition by James Evans,William Lindsay
لماذا لم يعجبك هذا التمرين؟
أخرى 8 أحرف كحد أدنى و 255 حرفاً كحد أقصى
حرف 255


