
Campbell Biology 11th Edition by Lisa Urry,Michael Cain,Steven Wasserman,Peter Minorsky,Jane Reece
النسخة 11الرقم المعياري الدولي: 978-0134093413Campbell Biology 11th Edition by Lisa Urry,Michael Cain,Steven Wasserman,Peter Minorsky,Jane Reece
النسخة 11الرقم المعياري الدولي: 978-0134093413 تمرين 13
Using the Hardy-Weinberg Equation to Interpret Data and Make Predictions
Is Evolution Occurring in a Soybean Population One way to test whether evolution is occurring in a population is to compare the observed genotype frequencies at a locus with those expected for a non-evolving population based on the Hardy-Weinberg equation. In this exercise, you'll test whether a soybean population is evolving at a locus with two alleles, C G and C Y , that affect chlorophyll production and hence leaf color.
How the Experiment Was Done Students planted soybean seeds and then counted the number of seedlings of each genotype at day 7 and again at day 21. Seedlings of each genotype could be distinguished visually because the C G and C Y alleles show incomplete dominance: C G C G seedlings have green leaves, C G C Y seedlings have green-yellow leaves, and C Y C Y seedlings have yellow leaves.
Data from the Experiment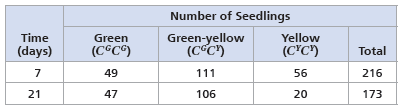
Next, use the hardy-Weinberg equation ( p 2 + 2 pq + q 2 = 1) to calculate the day 7 expected frequencies of genotypes C G C G , C G C Y , and C Y C Y for a population in hardy-Weinberg equilibrium.
التوضيح

هذا السؤال ليس له إجابة موثقة من أحد الخبراء بعد، دع الذكاء الاصطناعي Copilot في كويز بلس يساعدك في إيجاد الحل.
Campbell Biology 11th Edition by Lisa Urry,Michael Cain,Steven Wasserman,Peter Minorsky,Jane Reece
لماذا لم يعجبك هذا التمرين؟
أخرى 8 أحرف كحد أدنى و 255 حرفاً كحد أقصى
حرف 255


