
Living in the Environment 18th Edition by Tyler Miller,Scott Spoolman
النسخة 18الرقم المعياري الدولي: 9781285969725Living in the Environment 18th Edition by Tyler Miller,Scott Spoolman
النسخة 18الرقم المعياري الدولي: 9781285969725 تمرين 14
Use this graph to compare the per capita gross domestic product (GDP) with the per capita genuine progress indicator (GPI) in the United States between 1950 and 2004 (the latest year for which this data is available).
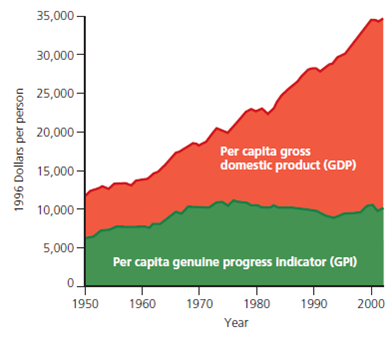
(a) By what percentage did the per capita GDP increase between 1950 and 1975, and between 1975 and 2004 (b) By what percentage did the per capita GPI increase between 1950 and 1975, and decrease between 1975 and 2004
(a) By what percentage did the per capita GDP increase between 1950 and 1975, and between 1975 and 2004 (b) By what percentage did the per capita GPI increase between 1950 and 1975, and decrease between 1975 and 2004
التوضيح موثّق
موثّق
a)
Therefore, percentage of per capita G...
Living in the Environment 18th Edition by Tyler Miller,Scott Spoolman
لماذا لم يعجبك هذا التمرين؟
أخرى 8 أحرف كحد أدنى و 255 حرفاً كحد أقصى
حرف 255


