
Essentials of Business Analytics 1st Edition by Jeffrey Camm,James Cochran,Michael Fry,Jeffrey Ohlmann ,David Anderson
النسخة 1الرقم المعياري الدولي: 978-1285187273Essentials of Business Analytics 1st Edition by Jeffrey Camm,James Cochran,Michael Fry,Jeffrey Ohlmann ,David Anderson
النسخة 1الرقم المعياري الدولي: 978-1285187273 تمرين 13
The following 20 observations are for two quantitative variables, x and y.
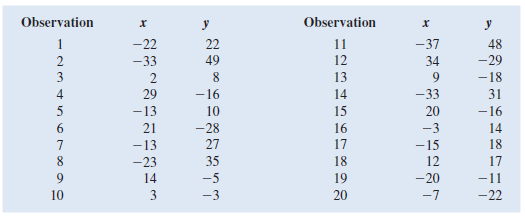
a. Create a scatter chart for these 20 observations.
b. Fit a linear trendline to the 20 observations. What can you say about the relationship between the two quantitative variables
a. Create a scatter chart for these 20 observations.
b. Fit a linear trendline to the 20 observations. What can you say about the relationship between the two quantitative variables
التوضيح موثّق
موثّق
a.Consider the following table:
![]() A scat...
A scat...
Essentials of Business Analytics 1st Edition by Jeffrey Camm,James Cochran,Michael Fry,Jeffrey Ohlmann ,David Anderson
لماذا لم يعجبك هذا التمرين؟
أخرى 8 أحرف كحد أدنى و 255 حرفاً كحد أقصى
حرف 255


