
Essentials of Business Analytics 1st Edition by Jeffrey Camm,James Cochran,Michael Fry,Jeffrey Ohlmann ,David Anderson
النسخة 1الرقم المعياري الدولي: 978-1285187273Essentials of Business Analytics 1st Edition by Jeffrey Camm,James Cochran,Michael Fry,Jeffrey Ohlmann ,David Anderson
النسخة 1الرقم المعياري الدولي: 978-1285187273 تمرين 16
The following table contains time series data for regular gasoline prices in the United States for 36 consecutive months:
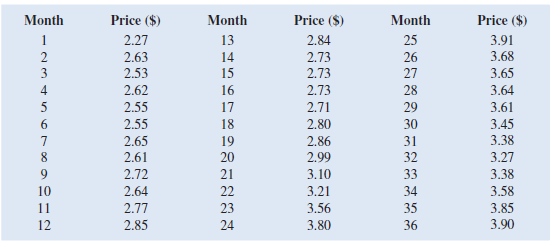
a. Create a line chart for these time series data. What interpretations can you make about the average price per gallon of conventional regular gasoline over these 36 months
b. Fit a linear trendline to the data. What does the trendline indicate about the price of gasoline over these 36 months
a. Create a line chart for these time series data. What interpretations can you make about the average price per gallon of conventional regular gasoline over these 36 months
b. Fit a linear trendline to the data. What does the trendline indicate about the price of gasoline over these 36 months
التوضيح موثّق
موثّق
a.Enter the gasoline prices for 36 month...
Essentials of Business Analytics 1st Edition by Jeffrey Camm,James Cochran,Michael Fry,Jeffrey Ohlmann ,David Anderson
لماذا لم يعجبك هذا التمرين؟
أخرى 8 أحرف كحد أدنى و 255 حرفاً كحد أقصى
حرف 255


