Deck 5: Prediction, Goodness-Of-Fit and Modeling Issues
Full screen (f)
Question
Question
Question
Question
Question
Question
Question
Question
While working with the sales manager of your firm you have estimated the following model of sales volume as a function of monthly household income: 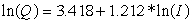 (0.781)(0.392) Where Q is monthly sales volume,I is monthly household income in thousands,and standard errors are listed below the parameter estimates.
What is the income elasticity of your firm's product?
A)1.212
B)2.206
C)3.418
D)4.630
(0.781)(0.392) Where Q is monthly sales volume,I is monthly household income in thousands,and standard errors are listed below the parameter estimates.What is the income elasticity of your firm's product?
A)1.212
B)2.206
C)3.418
D)4.630
Question
Question
Question
Question
Question
Question
Question
When should a researcher consider transforming the explanatory variable in the simple linear regression model?
A)to estimate a coefficient on the dependent variable that matches economic theory
B)to allow non-constant marginal effects
C)to reduce variance in the dependent variable
D)to reduce (Note: the "hat" should be over the whole expression,but I can't accomplish that in my software right now)
A)to estimate a coefficient on the dependent variable that matches economic theory
B)to allow non-constant marginal effects
C)to reduce variance in the dependent variable
D)to reduce
(Note: the "hat" should be over the whole expression,but I can't accomplish that in my software right now) Question
Question
Question
While working with the sales manager of your firm you have estimated the following model of sales volume as a function of monthly household income: 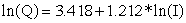 (0.781)(0.392) Where Q is monthly sales volume,I is monthly household income in thousands,and standard errors are listed below the parameter estimates.
What does the model predict sales volume to be if using the corrected predictor when income is $4000 per month?
A)708,133.68
B)723,146.11
C)163.73
D)167.20
(0.781)(0.392) Where Q is monthly sales volume,I is monthly household income in thousands,and standard errors are listed below the parameter estimates.What does the model predict sales volume to be if using the corrected predictor when income is $4000 per month?
A)708,133.68
B)723,146.11
C)163.73
D)167.20
Question
Question

Unlock Deck
Sign up to unlock the cards in this deck!
Unlock Deck
Unlock Deck
1/20
Play
Full screen (f)
Deck 5: Prediction, Goodness-Of-Fit and Modeling Issues
1
You have estimated a regression model and your printout includes the following information sxy= 3614.00
Sx = 12.72
Sy = 394.61
SST = 758912.00.
Use this information to calculate SSE.
A)546,416.64
B)212,495.36
C)381.89
D)5019.44
Sx = 12.72
Sy = 394.61
SST = 758912.00.
Use this information to calculate SSE.
A)546,416.64
B)212,495.36
C)381.89
D)5019.44
B
2
You have estimated a regression model and your printout includes the following information sxy= 3614.00
Sx = 12.72
Sy = 394.61
SST = 758912.00.
What is R2 for this regression model?
A).72
B).11
C).03
D).53
Sx = 12.72
Sy = 394.61
SST = 758912.00.
What is R2 for this regression model?
A).72
B).11
C).03
D).53
A
3
Which of the following expressions is NOT equal to Ʃ(yi - y̅)2 ?
A)Ʃ(ŷi-y̅)2+ Ʃei2
B)SSR + SSE
C)SSR/SSE
D)SST
A)Ʃ(ŷi-y̅)2+ Ʃei2
B)SSR + SSE
C)SSR/SSE
D)SST
C
4
A measure of the symmetry of a distribution is ________________________.
Unlock Deck
Unlock for access to all 20 flashcards in this deck.
Unlock Deck
k this deck
5
At what values of x0 will the standard error of the forecast be smallest?
A)x0 = 0
B)x0 =x̅
C)x02 = 2
D)x0 = tc se(f)
A)x0 = 0
B)x0 =x̅
C)x02 = 2
D)x0 = tc se(f)
Unlock Deck
Unlock for access to all 20 flashcards in this deck.
Unlock Deck
k this deck
6
What hypothesis is tested when using the Jarque-Berra test ?
A)H0: The model is correctly specified as estimated
B)H0: The error terms are normally distributed
C)H0: The error terms are uncorrelated with x
D)H0: The error terms are random
A)H0: The model is correctly specified as estimated
B)H0: The error terms are normally distributed
C)H0: The error terms are uncorrelated with x
D)H0: The error terms are random
Unlock Deck
Unlock for access to all 20 flashcards in this deck.
Unlock Deck
k this deck
7
Which of the following leads to large forecast errors?
A)larger sample size,N
B)variation in the explanatory variable,x,is large
C)overall uncertainty in the model,as measured by 2,is smaller
D)the value of (x0 - x̄)2 is larger
A)larger sample size,N
B)variation in the explanatory variable,x,is large
C)overall uncertainty in the model,as measured by 2,is smaller
D)the value of (x0 - x̄)2 is larger
Unlock Deck
Unlock for access to all 20 flashcards in this deck.
Unlock Deck
k this deck
8
While working with the sales manager of your firm you have estimated the following model of sales volume as a function of monthly household income: (0.781)(0.392) Where Q is monthly sales volume,I is monthly household income in thousands,and standard errors are listed below the parameter estimates.
What is the income elasticity of your firm's product?
A)1.212
B)2.206
C)3.418
D)4.630
(0.781)(0.392) Where Q is monthly sales volume,I is monthly household income in thousands,and standard errors are listed below the parameter estimates.What is the income elasticity of your firm's product?
A)1.212
B)2.206
C)3.418
D)4.630
Unlock Deck
Unlock for access to all 20 flashcards in this deck.
Unlock Deck
k this deck
9
What about the distribution of a random variable does kurtosis measure?
Unlock Deck
Unlock for access to all 20 flashcards in this deck.
Unlock Deck
k this deck
10
What does R2,the coefficient of determination,measure?
A)the probability of the true value falling within the forecast interval
B)the p-value on the coefficient we are using to test our hypothesis of interest
C)the confidence interval of the error terms as determined by the coefficients
D)the proportion of the variation in y explained by x within the regression model
Unlock Deck
Unlock for access to all 20 flashcards in this deck.
Unlock Deck
k this deck
11
What is the skewness of the normal distribution?
Unlock Deck
Unlock for access to all 20 flashcards in this deck.
Unlock Deck
k this deck
12
You have estimated the following simple regression model y = 379 + 1.44 x3
What is the elasticity when x = 8.49?
A)263.19
B)311.39
C)2.10
D)-24.7
What is the elasticity when x = 8.49?
A)263.19
B)311.39
C)2.10
D)-24.7
Unlock Deck
Unlock for access to all 20 flashcards in this deck.
Unlock Deck
k this deck
13
You have estimated a model of two variables related such that ln(y)= 17.3 - .04 x
If x decreases by 2 units,what is the expected change in y?
A)y decreases by .08 units.
B)y increases by 8 percent.
C)y increases by 4 units
D)y decreases by 8 percent.
If x decreases by 2 units,what is the expected change in y?
A)y decreases by .08 units.
B)y increases by 8 percent.
C)y increases by 4 units
D)y decreases by 8 percent.
Unlock Deck
Unlock for access to all 20 flashcards in this deck.
Unlock Deck
k this deck
14
Which of the following will change if you scale the dependent variable in a simple regression model?
A)p-value
B)t-value of 2
C)R2
D) 1
A)p-value
B)t-value of 2
C)R2
D) 1
Unlock Deck
Unlock for access to all 20 flashcards in this deck.
Unlock Deck
k this deck
15
When should a researcher consider transforming the explanatory variable in the simple linear regression model?
A)to estimate a coefficient on the dependent variable that matches economic theory
B)to allow non-constant marginal effects
C)to reduce variance in the dependent variable
D)to reduce (Note: the "hat" should be over the whole expression,but I can't accomplish that in my software right now)
A)to estimate a coefficient on the dependent variable that matches economic theory
B)to allow non-constant marginal effects
C)to reduce variance in the dependent variable
D)to reduce
(Note: the "hat" should be over the whole expression,but I can't accomplish that in my software right now) Unlock Deck
Unlock for access to all 20 flashcards in this deck.
Unlock Deck
k this deck
16
If a scatter plot of the data reveals an inverted U shape,what data transformation would allow it to be estimated with simple linear regression?
Unlock Deck
Unlock for access to all 20 flashcards in this deck.
Unlock Deck
k this deck
17
You have estimated the following simple regression model y = 379 + 1.44 x3
What does this model predict y to be when x = 8.49?
A)415.68
B)690.39
C)1260.22
D)2205.47
What does this model predict y to be when x = 8.49?
A)415.68
B)690.39
C)1260.22
D)2205.47
Unlock Deck
Unlock for access to all 20 flashcards in this deck.
Unlock Deck
k this deck
18
While working with the sales manager of your firm you have estimated the following model of sales volume as a function of monthly household income: (0.781)(0.392) Where Q is monthly sales volume,I is monthly household income in thousands,and standard errors are listed below the parameter estimates.
What does the model predict sales volume to be if using the corrected predictor when income is $4000 per month?
A)708,133.68
B)723,146.11
C)163.73
D)167.20
(0.781)(0.392) Where Q is monthly sales volume,I is monthly household income in thousands,and standard errors are listed below the parameter estimates.What does the model predict sales volume to be if using the corrected predictor when income is $4000 per month?
A)708,133.68
B)723,146.11
C)163.73
D)167.20
Unlock Deck
Unlock for access to all 20 flashcards in this deck.
Unlock Deck
k this deck
19
When should a researcher consider transforming the explanatory variable in a simple linear regression model?
A)when a data plot suggests there is a non-linear functional form
B)to get a coefficient estimate with the sign predicted by economic theory
C)to reduce the variation in the explanatory variable
D)to maximize SSR
A)when a data plot suggests there is a non-linear functional form
B)to get a coefficient estimate with the sign predicted by economic theory
C)to reduce the variation in the explanatory variable
D)to maximize SSR
Unlock Deck
Unlock for access to all 20 flashcards in this deck.
Unlock Deck
k this deck
20
When the residuals from a simple regression model appear to be correlated with x,this is known as_______________________________.
Unlock Deck
Unlock for access to all 20 flashcards in this deck.
Unlock Deck
k this deck
Unlock Deck
Unlock for access to all 20 flashcards in this deck.


