Deck 16: Psychology Applied to Work
Full screen (f)
Question
Question
Question
Question
Question
Question
Question
Question
Question
Question
Question
Question
Question
Question
Question
Question
Question
Question
Question
Question
Question
Question
Question
Question
Question
Question
Question
Question
Question
Question
Question
Question
Question
Question
Question
Question
Question
Question
Question
Question
Question
Question
Question
The following graph is a ________. 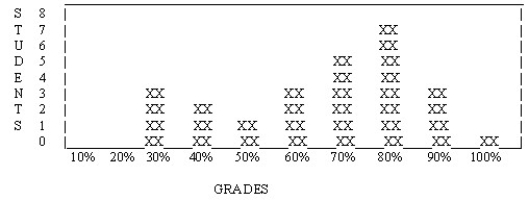
A) frequency polygon
B) skewed distribution
C) frequency histogram
D) normal distribution
A) frequency polygon
B) skewed distribution
C) frequency histogram
D) normal distribution
Question
Question
Question
Question
Question
The following distribution is ________. 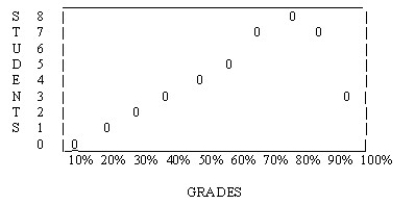
A) normal
B) bimodal
C) skewed to the left
D) skewed to the right
A) normal
B) bimodal
C) skewed to the left
D) skewed to the right
Question
Question
Question
The following distribution is ________. 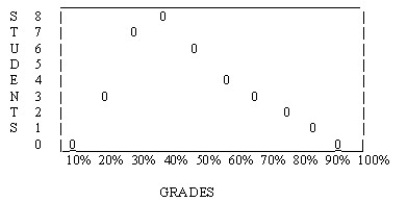
A) skewed to the left
B) normal
C) bimodal
D) skewed to the right
A) skewed to the left
B) normal
C) bimodal
D) skewed to the right
Question
Question
Question
Question
Question
Question
Question
Question
The following distribution is ________. 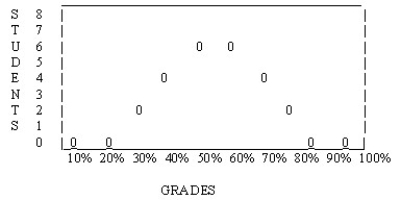
A) normal
B) bimodal
C) skewed to the right
D) skewed to the left
A) normal
B) bimodal
C) skewed to the right
D) skewed to the left
Question
Question
Question
Question
Question
Question
Question
Question
Question
Question
Question
Question
Question
Question
Question
Question
Question
Question
Question
Question
Question

Unlock Deck
Sign up to unlock the cards in this deck!
Unlock Deck
Unlock Deck
1/101
Play
Full screen (f)
Deck 16: Psychology Applied to Work
1
An ordinal scale ________ equal distances between the points and ________ a true zero.
A) does not have; has
B) has; has
C) does not have; does not have
D) has; does not have
A) does not have; has
B) has; has
C) does not have; does not have
D) has; does not have
does not have; does not have
2
Which of the following is true regarding statistics?
A) They guide the conclusions scientists draw from research.
B) They cannot provide definitive conclusions that researchers can draw on to generate theories.
C) They are generally considered optional when conducting an experiment or designing a test.
D) They often interfere with a scientist's ability to organize and describe data.
They guide the conclusions scientists draw from research.
3
Each of the following is true except ________.
A) no matter what we are measuring, we have to use a scale to measure it
B) a nominal scale is more a way of measuring than classifying
C) the type of scale we use helps determine the conclusions we draw from our data
D) statistics is a branch of mathematics
A) no matter what we are measuring, we have to use a scale to measure it
B) a nominal scale is more a way of measuring than classifying
C) the type of scale we use helps determine the conclusions we draw from our data
D) statistics is a branch of mathematics
a nominal scale is more a way of measuring than classifying
4
A professor who classifies the students in the class according to whether or not they are psychology majors is using a(n) ________ scale.
A) nominal
B) ratio
C) ordinal
D) interval
A) nominal
B) ratio
C) ordinal
D) interval
Unlock Deck
Unlock for access to all 101 flashcards in this deck.
Unlock Deck
k this deck
5
A scale with equal distances between the points or values with a true zero point is a(n) ________ scale.
A) ordinal
B) nominal
C) interval
D) ratio
A) ordinal
B) nominal
C) interval
D) ratio
Unlock Deck
Unlock for access to all 101 flashcards in this deck.
Unlock Deck
k this deck
6
A scale that ranks preferences on a continuum from lowest to highest is a(n) ________ scale.
A) ordinal
B) interval
C) nominal
D) ratio
A) ordinal
B) interval
C) nominal
D) ratio
Unlock Deck
Unlock for access to all 101 flashcards in this deck.
Unlock Deck
k this deck
7
On a(n) ________ scale, data are ranked from first to last according to some criterion, and the distance between points on the scale are not specified.
A) nominal
B) interval
C) ratio
D) ordinal
A) nominal
B) interval
C) ratio
D) ordinal
Unlock Deck
Unlock for access to all 101 flashcards in this deck.
Unlock Deck
k this deck
8
A branch of mathematics that psychologists use to organize and analyze data is known as ________.
A) calculus
B) vector analysis
C) quantum theory
D) statistics
A) calculus
B) vector analysis
C) quantum theory
D) statistics
Unlock Deck
Unlock for access to all 101 flashcards in this deck.
Unlock Deck
k this deck
9
A scale with equal distances between the points, or values, but without a true zero is called a(n) ________ scale.
A) interval
B) ordinal
C) nominal
D) ratio
A) interval
B) ordinal
C) nominal
D) ratio
Unlock Deck
Unlock for access to all 101 flashcards in this deck.
Unlock Deck
k this deck
10
Classifying workers in a factory according to whether they are blue-collar or white-collar workers is using a(n) ________ scale.
A) nominal
B) ordinal
C) ratio
D) interval
A) nominal
B) ordinal
C) ratio
D) interval
Unlock Deck
Unlock for access to all 101 flashcards in this deck.
Unlock Deck
k this deck
11
A scale that tells us about order but nothing about the distances between the quantities that are ordered is a(n) ________ scale.
A) ordinal
B) nominal
C) interval
D) ratio
A) ordinal
B) nominal
C) interval
D) ratio
Unlock Deck
Unlock for access to all 101 flashcards in this deck.
Unlock Deck
k this deck
12
The scale that provides the least information is a(n) ________ scale.
A) nominal
B) interval
C) ratio
D) ordinal
A) nominal
B) interval
C) ratio
D) ordinal
Unlock Deck
Unlock for access to all 101 flashcards in this deck.
Unlock Deck
k this deck
13
A ratio scale ________ equal distances between the points and ________ a true zero.
A) has; does not have
B) does not have; has
C) does not have; does not have
D) has; has
A) has; does not have
B) does not have; has
C) does not have; does not have
D) has; has
Unlock Deck
Unlock for access to all 101 flashcards in this deck.
Unlock Deck
k this deck
14
A 4-point scale that measures the quality of beef is a(n) ________ scale.
A) nominal
B) ratio
C) interval
D) ordinal
A) nominal
B) ratio
C) interval
D) ordinal
Unlock Deck
Unlock for access to all 101 flashcards in this deck.
Unlock Deck
k this deck
15
A student ranking various graduate schools on a 5-point scale is using a(n) ________ scale.
A) nominal
B) interval
C) ratio
D) ordinal
A) nominal
B) interval
C) ratio
D) ordinal
Unlock Deck
Unlock for access to all 101 flashcards in this deck.
Unlock Deck
k this deck
16
A thermometer uses a(n) ________ scale.
A) nominal
B) ordinal
C) ratio
D) interval
A) nominal
B) ordinal
C) ratio
D) interval
Unlock Deck
Unlock for access to all 101 flashcards in this deck.
Unlock Deck
k this deck
17
A scale that is simply a set of categories for classifying objects is a(n) ________ scale.
A) ratio
B) ordinal
C) nominal
D) interval
A) ratio
B) ordinal
C) nominal
D) interval
Unlock Deck
Unlock for access to all 101 flashcards in this deck.
Unlock Deck
k this deck
18
Categorizing people according to whether they voted yes or no on a particular issue is an example of a(n) ________ scale.
A) interval
B) nominal
C) ratio
D) ordinal
A) interval
B) nominal
C) ratio
D) ordinal
Unlock Deck
Unlock for access to all 101 flashcards in this deck.
Unlock Deck
k this deck
19
Each of the following is true of an interval scale except that it ________.
A) is the least informative measurement scale
B) tells us how many equal-size units of one thing lies above or below another thing of the same kind
C) has no absolute zero
D) cannot tell us how many times bigger, smaller, taller, or fatter one thing is from another
A) is the least informative measurement scale
B) tells us how many equal-size units of one thing lies above or below another thing of the same kind
C) has no absolute zero
D) cannot tell us how many times bigger, smaller, taller, or fatter one thing is from another
Unlock Deck
Unlock for access to all 101 flashcards in this deck.
Unlock Deck
k this deck
20
An IQ test typically rates people according to a(n) ________ scale.
A) nominal
B) interval
C) ratio
D) ordinal
A) nominal
B) interval
C) ratio
D) ordinal
Unlock Deck
Unlock for access to all 101 flashcards in this deck.
Unlock Deck
k this deck
21
The mean of a set of numbers 5, 5, 6, 6, 10, 10 is ________.
A) 6
B) 8
C) 9
D) 7
A) 6
B) 8
C) 9
D) 7
Unlock Deck
Unlock for access to all 101 flashcards in this deck.
Unlock Deck
k this deck
22
Which of the following is not a measure of central tendency?
A) median
B) mean
C) range
D) mode
A) median
B) mean
C) range
D) mode
Unlock Deck
Unlock for access to all 101 flashcards in this deck.
Unlock Deck
k this deck
23
Birth and death rates would be two measures that would use a(n) ________ scale.
A) ratio
B) nominal
C) ordinal
D) interval
A) ratio
B) nominal
C) ordinal
D) interval
Unlock Deck
Unlock for access to all 101 flashcards in this deck.
Unlock Deck
k this deck
24
The sum of all the scores in a group divided by the number of scores is a measure called ________.
A) range
B) mode
C) mean
D) median
A) range
B) mode
C) mean
D) median
Unlock Deck
Unlock for access to all 101 flashcards in this deck.
Unlock Deck
k this deck
25
Measurements of age use a(n) ________ scale.
A) ordinal
B) ratio
C) interval
D) nominal
A) ordinal
B) ratio
C) interval
D) nominal
Unlock Deck
Unlock for access to all 101 flashcards in this deck.
Unlock Deck
k this deck
26
The most frequently occurring score in a set of scores is called the ________.
A) median
B) mode
C) range
D) mean
A) median
B) mode
C) range
D) mean
Unlock Deck
Unlock for access to all 101 flashcards in this deck.
Unlock Deck
k this deck
27
In the set of scores 90, 80, 70, the ________.
A) mean is equal to the mode
B) mean is equal to the median
C) mean is greater than the median
D) median is greater than the mean
A) mean is equal to the mode
B) mean is equal to the median
C) mean is greater than the median
D) median is greater than the mean
Unlock Deck
Unlock for access to all 101 flashcards in this deck.
Unlock Deck
k this deck
28
The median for the set of scores 12, 28, 33, 45, 67, 67, 98 is ________.
A) 50
B) 45
C) 98
D) 67
A) 50
B) 45
C) 98
D) 67
Unlock Deck
Unlock for access to all 101 flashcards in this deck.
Unlock Deck
k this deck
29
A count of the number of scores that fall within each of a series of intervals is a ________.
A) normal curve
B) factor analysis
C) standard deviation
D) frequency distribution
A) normal curve
B) factor analysis
C) standard deviation
D) frequency distribution
Unlock Deck
Unlock for access to all 101 flashcards in this deck.
Unlock Deck
k this deck
30
The auto theft rates of various cities in a state (for example: 15 thefts per 10,000 population) is an example of a(n) ________ scale.
A) ordinal
B) ratio
C) nominal
D) interval
A) ordinal
B) ratio
C) nominal
D) interval
Unlock Deck
Unlock for access to all 101 flashcards in this deck.
Unlock Deck
k this deck
31
The median for the set of scores 6, 9, 10, 11, 15, 15 is ________.
A) 9
B) 15
C) 10.5
D) 11.2
A) 9
B) 15
C) 10.5
D) 11.2
Unlock Deck
Unlock for access to all 101 flashcards in this deck.
Unlock Deck
k this deck
32
For the set of numbers 2, 4, 6, 6, the ________.
A) mean is equal to the mode
B) median is equal to the mode
C) median is greater than the mean
D) mean is greater than the median
A) mean is equal to the mode
B) median is equal to the mode
C) median is greater than the mean
D) mean is greater than the median
Unlock Deck
Unlock for access to all 101 flashcards in this deck.
Unlock Deck
k this deck
33
In a set of incomes in which most people are in the $15,000 through $40,000 range, which measure of central tendency would be most disturbed by an income of $1 million?
A) mode
B) median
C) mean
D) frequency
A) mode
B) median
C) mean
D) frequency
Unlock Deck
Unlock for access to all 101 flashcards in this deck.
Unlock Deck
k this deck
34
The mean of a set of numbers 100, 90, 80, 50, 30 is ________.
A) 100
B) 80
C) 50
D) 70
A) 100
B) 80
C) 50
D) 70
Unlock Deck
Unlock for access to all 101 flashcards in this deck.
Unlock Deck
k this deck
35
We can say that one measurement is twice as large as another when ________ scales are used.
A) ordinal
B) nominal
C) ratio
D) interval
A) ordinal
B) nominal
C) ratio
D) interval
Unlock Deck
Unlock for access to all 101 flashcards in this deck.
Unlock Deck
k this deck
36
The point that divides a set of numbers in half is the ________.
A) median
B) mean
C) mode
D) range
A) median
B) mean
C) mode
D) range
Unlock Deck
Unlock for access to all 101 flashcards in this deck.
Unlock Deck
k this deck
37
There is a zero on a(n) ________ scale only.
A) ratio
B) interval
C) nominal
D) ordinal
A) ratio
B) interval
C) nominal
D) ordinal
Unlock Deck
Unlock for access to all 101 flashcards in this deck.
Unlock Deck
k this deck
38
The tendency of measurements to cluster around some value near the middle is called the ________.
A) central tendency
B) norm
C) nominal tendency
D) peripheral tendency
A) central tendency
B) norm
C) nominal tendency
D) peripheral tendency
Unlock Deck
Unlock for access to all 101 flashcards in this deck.
Unlock Deck
k this deck
39
A store owner wishes to determine which shoe size she should stock in the greatest quantity. She would be most interested in the ________ of her customers' shoe sizes.
A) mean
B) range
C) mode
D) median
A) mean
B) range
C) mode
D) median
Unlock Deck
Unlock for access to all 101 flashcards in this deck.
Unlock Deck
k this deck
40
The arithmetical average is also called the ________.
A) range
B) mean
C) mode
D) median
A) range
B) mean
C) mode
D) median
Unlock Deck
Unlock for access to all 101 flashcards in this deck.
Unlock Deck
k this deck
41
A line graph showing a frequency distribution is called a ________.
A) skewed distribution
B) normal distribution
C) frequency polygon
D) frequency histogram
A) skewed distribution
B) normal distribution
C) frequency polygon
D) frequency histogram
Unlock Deck
Unlock for access to all 101 flashcards in this deck.
Unlock Deck
k this deck
42
In a frequency histogram, frequency is usually marked along the ________.
A) horizontal (x) axis
B) diagonal
C) vertical (y) axis
D) bar heights
A) horizontal (x) axis
B) diagonal
C) vertical (y) axis
D) bar heights
Unlock Deck
Unlock for access to all 101 flashcards in this deck.
Unlock Deck
k this deck
43
The following graph is a ________.
A) frequency polygon
B) skewed distribution
C) frequency histogram
D) normal distribution
A) frequency polygon
B) skewed distribution
C) frequency histogram
D) normal distribution
Unlock Deck
Unlock for access to all 101 flashcards in this deck.
Unlock Deck
k this deck
44
A bar graph showing a frequency distribution is called a ________.
A) skewed distribution
B) frequency histogram
C) frequency polygon
D) normal distribution
A) skewed distribution
B) frequency histogram
C) frequency polygon
D) normal distribution
Unlock Deck
Unlock for access to all 101 flashcards in this deck.
Unlock Deck
k this deck
45
The scores gather at one end of a ________ distribution.
A) symmetrical
B) normal
C) standard
D) skewed
A) symmetrical
B) normal
C) standard
D) skewed
Unlock Deck
Unlock for access to all 101 flashcards in this deck.
Unlock Deck
k this deck
46
We say that a curve is skewed to the right if the ________.
A) tail on the left is longer
B) tail on the right is longer
C) tail on the right is shorter
D) highest part of the curve lies on the right
A) tail on the left is longer
B) tail on the right is longer
C) tail on the right is shorter
D) highest part of the curve lies on the right
Unlock Deck
Unlock for access to all 101 flashcards in this deck.
Unlock Deck
k this deck
47
If you know that the mean is greater than the median, you can predict that the ________.
A) mode will be equal to the mean
B) frequency polygon will be normal
C) curve will be skewed to the right
D) curve will be skewed to the left
A) mode will be equal to the mean
B) frequency polygon will be normal
C) curve will be skewed to the right
D) curve will be skewed to the left
Unlock Deck
Unlock for access to all 101 flashcards in this deck.
Unlock Deck
k this deck
48
The following distribution is ________.
A) normal
B) bimodal
C) skewed to the left
D) skewed to the right
A) normal
B) bimodal
C) skewed to the left
D) skewed to the right
Unlock Deck
Unlock for access to all 101 flashcards in this deck.
Unlock Deck
k this deck
49
A hypothetical bell-shaped distribution curve that occurs when a normal distribution is plotted as a frequency polygon is called a(n) ________ curve.
A) asymmetrical
B) normal
C) bimodal
D) anomalous
A) asymmetrical
B) normal
C) bimodal
D) anomalous
Unlock Deck
Unlock for access to all 101 flashcards in this deck.
Unlock Deck
k this deck
50
If you know that the median is greater than the mean, you can predict that the ________.
A) curve will be skewed to the left
B) frequency polygon will be normal
C) mode will be equal to the mean
D) curve will be skewed to the right
A) curve will be skewed to the left
B) frequency polygon will be normal
C) mode will be equal to the mean
D) curve will be skewed to the right
Unlock Deck
Unlock for access to all 101 flashcards in this deck.
Unlock Deck
k this deck
51
The following distribution is ________.
A) skewed to the left
B) normal
C) bimodal
D) skewed to the right
A) skewed to the left
B) normal
C) bimodal
D) skewed to the right
Unlock Deck
Unlock for access to all 101 flashcards in this deck.
Unlock Deck
k this deck
52
When two modes occur in a distribution, it is called a _________ distribution.
A) multiple
B) bimodal
C) skewed
D) normal
A) multiple
B) bimodal
C) skewed
D) normal
Unlock Deck
Unlock for access to all 101 flashcards in this deck.
Unlock Deck
k this deck
53
In a frequency histogram, the intervals are usually marked along the ________.
A) bar heights
B) diagonal
C) vertical (y) axis
D) horizontal (x) axis
A) bar heights
B) diagonal
C) vertical (y) axis
D) horizontal (x) axis
Unlock Deck
Unlock for access to all 101 flashcards in this deck.
Unlock Deck
k this deck
54
The scores gather at one end of a ________ distribution.
A) symmetrical
B) normal
C) standard
D) skewed
A) symmetrical
B) normal
C) standard
D) skewed
Unlock Deck
Unlock for access to all 101 flashcards in this deck.
Unlock Deck
k this deck
55
The normal curve is ________.
A) symmetrical
B) asymmetrical
C) skewed
D) bimodal
A) symmetrical
B) asymmetrical
C) skewed
D) bimodal
Unlock Deck
Unlock for access to all 101 flashcards in this deck.
Unlock Deck
k this deck
56
If we take a large enough number of measurements of almost any characteristic, the result is most likely to be ________.
A) skewed
B) bimodal
C) mediated
D) normal
A) skewed
B) bimodal
C) mediated
D) normal
Unlock Deck
Unlock for access to all 101 flashcards in this deck.
Unlock Deck
k this deck
57
We say that a curve is skewed to the left if the ________.
A) tail on the left is shorter
B) tail on the right is longer
C) highest part of the curve lies on the left
D) tail on the left is longer
A) tail on the left is shorter
B) tail on the right is longer
C) highest part of the curve lies on the left
D) tail on the left is longer
Unlock Deck
Unlock for access to all 101 flashcards in this deck.
Unlock Deck
k this deck
58
Plotting a normal distribution on a graph yields a ________.
A) frequency histogram
B) normal curve
C) bar graph
D) skewed curve
A) frequency histogram
B) normal curve
C) bar graph
D) skewed curve
Unlock Deck
Unlock for access to all 101 flashcards in this deck.
Unlock Deck
k this deck
59
The following distribution is ________.
A) normal
B) bimodal
C) skewed to the right
D) skewed to the left
A) normal
B) bimodal
C) skewed to the right
D) skewed to the left
Unlock Deck
Unlock for access to all 101 flashcards in this deck.
Unlock Deck
k this deck
60
The mean and the mode fall at the same point in ________ distributions.
A) flat
B) skewed
C) bimodal
D) normal
A) flat
B) skewed
C) bimodal
D) normal
Unlock Deck
Unlock for access to all 101 flashcards in this deck.
Unlock Deck
k this deck
61
About ________ percent of scores fall between the mean and one standard deviation above and below the mean in a normal distribution.
A) 32
B) 34
C) 68
D) 99
A) 32
B) 34
C) 68
D) 99
Unlock Deck
Unlock for access to all 101 flashcards in this deck.
Unlock Deck
k this deck
62
About 99 percent of scores fall between ________ standard deviation(s) above and below the mean in a normal distribution.
A) three
B) two
C) one
D) four
A) three
B) two
C) one
D) four
Unlock Deck
Unlock for access to all 101 flashcards in this deck.
Unlock Deck
k this deck
63
Which of the following questions would be most appropriate in a correlational study?
A) Is party affiliation related to economic status?
B) Why did John change his party affiliation?
C) How often does John vote?
D) What percentage of homes have annual incomes above $15,000?
A) Is party affiliation related to economic status?
B) Why did John change his party affiliation?
C) How often does John vote?
D) What percentage of homes have annual incomes above $15,000?
Unlock Deck
Unlock for access to all 101 flashcards in this deck.
Unlock Deck
k this deck
64
A scatter plot is used to determine ________.
A) significance level
B) correlation
C) median
D) mean
A) significance level
B) correlation
C) median
D) mean
Unlock Deck
Unlock for access to all 101 flashcards in this deck.
Unlock Deck
k this deck
65
Which of the following questions would be most appropriate in a correlational study?
A) What is Sarah's IQ?
B) Is intelligence related to creativity?
C) How many males and females have IQ scores over 120?
D) What is Sarah's IQ in relation to William's IQ?
A) What is Sarah's IQ?
B) Is intelligence related to creativity?
C) How many males and females have IQ scores over 120?
D) What is Sarah's IQ in relation to William's IQ?
Unlock Deck
Unlock for access to all 101 flashcards in this deck.
Unlock Deck
k this deck
66
The difference between the highest and the lowest measurements is the ________.
A) mode
B) standard deviation
C) range
D) level of significance
A) mode
B) standard deviation
C) range
D) level of significance
Unlock Deck
Unlock for access to all 101 flashcards in this deck.
Unlock Deck
k this deck
67
Which number tells us the most about how the scores in a frequency distribution are dispersed around the mean?
A) range
B) correlation coefficient
C) standard deviation
D) probability ratio
A) range
B) correlation coefficient
C) standard deviation
D) probability ratio
Unlock Deck
Unlock for access to all 101 flashcards in this deck.
Unlock Deck
k this deck
68
In a set of test scores, the mean is 10 and the standard deviation is 2. With these two numbers we know that 95% of the scores fall between ________.
A) 9 and 11
B) 6 and 14
C) 4 and 16
D) 8 and 12
A) 9 and 11
B) 6 and 14
C) 4 and 16
D) 8 and 12
Unlock Deck
Unlock for access to all 101 flashcards in this deck.
Unlock Deck
k this deck
69
The simplest measure of variation is the ________.
A) standard deviation
B) range
C) mean
D) significance
A) standard deviation
B) range
C) mean
D) significance
Unlock Deck
Unlock for access to all 101 flashcards in this deck.
Unlock Deck
k this deck
70
Ashley has measured heights of basketball players at her school. In order to fully describe the distribution of her data, Ashley will need to determine the central tendency and ___________ in the players' heights.
A) scale of measurement
B) probability
C) variation
D) correlation
A) scale of measurement
B) probability
C) variation
D) correlation
Unlock Deck
Unlock for access to all 101 flashcards in this deck.
Unlock Deck
k this deck
71
Which of the following can be used to describe if two or more sets of measurements are in any way associated with each other?
A) measures of central tendency
B) measures of correlation
C) measures of variation
D) measures of central tendency, variation, and correlation
A) measures of central tendency
B) measures of correlation
C) measures of variation
D) measures of central tendency, variation, and correlation
Unlock Deck
Unlock for access to all 101 flashcards in this deck.
Unlock Deck
k this deck
72
For the numbers 100, 90, 80, 60, the range is ________.
A) 50
B) 40
C) 80
D) 60
A) 50
B) 40
C) 80
D) 60
Unlock Deck
Unlock for access to all 101 flashcards in this deck.
Unlock Deck
k this deck
73
About ________ percent of scores fall between 2 standard deviations above and below the mean.
A) 95
B) 96
C) 99
D) 68
A) 95
B) 96
C) 99
D) 68
Unlock Deck
Unlock for access to all 101 flashcards in this deck.
Unlock Deck
k this deck
74
About ________ percent of scores fall between 3 standard deviations above and 3 standard deviations below the mean in a normal distribution.
A) 96
B) 99
C) 95
D) 68
A) 96
B) 99
C) 95
D) 68
Unlock Deck
Unlock for access to all 101 flashcards in this deck.
Unlock Deck
k this deck
75
A pattern of dots indicating scores on two different characteristics is called a ________.
A) bar graph
B) frequency histogram
C) scatter plot
D) frequency polygon
A) bar graph
B) frequency histogram
C) scatter plot
D) frequency polygon
Unlock Deck
Unlock for access to all 101 flashcards in this deck.
Unlock Deck
k this deck
76
About 95 percent of scores fall between ________ standard deviation(s) above and below the mean in a normal distribution.
A) four
B) one
C) three
D) two
A) four
B) one
C) three
D) two
Unlock Deck
Unlock for access to all 101 flashcards in this deck.
Unlock Deck
k this deck
77
In a set of survey results, the mean is 15 and the standard deviation is 3. With these numbers we know that 99% of the scores are between ________.
A) 6 and 24
B) 12 and 18
C) 0 and 30
D) 9 and 21
A) 6 and 24
B) 12 and 18
C) 0 and 30
D) 9 and 21
Unlock Deck
Unlock for access to all 101 flashcards in this deck.
Unlock Deck
k this deck
78
For the numbers 17, 2, 9, 12, 15, the range is ________.
A) 15
B) 9
C) 12
D) 2
A) 15
B) 9
C) 12
D) 2
Unlock Deck
Unlock for access to all 101 flashcards in this deck.
Unlock Deck
k this deck
79
About 68 percent of scores fall between ________ standard deviation(s) above and below the mean in a normal distribution.
A) two
B) one
C) three
D) four
A) two
B) one
C) three
D) four
Unlock Deck
Unlock for access to all 101 flashcards in this deck.
Unlock Deck
k this deck
80
To find the standard deviation, we must first find the ________.
A) range
B) median
C) mean
D) mode
A) range
B) median
C) mean
D) mode
Unlock Deck
Unlock for access to all 101 flashcards in this deck.
Unlock Deck
k this deck
Unlock Deck
Unlock for access to all 101 flashcards in this deck.


