Deck 19: Economic Inequality
Full screen (f)
Question
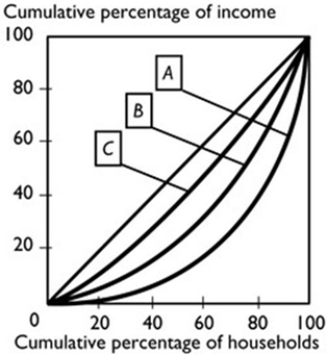
In the figure above, the nation with the least equal distribution of income is nation
A) A.
B) B.
C) C.
D) The distribution of income is the same in all three nations because their Lorenz curves can be plotted on the same diagram.
E) It is impossible to determine with the information given.
Question
In the figure above, the nation with the most equal distribution of income is nation
A) A.
B) B.
C) C.
D) The distribution of income is the same in all three.
E) It is impossible to determine with the information given.
Question
Question
Comparing the wealth and income distribution in Australia, we see that
A) income is distributed less equally than wealth.
B) we cannot compare the distribution of wealth and income.
C) wealth is distributed less equally than income.
D) because wealth and income are different terms for the same thing, the distributions are the same.
E) None of the above answers is correct.
Question
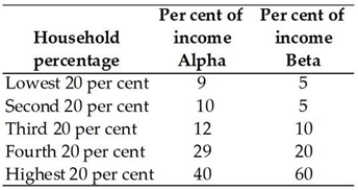
The above table shows the distribution of income in two countries, Alpha and Beta. In Country Alpha, the poorest 20 per cent receive ________ per cent of total income.
A) 9
B) 19
C) 14
D) 1
E) 5
Question
Question
Question
Question
Question
Question
Which of the following statements is correct?
A) Wealth inequality in Australia is greater than income inequality.
B) Income inequality in Australia is greater than wealth inequality.
C) The fraction of wealth owned by the bottom 20 per cent of households is larger than the fraction income earned by the bottom 20 per cent of households.
D) Income includes all the things owned by a household at a certain point in time.
E) The top fifth of households have a greater share of the nation's income than the nation's wealth.
Question
In the figure above, the nation with the highest average income is nation
A) A.
B) B.
C) C.
D) The average income is the same in all three nations because their Lorenz curves can be plotted on the same diagram.
E) It is impossible to determine with the information given.
Question
The above table shows the distribution of income in two countries, Alpha and Beta. Based on these distributions of income,
A) both countries have equal distributions because 100 per cent of the incomes are accounted for.
B) Country Beta has more equal income distribution than Country Alpha.
C) Country Alpha has a more equal distribution of income than Country Beta.
D) the Lorenz Curve for country Beta is closer to the line of equality.
E) It is impossible to answer the question without more information.
Question
Question
Question
Question
Question
The above table shows the distribution of income in two countries, Alpha and Beta. In Country Beta, the richest 40 per cent of households receive ________ per cent of total income.
A) 40
B) 20
C) 80
D) 60
E) 100
Question
Question
Question
Question
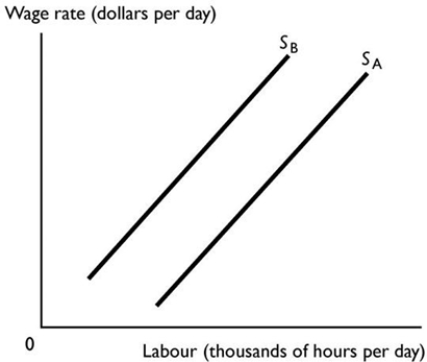
The figure above shows the market for high- and low-skilled labour. Supply curve SB represents the supply of ________ labour because ________.
A) low-skilled; low-skilled labour must work more hours to compensate for the lower wage
B) high-skilled; firms supply more jobs for high-skilled workers
C) low-skilled; firms supply fewer jobs for low-skilled labour
D) high-skilled; these workers must receive higher pay in return for acquiring their skills
E) low-skilled; low-skilled labour has a lower value of marginal product
Question
Question
Question
Question
Question
Question
Question
Question
Question
Question
Question
Question
Question
The three main ways that the Australian government redistributes income are
A) income taxes, rent control and subsidised services.
B) using the rule of law, subsidised services and income taxes.
C) sales taxes, rent control and subsidised services.
D) private property rights, income taxes and the minimum wage.
E) income taxes, income maintenance programs and subsidised services.
Question
Question
Question
Which of the following currently helps redistribute income in Australia? i. Negative income tax
Ii) Progressive income taxes
Iii) Pensions and benefits
A) i and iii
B) iii only
C) i and ii
D) ii and iii
E) i, ii and iii
Question
Question
A tax is progressive if the average tax rate
A) increases as income increases.
B) is positive.
C) increases as income decreases.
D) is negative.
Question
Question
Question
Suppose a government imposes the following tax rates on its citizens. 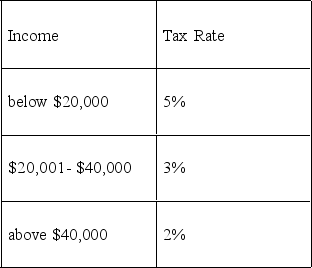 The government has imposed a ________ tax system because the tax rate ________ with the level of income.
A) regressive; decreases
B) regressive; increases
C) proportional; falls proportionally
D) progressive; decreases
E) progressive; increases
The government has imposed a ________ tax system because the tax rate ________ with the level of income.A) regressive; decreases
B) regressive; increases
C) proportional; falls proportionally
D) progressive; decreases
E) progressive; increases
Question
Question
Question
Question
Question
Question
Question
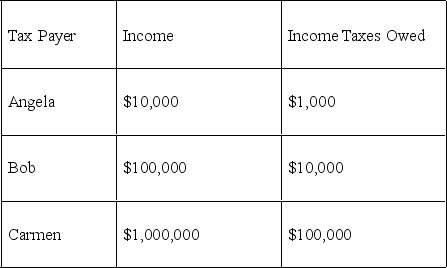
The table above shows three taxpayers, their incomes, and taxes owed. The data reflect a ________ income tax system because people pay ________.
A) proportional; the same proportion of their income as taxes regardless of their level of income.
B) regressive; a larger portion of their income as taxes as income increases
C) flat-rate; the same AMOUNT of taxes regardless of their income
D) progressive; a smaller portion of their income as taxes as income increases
E) negative; a smaller portion of their income as taxes as income increases
Question
Question
Question

Unlock Deck
Sign up to unlock the cards in this deck!
Unlock Deck
Unlock Deck
1/53
Play
Full screen (f)
Deck 19: Economic Inequality
1
In the figure above, the nation with the least equal distribution of income is nation
A) A.
B) B.
C) C.
D) The distribution of income is the same in all three nations because their Lorenz curves can be plotted on the same diagram.
E) It is impossible to determine with the information given.
A.
2
In the figure above, the nation with the most equal distribution of income is nation
A) A.
B) B.
C) C.
D) The distribution of income is the same in all three.
E) It is impossible to determine with the information given.
C.
3
If the income distribution is more unequal than the wealth distribution, then the
A) Lorenz curve for income will be further away from the line of equality than the Lorenz curve for wealth.
B) Lorenz curve for wealth will lie above the Lorenz curve for income.
C) Lorenz curve for wealth will be further away from the line of equality than the Lorenz curve for income.
D) government has imposed a higher tax rate on income.
E) it is not possible to draw the Lorenz curves for wealth and income in the same figure.
Lorenz curve for income will be further away from the line of equality than the Lorenz curve for wealth.
4
Comparing the wealth and income distribution in Australia, we see that
A) income is distributed less equally than wealth.
B) we cannot compare the distribution of wealth and income.
C) wealth is distributed less equally than income.
D) because wealth and income are different terms for the same thing, the distributions are the same.
E) None of the above answers is correct.
Unlock Deck
Unlock for access to all 53 flashcards in this deck.
Unlock Deck
k this deck
5
The above table shows the distribution of income in two countries, Alpha and Beta. In Country Alpha, the poorest 20 per cent receive ________ per cent of total income.
A) 9
B) 19
C) 14
D) 1
E) 5
Unlock Deck
Unlock for access to all 53 flashcards in this deck.
Unlock Deck
k this deck
6
The inequality of annual income
A) cannot change from one year to the next.
B) is about the same as the amount of lifetime inequality.
C) cannot be compared to the amount of lifetime inequality.
D) understates the amount of lifetime inequality.
E) overstates the amount of lifetime inequality.
A) cannot change from one year to the next.
B) is about the same as the amount of lifetime inequality.
C) cannot be compared to the amount of lifetime inequality.
D) understates the amount of lifetime inequality.
E) overstates the amount of lifetime inequality.
Unlock Deck
Unlock for access to all 53 flashcards in this deck.
Unlock Deck
k this deck
7
Country A has a more equal distribution of income than country B if
A) country A's Lorenz curve is closer to the line of equality than country B's Lorenz curve.
B) country A's Lorenz curve is just as close to the line of equality as country B's Lorenz curve.
C) country A's Lorenz curve lies below country B's Lorenz curve at low levels of income and above it at high levels of income.
D) country B's Lorenz curve is closer to the line of equality than country A's Lorenz curve.
E) None of the above because it is impossible to compare income inequalities across countries.
Unlock Deck
Unlock for access to all 53 flashcards in this deck.
Unlock Deck
k this deck
8
In Australia, the poorest 20 per cent of households receive about ________ per cent of total money income while the richest 20 per cent receive about ________ per cent of total money income.
A) 8; 71
B) 20; 20
C) 13; 68
D) 12; 32
E) 8; 40
A) 8; 71
B) 20; 20
C) 13; 68
D) 12; 32
E) 8; 40
Unlock Deck
Unlock for access to all 53 flashcards in this deck.
Unlock Deck
k this deck
9
The factor that leads to the LARGEST difference in households' incomes is
A) education.
B) ethnicity.
C) size of household.
D) gender.
E) location of household.
A) education.
B) ethnicity.
C) size of household.
D) gender.
E) location of household.
Unlock Deck
Unlock for access to all 53 flashcards in this deck.
Unlock Deck
k this deck
10
Measured annual income inequality overstates actual lifetime inequality because
A) homeless people are not always counted.
B) people differ in the amount of education they have attained.
C) poverty levels vary across states.
D) different households are in different stages in the life cycle.
E) people tend to overstate their incomes.
A) homeless people are not always counted.
B) people differ in the amount of education they have attained.
C) poverty levels vary across states.
D) different households are in different stages in the life cycle.
E) people tend to overstate their incomes.
Unlock Deck
Unlock for access to all 53 flashcards in this deck.
Unlock Deck
k this deck
11
Which of the following statements is correct?
A) Wealth inequality in Australia is greater than income inequality.
B) Income inequality in Australia is greater than wealth inequality.
C) The fraction of wealth owned by the bottom 20 per cent of households is larger than the fraction income earned by the bottom 20 per cent of households.
D) Income includes all the things owned by a household at a certain point in time.
E) The top fifth of households have a greater share of the nation's income than the nation's wealth.
Unlock Deck
Unlock for access to all 53 flashcards in this deck.
Unlock Deck
k this deck
12
In the figure above, the nation with the highest average income is nation
A) A.
B) B.
C) C.
D) The average income is the same in all three nations because their Lorenz curves can be plotted on the same diagram.
E) It is impossible to determine with the information given.
Unlock Deck
Unlock for access to all 53 flashcards in this deck.
Unlock Deck
k this deck
13
The above table shows the distribution of income in two countries, Alpha and Beta. Based on these distributions of income,
A) both countries have equal distributions because 100 per cent of the incomes are accounted for.
B) Country Beta has more equal income distribution than Country Alpha.
C) Country Alpha has a more equal distribution of income than Country Beta.
D) the Lorenz Curve for country Beta is closer to the line of equality.
E) It is impossible to answer the question without more information.
Unlock Deck
Unlock for access to all 53 flashcards in this deck.
Unlock Deck
k this deck
14
Lorenz curves are
A) vertical.
B) horizontal.
C) upward sloping.
D) straight lines.
E) downward sloping.
A) vertical.
B) horizontal.
C) upward sloping.
D) straight lines.
E) downward sloping.
Unlock Deck
Unlock for access to all 53 flashcards in this deck.
Unlock Deck
k this deck
15
Workers who have invested in education and training
A) have a more difficult time finding a job because their wage rate is higher.
B) have a higher value of marginal product.
C) have identical supply curves to otherwise similar workers who have not invested in education and training.
D) are more likely to find jobs that are not rewarding.
E) None of the above answers is correct.
Unlock Deck
Unlock for access to all 53 flashcards in this deck.
Unlock Deck
k this deck
16
Which of the following statements is true regarding the distribution of income in Australia?
A) The Lorenz curve shows that incomes are distributed fairly.
B) The line of equality shows that incomes are distributed equally.
C) The inequality in the distribution of income can be seen because the Lorenz curve lies above the line of equality.
D) The inequality in the distribution of income can be seen because the Lorenz curve lies below the line of equality.
E) Both answers A and B are correct.
Unlock Deck
Unlock for access to all 53 flashcards in this deck.
Unlock Deck
k this deck
17
A Lorenz curve for income shows the
A) total amount of income graphed against the total number of households.
B) cumulative percentage of income graphed against cumulative percentage of households.
C) demand for Lorenz cough drops.
D) average income graphed against the average number of people in the household.
E) relationship between income and wealth.
Unlock Deck
Unlock for access to all 53 flashcards in this deck.
Unlock Deck
k this deck
18
The above table shows the distribution of income in two countries, Alpha and Beta. In Country Beta, the richest 40 per cent of households receive ________ per cent of total income.
A) 40
B) 20
C) 80
D) 60
E) 100
Unlock Deck
Unlock for access to all 53 flashcards in this deck.
Unlock Deck
k this deck
19
Poverty for a household is defined as the state of
A) having a total income that is below the median total income.
B) income below what is thought necessary for food, shelter and clothing.
C) income below what is thought fair.
D) having an income that can be spent on food, shelter and clothing that is below the median for food, shelter and clothing.
E) having an income that is below average.
Unlock Deck
Unlock for access to all 53 flashcards in this deck.
Unlock Deck
k this deck
20
If the Lorenz curve for income moves upward toward the 45° line, then the
A) total household income decreased.
B) total household income increased.
C) mean (average) household income increased.
D) distribution of income has become more unequal.
E) distribution of income has become more equal.
A) total household income decreased.
B) total household income increased.
C) mean (average) household income increased.
D) distribution of income has become more unequal.
E) distribution of income has become more equal.
Unlock Deck
Unlock for access to all 53 flashcards in this deck.
Unlock Deck
k this deck
21
The demand curve for high-skilled workers
A) lies to the right of the demand curve for low-skilled workers at high wages and to the left of the demand curve for low-skilled workers at low wages.
B) lies to the left of the demand curve for low-skilled workers.
C) lies to the right of the demand curve for low-skilled workers.
D) is vertical.
E) is horizontal.
Unlock Deck
Unlock for access to all 53 flashcards in this deck.
Unlock Deck
k this deck
22
The figure above shows the market for high- and low-skilled labour. Supply curve SB represents the supply of ________ labour because ________.
A) low-skilled; low-skilled labour must work more hours to compensate for the lower wage
B) high-skilled; firms supply more jobs for high-skilled workers
C) low-skilled; firms supply fewer jobs for low-skilled labour
D) high-skilled; these workers must receive higher pay in return for acquiring their skills
E) low-skilled; low-skilled labour has a lower value of marginal product
Unlock Deck
Unlock for access to all 53 flashcards in this deck.
Unlock Deck
k this deck
23
The cost of acquiring a skill accounts for why the
A) supply of high-skilled workers is different to the supply of low-skilled workers.
B) demand for high-skilled workers is different to the supply of low-skilled workers.
C) demand for high-skilled workers is different to the demand for low-skilled workers.
D) demand for high-skilled workers is different to the supply of high-skilled workers.
E) supply curves of high-skilled and low-skilled workers cross.
Unlock Deck
Unlock for access to all 53 flashcards in this deck.
Unlock Deck
k this deck
24
The rates of return on high school and university educations have
A) been estimated at 50 per cent per year.
B) been estimated at between 5 to 10 per cent per year.
C) not been estimated, but are assumed to be high.
D) been estimated as negative, but these are still good options for most.
E) been estimated to be essentially zero.
A) been estimated at 50 per cent per year.
B) been estimated at between 5 to 10 per cent per year.
C) not been estimated, but are assumed to be high.
D) been estimated as negative, but these are still good options for most.
E) been estimated to be essentially zero.
Unlock Deck
Unlock for access to all 53 flashcards in this deck.
Unlock Deck
k this deck
25
Discrimination by customers creates a wage differential between two groups by creating a difference in the two groups'
A) opportunity cost of acquiring skills.
B) marginal cost of labour.
C) minimum wage.
D) supply of labour.
E) value of marginal product.
A) opportunity cost of acquiring skills.
B) marginal cost of labour.
C) minimum wage.
D) supply of labour.
E) value of marginal product.
Unlock Deck
Unlock for access to all 53 flashcards in this deck.
Unlock Deck
k this deck
26
What determines the position of the supply curve of high-skilled workers relative to that of low-skilled workers?
A) The difference in the demand curves for the two groups.
B) Regulatory labour standard guidelines.
C) The cost of acquiring the skill.
D) The difference in the value of the marginal products.
E) None of the above answers is correct.
A) The difference in the demand curves for the two groups.
B) Regulatory labour standard guidelines.
C) The cost of acquiring the skill.
D) The difference in the value of the marginal products.
E) None of the above answers is correct.
Unlock Deck
Unlock for access to all 53 flashcards in this deck.
Unlock Deck
k this deck
27
Which of the following is true? At a given quantity of employment, if the i. value of marginal product of a high-skill worker is $35 and the value of marginal product of a low-skill worker is $10, the value of marginal product of the skill is $25.
Ii) value of marginal product of a high-skill worker is $35 and the value of marginal product of a low-skill worker is $10, the cost of acquiring the skill is $25.
Iii) value of marginal product of a skill is $25, then the wage rate must be $25.
A) i only
B) ii only
C) iii only
D) i and iii
E) ii and iii
Unlock Deck
Unlock for access to all 53 flashcards in this deck.
Unlock Deck
k this deck
28
The vertical distance between the supply curves for neurosurgeons and the supply curve for fast-food servers
A) is the difference in on-the-job training.
B) is the difference in the value of marginal product of the two professions.
C) represents the difference in the demand for these two occupations.
D) equals the difference in the equilibrium wages paid these two professions.
E) is the compensation that neurosurgeons require for the cost of acquiring this skill.
Unlock Deck
Unlock for access to all 53 flashcards in this deck.
Unlock Deck
k this deck
29
Looking at wage differentials between women and men in Australia since 2000, we see that the amount of the difference
A) has not changed.
B) has decreased.
C) has increased.
D) at first increased but in the last decade it decreased.
E) at first decreased but in the last decade it increased.
A) has not changed.
B) has decreased.
C) has increased.
D) at first increased but in the last decade it decreased.
E) at first decreased but in the last decade it increased.
Unlock Deck
Unlock for access to all 53 flashcards in this deck.
Unlock Deck
k this deck
30
High-skilled workers earn more relative to low-skilled workers because the demand for high-skilled workers is ________ that for low-skilled workers and the supply is ________ that for low-skilled workers.
A) lower than; greater than
B) greater than; the same as
C) greater than; lower than
D) lower than; lower than
E) greater than; greater than
A) lower than; greater than
B) greater than; the same as
C) greater than; lower than
D) lower than; lower than
E) greater than; greater than
Unlock Deck
Unlock for access to all 53 flashcards in this deck.
Unlock Deck
k this deck
31
High-skilled workers earn more than low-skilled workers in part because the high-skilled workers have
A) a higher value of marginal product.
B) better health.
C) a greater supply than low-skilled workers.
D) fewer deductions.
E) a lower value of marginal product.
A) a higher value of marginal product.
B) better health.
C) a greater supply than low-skilled workers.
D) fewer deductions.
E) a lower value of marginal product.
Unlock Deck
Unlock for access to all 53 flashcards in this deck.
Unlock Deck
k this deck
32
What economic effect works to eliminate sex and race discrimination?
A) The lower-paid races and sex decrease their demand for goods and services.
B) The lower-paid races and sex give up working and drop out of the labour supply.
C) Firms hire only the preferred races and sex.
D) The value of marginal product of the less-preferred races and sex eventually increases.
E) Customers who discriminate pay higher prices to buy from their preferred races and sex.
Unlock Deck
Unlock for access to all 53 flashcards in this deck.
Unlock Deck
k this deck
33
The gap between the salary of Chris Hemsworth and an unknown actor is over $15 million per movie. This difference means that Mr. Hemsworth's value of marginal product is
A) less than $15 million greater than value of the marginal product of the unknown actor.
B) equal to the value of the marginal product of the unknown actor.
C) over $15 million greater than the value of the marginal product of the unknown actor.
D) $15 million greater than the value of the marginal product of the unknown actor.
E) More information is need to make the comparison.
Unlock Deck
Unlock for access to all 53 flashcards in this deck.
Unlock Deck
k this deck
34
How does the supply curve of high-skilled workers compare to the supply curve of low-skilled workers?
A) Because skills are costly to acquire, at any given wage rate the quantity supplied of high-skilled workers is greater than that of low-skilled workers.
B) Because skills are inexpensive to acquire, at any given wage rate the quantity supplied of high-skilled workers is greater than that of low-skilled workers.
C) Because skills are inexpensive to acquire, at any given wage rate the quantity supplied of high-skilled workers is less than that of low-skilled workers.
D) Because skills are costly to acquire, at any given wage rate the quantity supplied of high-skilled workers is less than that of low-skilled workers.
E) None of the above answers is correct.
Unlock Deck
Unlock for access to all 53 flashcards in this deck.
Unlock Deck
k this deck
35
The three main ways that the Australian government redistributes income are
A) income taxes, rent control and subsidised services.
B) using the rule of law, subsidised services and income taxes.
C) sales taxes, rent control and subsidised services.
D) private property rights, income taxes and the minimum wage.
E) income taxes, income maintenance programs and subsidised services.
Unlock Deck
Unlock for access to all 53 flashcards in this deck.
Unlock Deck
k this deck
36
The higher the cost of acquiring skills, the ________ are the high-skilled and low-skilled labour ________ curves.
A) closer together; supply
B) further apart; supply
C) further apart; demand
D) closer together; demand
A) closer together; supply
B) further apart; supply
C) further apart; demand
D) closer together; demand
Unlock Deck
Unlock for access to all 53 flashcards in this deck.
Unlock Deck
k this deck
37
Inequality in the distribution of income and wealth is increased by
A) marrying outside one's own socioeconomic group.
B) donating money to charities.
C) saving to redistribute an uneven income over the life cycle.
D) federal income tax.
E) the point that the children of the poorest find it difficult to get into university.
A) marrying outside one's own socioeconomic group.
B) donating money to charities.
C) saving to redistribute an uneven income over the life cycle.
D) federal income tax.
E) the point that the children of the poorest find it difficult to get into university.
Unlock Deck
Unlock for access to all 53 flashcards in this deck.
Unlock Deck
k this deck
38
Which of the following currently helps redistribute income in Australia? i. Negative income tax
Ii) Progressive income taxes
Iii) Pensions and benefits
A) i and iii
B) iii only
C) i and ii
D) ii and iii
E) i, ii and iii
Unlock Deck
Unlock for access to all 53 flashcards in this deck.
Unlock Deck
k this deck
39
The ________ the value of marginal product of skill, the ________.
A) larger; more elastic the supply curve of labour
B) larger; larger is the wage differential between low-skilled workers and high-skilled workers
C) smaller; larger is the wage differential between low-skilled workers and high-skilled workers
D) smaller; less elastic the supply curve of labour
E) smaller; larger is the cost of acquiring the skill
Unlock Deck
Unlock for access to all 53 flashcards in this deck.
Unlock Deck
k this deck
40
A tax is progressive if the average tax rate
A) increases as income increases.
B) is positive.
C) increases as income decreases.
D) is negative.
Unlock Deck
Unlock for access to all 53 flashcards in this deck.
Unlock Deck
k this deck
41
In Australia the income tax system is
A) proportional.
B) a flat-rate tax.
C) progressive.
D) regressive.
E) None of the above answers is correct.
A) proportional.
B) a flat-rate tax.
C) progressive.
D) regressive.
E) None of the above answers is correct.
Unlock Deck
Unlock for access to all 53 flashcards in this deck.
Unlock Deck
k this deck
42
The median voter theory predicts income redistribution ________ occur because the median voter ________.
A) will not; faces the big tradeoff
B) will not; usually favours a negative income tax
C) will; will only vote for the political party that supports a utilitarian proposal
D) will not; has his/her disposable income reduced to inefficient levels
E) will; wants to be made as well off as possible
A) will not; faces the big tradeoff
B) will not; usually favours a negative income tax
C) will; will only vote for the political party that supports a utilitarian proposal
D) will not; has his/her disposable income reduced to inefficient levels
E) will; wants to be made as well off as possible
Unlock Deck
Unlock for access to all 53 flashcards in this deck.
Unlock Deck
k this deck
43
Suppose a government imposes the following tax rates on its citizens. The government has imposed a ________ tax system because the tax rate ________ with the level of income.
A) regressive; decreases
B) regressive; increases
C) proportional; falls proportionally
D) progressive; decreases
E) progressive; increases
The government has imposed a ________ tax system because the tax rate ________ with the level of income.A) regressive; decreases
B) regressive; increases
C) proportional; falls proportionally
D) progressive; decreases
E) progressive; increases
Unlock Deck
Unlock for access to all 53 flashcards in this deck.
Unlock Deck
k this deck
44
With a negative income tax that has a $10,000 guaranteed minimum income and a 25 per cent tax rate, a household that has earned income of $16,000 has a total income of
A) $22,000.
B) $10,000.
C) $24,000.
D) $26,000.
E) $16,000.
A) $22,000.
B) $10,000.
C) $24,000.
D) $26,000.
E) $16,000.
Unlock Deck
Unlock for access to all 53 flashcards in this deck.
Unlock Deck
k this deck
45
When the government redistributes income, one dollar collected from a rich person translates into ________ received by a poor person.
A) less than one dollar
B) zero dollars
C) more than one dollar
D) exactly one dollar
E) either exactly one dollar or, with some programs, more than one dollar
A) less than one dollar
B) zero dollars
C) more than one dollar
D) exactly one dollar
E) either exactly one dollar or, with some programs, more than one dollar
Unlock Deck
Unlock for access to all 53 flashcards in this deck.
Unlock Deck
k this deck
46
Which of the following characterises the negative income tax concept?
A) It is a progressive tax structure with enough deductions to provide refunds to some.
B) It is an income tax that eliminates all the inefficiency that occurs with the current tax system.
C) It is a flat tax that lower-income households do not pay.
D) It is a guaranteed annual income with earned incomes taxed at a flat rate.
E) It is a regressive tax with low-income earners getting a refund back when taxes are filed.
Unlock Deck
Unlock for access to all 53 flashcards in this deck.
Unlock Deck
k this deck
47
Looking at the results of government income redistribution programs, we expect to find that the income received by the
A) lowest 20 per cent decreases because of government taxes, and the income received by the highest 20 per cent increases because of government subsidies.
B) lowest 20 per cent increases somewhat, but the income received by the next 20 per cent increases the most.
C) highest 20 per cent is left unaffected because they are able to shelter income from taxes.
D) lowest 20 per cent increases, and the income received by the highest 20 per cent decreases.
E) lowest 20 per cent of households is almost unchanged because most don't work.
Unlock Deck
Unlock for access to all 53 flashcards in this deck.
Unlock Deck
k this deck
48
A regressive income tax is a tax for which the average tax rate
A) stays the same regardless of the income level.
B) first increases and then decreases as income increases.
C) increases as income increases.
D) becomes negative as income decreases.
E) decreases as income increases.
A) stays the same regardless of the income level.
B) first increases and then decreases as income increases.
C) increases as income increases.
D) becomes negative as income decreases.
E) decreases as income increases.
Unlock Deck
Unlock for access to all 53 flashcards in this deck.
Unlock Deck
k this deck
49
If you attended a public high school, you have received ________ because the government has provided ________.
A) the benefit of a negative tax; you with an education without having to pay taxes
B) a utilitarian benefit; an education to help promote equality
C) a subsidised service; a service at below the cost of its production
D) a subsidised service; you with a free education using a negative income tax
E) a grant; you with a free education
Unlock Deck
Unlock for access to all 53 flashcards in this deck.
Unlock Deck
k this deck
50
The table above shows three taxpayers, their incomes, and taxes owed. The data reflect a ________ income tax system because people pay ________.
A) proportional; the same proportion of their income as taxes regardless of their level of income.
B) regressive; a larger portion of their income as taxes as income increases
C) flat-rate; the same AMOUNT of taxes regardless of their income
D) progressive; a smaller portion of their income as taxes as income increases
E) negative; a smaller portion of their income as taxes as income increases
Unlock Deck
Unlock for access to all 53 flashcards in this deck.
Unlock Deck
k this deck
51
With a negative income tax that has a $10,000 guaranteed income and a 25 per cent tax rate, a household that has a market income of $14,000 has a total income of
A) $10,000.
B) $13,000.
C) $14,000.
D) $7,000.
E) $15,000.
A) $10,000.
B) $13,000.
C) $14,000.
D) $7,000.
E) $15,000.
Unlock Deck
Unlock for access to all 53 flashcards in this deck.
Unlock Deck
k this deck
52
A household's income earned from the markets for factors of production and with no government redistribution is
A) money income.
B) market income.
C) welfare.
D) exploitative income.
E) factored income.
A) money income.
B) market income.
C) welfare.
D) exploitative income.
E) factored income.
Unlock Deck
Unlock for access to all 53 flashcards in this deck.
Unlock Deck
k this deck
53
Unemployment benefits
A) redistribute income.
B) are distributed by individual states.
C) make the distribution of income less equal.
D) are paid only to the poorest households.
E) are funded by payroll taxes.
A) redistribute income.
B) are distributed by individual states.
C) make the distribution of income less equal.
D) are paid only to the poorest households.
E) are funded by payroll taxes.
Unlock Deck
Unlock for access to all 53 flashcards in this deck.
Unlock Deck
k this deck
Unlock Deck
Unlock for access to all 53 flashcards in this deck.


