Deck 25: Long-Run Economic Growth
Full screen (f)
Question
Consider the following table for a hypothetical economy in which the initial level of GDP (  )in all cases is 1000.Assume that real GDP grows according to the equation
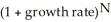 ,where N is the number of years in the future.Numbers are rounded to the nearest whole number. Real GDP with Alternative Growth Rates
  TABLE 25-1
Note: This question requires a calculator with an exponent function.
Refer to Table 25-1.If this economy is growing at an annual rate of 2%,then real GDP in Year 50 will be
A)1645.
B)1126.
C)2692.
D)500.
E)51 000.
)in all cases is 1000.Assume that real GDP grows according to the equation ,where N is the number of years in the future.Numbers are rounded to the nearest whole number. Real GDP with Alternative Growth Rates TABLE 25-1Note: This question requires a calculator with an exponent function.
Refer to Table 25-1.If this economy is growing at an annual rate of 2%,then real GDP in Year 50 will be
A)1645.
B)1126.
C)2692.
D)500.
E)51 000.
Question
Question
Question
The diagram below shows alternate paths for two hypothetical economies,each starting with GDP of $1 billion.Assume that Area 1 is equal to Area 2.  FIGURE 25-1 Refer to Figure 25-1.Which of the following statements best describes what we know about the difference between the two economies at Year 0?
A)Economy A has a higher level of real GDP at Year 0 than Economy B.
B)Economy B's households are consuming a larger percentage of GDP than Economy A's households.
C)There is no opportunity cost for economic growth for Economy B at Year 0.
D)There is no opportunity cost of economic growth for Economy A at Year 0.
E)Economy A's households are consuming a larger percentage of GDP than Economy B's households.
FIGURE 25-1 Refer to Figure 25-1.Which of the following statements best describes what we know about the difference between the two economies at Year 0?A)Economy A has a higher level of real GDP at Year 0 than Economy B.
B)Economy B's households are consuming a larger percentage of GDP than Economy A's households.
C)There is no opportunity cost for economic growth for Economy B at Year 0.
D)There is no opportunity cost of economic growth for Economy A at Year 0.
E)Economy A's households are consuming a larger percentage of GDP than Economy B's households.
Question
Question
Question
Question
The diagram below shows alternate paths for two hypothetical economies,each starting with GDP of $1 billion.Assume that Area 1 is equal to Area 2.  FIGURE 25-1 Refer to Figure 25-1.Which of the following statements about Economies A and B is correct?
A)Economy A will sustain higher material living standards than Economy B in the long run.
B)Economies A and B will have equal material living standards beginning at Year 0.
C)Economy B will sustain higher material living standards than Economy A in the long run.
D)Economies A and B will have equal material living standards beginning at Year X.
E)Economies A and B will have equal material living standards beginning at Year Y.
FIGURE 25-1 Refer to Figure 25-1.Which of the following statements about Economies A and B is correct?A)Economy A will sustain higher material living standards than Economy B in the long run.
B)Economies A and B will have equal material living standards beginning at Year 0.
C)Economy B will sustain higher material living standards than Economy A in the long run.
D)Economies A and B will have equal material living standards beginning at Year X.
E)Economies A and B will have equal material living standards beginning at Year Y.
Question
The diagram below shows alternate paths for two hypothetical economies,each starting with GDP of $1 billion.Assume that Area 1 is equal to Area 2.  FIGURE 25-1 Refer to Figure 25-1.The area marked Area 1 represents
A)the value of consumption from Year 0 to Year X in Economy A.
B)the value of the investment in capital goods undertaken by Economy B.
C)the value of the investment in capital goods undertaken by Economy A.
D)the sacrifice of current consumption by Economy B,as compared to Economy A.
E)the sacrifice of current consumption by Economy A,as compared to Economy B.
FIGURE 25-1 Refer to Figure 25-1.The area marked Area 1 representsA)the value of consumption from Year 0 to Year X in Economy A.
B)the value of the investment in capital goods undertaken by Economy B.
C)the value of the investment in capital goods undertaken by Economy A.
D)the sacrifice of current consumption by Economy B,as compared to Economy A.
E)the sacrifice of current consumption by Economy A,as compared to Economy B.
Question
Question
Consider the following table for a hypothetical economy in which the initial level of GDP (  )in all cases is 1000.Assume that real GDP grows according to the equation
 ,where N is the number of years in the future.Numbers are rounded to the nearest whole number. Real GDP with Alternative Growth Rates
  TABLE 25-1
Note: This question requires a calculator with an exponent function.
Refer to Table 25-1.If this economy is growing at an annual rate of 4%,then real GDP in Year 50 will be
A)2000.
B)1268.
C)2255.
D)7107.
E)51 000.
)in all cases is 1000.Assume that real GDP grows according to the equation ,where N is the number of years in the future.Numbers are rounded to the nearest whole number. Real GDP with Alternative Growth Rates TABLE 25-1Note: This question requires a calculator with an exponent function.
Refer to Table 25-1.If this economy is growing at an annual rate of 4%,then real GDP in Year 50 will be
A)2000.
B)1268.
C)2255.
D)7107.
E)51 000.
Question
Question
Question
Question
Question
Question
Question
Consider the following table for a hypothetical economy in which the initial level of GDP (  )in all cases is 1000.Assume that real GDP grows according to the equation
 ,where N is the number of years in the future.Numbers are rounded to the nearest whole number. Real GDP with Alternative Growth Rates
 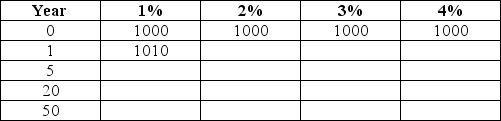 TABLE 25-1
Note: This question requires a calculator with an exponent function.
Refer to Table 25-1.What is real GDP in this economy in Year 20 if the annual growth rate is 4%?
A)2191
B)8000
C)20 800
D)80 000
E)836 683
)in all cases is 1000.Assume that real GDP grows according to the equation ,where N is the number of years in the future.Numbers are rounded to the nearest whole number. Real GDP with Alternative Growth Rates TABLE 25-1Note: This question requires a calculator with an exponent function.
Refer to Table 25-1.What is real GDP in this economy in Year 20 if the annual growth rate is 4%?
A)2191
B)8000
C)20 800
D)80 000
E)836 683
Question
Consider the following table for a hypothetical economy in which the initial level of GDP (  )in all cases is 1000.Assume that real GDP grows according to the equation
 ,where N is the number of years in the future.Numbers are rounded to the nearest whole number. Real GDP with Alternative Growth Rates
  TABLE 25-1
Note: This question requires a calculator with an exponent feature.
Refer to Table 25-1.What is real GDP in this economy in Year 20 if the annual growth rate is 1%?
A)200
B)1020
C)1220
D)6727
E)20 200
)in all cases is 1000.Assume that real GDP grows according to the equation ,where N is the number of years in the future.Numbers are rounded to the nearest whole number. Real GDP with Alternative Growth Rates TABLE 25-1Note: This question requires a calculator with an exponent feature.
Refer to Table 25-1.What is real GDP in this economy in Year 20 if the annual growth rate is 1%?
A)200
B)1020
C)1220
D)6727
E)20 200
Question
Question
Question
Question
Question
Question
The diagram below shows alternate paths for two hypothetical economies,each starting with GDP of $1 billion.Assume that Area 1 is equal to Area 2. 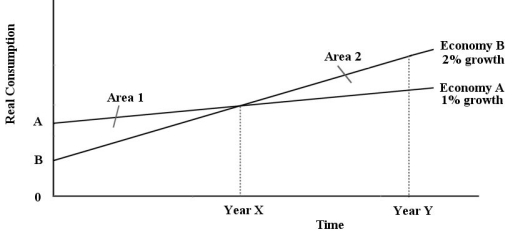 FIGURE 25-1 Refer to Figure 25-1.Which of the following costs of economic growth are reflected in this diagram?
A)the sacrifice of current consumption
B)lower real interest rate
C)environmental degradation
D)resource exhaustion
E)national saving
FIGURE 25-1 Refer to Figure 25-1.Which of the following costs of economic growth are reflected in this diagram?A)the sacrifice of current consumption
B)lower real interest rate
C)environmental degradation
D)resource exhaustion
E)national saving
Question
Question
Question
The table below shows aggregate values for a hypothetical economy.Suppose this economy has real GDP equal to potential output.  TABLE 25-2 Refer to Table 25-2.What is the level of public saving for this economy?
A)-$200
B)-$150
C)-$50
D)$150
E)$200
TABLE 25-2 Refer to Table 25-2.What is the level of public saving for this economy?A)-$200
B)-$150
C)-$50
D)$150
E)$200
Question
Question
Question
Question
Question
The table below shows aggregate values for a hypothetical economy.Suppose this economy has real GDP equal to potential output.  TABLE 25-2 Refer to Table 25-2.What is the level of national saving for this economy?
A)-$200
B)-$150
C)-$50
D)$150
E)$250
TABLE 25-2 Refer to Table 25-2.What is the level of national saving for this economy?A)-$200
B)-$150
C)-$50
D)$150
E)$250
Question
Question
The diagram below shows alternate paths for two hypothetical economies,each starting with GDP of $1 billion.Assume that Area 1 is equal to Area 2.  FIGURE 25-1 Refer to Figure 25-1.Suppose Economy A jumps to the path of Economy B at Year 0 by increasing the share of GDP that is saved.In that case,which of the following statements about Economy A is true?
A)Economy A will not be able to regain the losses in consumption it incurs by jumping to the path of Economy B.
B)By Year Y,the increase in consumption made possible by the economy's higher growth rate approximately equals the consumption sacrificed in earlier years.
C)By Year X,Economy A is better off in terms of material living standards for having jumped to the path of Economy B.
D)By jumping to a new growth path at Year 0,Economy A has increased the share of national income that is consumed.
E)By Year X,Economy A is saving and investing the same share of its national income as it would have been had it stayed on its original path.
FIGURE 25-1 Refer to Figure 25-1.Suppose Economy A jumps to the path of Economy B at Year 0 by increasing the share of GDP that is saved.In that case,which of the following statements about Economy A is true?A)Economy A will not be able to regain the losses in consumption it incurs by jumping to the path of Economy B.
B)By Year Y,the increase in consumption made possible by the economy's higher growth rate approximately equals the consumption sacrificed in earlier years.
C)By Year X,Economy A is better off in terms of material living standards for having jumped to the path of Economy B.
D)By jumping to a new growth path at Year 0,Economy A has increased the share of national income that is consumed.
E)By Year X,Economy A is saving and investing the same share of its national income as it would have been had it stayed on its original path.
Question
The table below shows aggregate values for a hypothetical economy.Suppose this economy has real GDP equal to potential output.  TABLE 25-2 Refer to Table 25-2.What is the level of private saving for this economy?
A)$50
B)$100
C)$150
D)$400
E)$450
TABLE 25-2 Refer to Table 25-2.What is the level of private saving for this economy?A)$50
B)$100
C)$150
D)$400
E)$450
Question
Question
Question
Question
Question
Question
Question
The table below shows aggregate values for a hypothetical economy.Suppose this economy has real GDP equal to potential output.  TABLE 25-3 Refer to Table 25-3.What is the level of national saving for this economy?
A)$50
B)$100
C)$200
D)$250
E)$300
TABLE 25-3 Refer to Table 25-3.What is the level of national saving for this economy?A)$50
B)$100
C)$200
D)$250
E)$300
Question
The table below shows aggregate values for a hypothetical economy.Suppose this economy has real GDP equal to potential output. 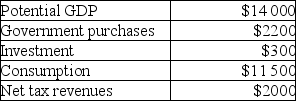 TABLE 25-3 Refer to Table 25-3.What is the level of public saving for this economy?
A)-$200
B)-$100
C)$200
D)$300
E)$500
TABLE 25-3 Refer to Table 25-3.What is the level of public saving for this economy?A)-$200
B)-$100
C)$200
D)$300
E)$500
Question
Question
Question
Question
The table below shows aggregate values for a hypothetical economy.Suppose this economy has real GDP equal to potential output.  TABLE 25-3 Refer to Table 25-3.What is the level of combined budget surpluses of all levels of government in this economy?
A)$50
B)$100
C)$500
D)-$200
E)-$500
TABLE 25-3 Refer to Table 25-3.What is the level of combined budget surpluses of all levels of government in this economy?A)$50
B)$100
C)$500
D)-$200
E)-$500
Question
The diagram below show the market for financial capital assuming that national income is constant at potential GDP,Y*. 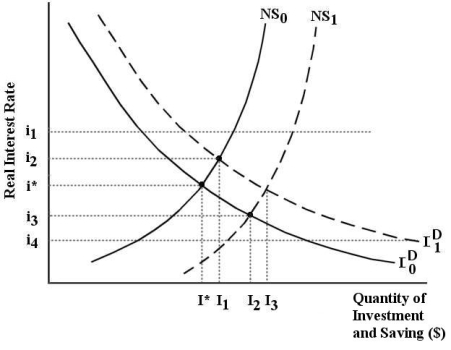 FIGURE 25-2 Refer to Figure 25-2.Suppose national saving is reflected by NS0 and investment demand is reflected by I0D.If the real interest rate is i4,there is ________,which will drive the real interest rate up to i*.
A)an excess demand for financial capital
B)an excess supply of financial capital
C)an excess supply of saving
D)an excess demand for public saving
FIGURE 25-2 Refer to Figure 25-2.Suppose national saving is reflected by NS0 and investment demand is reflected by I0D.If the real interest rate is i4,there is ________,which will drive the real interest rate up to i*.A)an excess demand for financial capital
B)an excess supply of financial capital
C)an excess supply of saving
D)an excess demand for public saving
Question
Question
Question
The diagram below show the market for financial capital assuming that national income is constant at potential GDP,Y*.  FIGURE 25-2 Refer to Figure 25-2.Suppose national saving is reflected by NS0 and investment demand is reflected by I0D.If the real interest rate is i1,there is ________ which will drive the interest rate down until it reaches i*.
A)an excess demand for financial capital
B)an excess demand for investment
C)an excess supply of financial capital
D)an excess supply of public saving
FIGURE 25-2 Refer to Figure 25-2.Suppose national saving is reflected by NS0 and investment demand is reflected by I0D.If the real interest rate is i1,there is ________ which will drive the interest rate down until it reaches i*.A)an excess demand for financial capital
B)an excess demand for investment
C)an excess supply of financial capital
D)an excess supply of public saving
Question
Question
The table below shows aggregate values for a hypothetical economy.Suppose this economy has real GDP equal to potential output.  TABLE 25-3 Refer to Table 25-3.What is the level of private saving for this economy?
A)$50
B)$100
C)$500
D)$2000
E)$3000
TABLE 25-3 Refer to Table 25-3.What is the level of private saving for this economy?A)$50
B)$100
C)$500
D)$2000
E)$3000
Question
Question
Question
Question
Question
Question
Question
Question
Question
The diagram below show the market for financial capital assuming that national income is constant at potential GDP,Y*.  FIGURE 25-2 Refer to Figure 25-2.Suppose national saving is reflected by NS0 and investment demand is reflected by I0D.Now suppose the government implements a revenue-neutral tax policy that encourages investment.What is the effect on the real interest rate?
A)There is no effect on NS or ID,and the interest rate remains at i*.
B)National saving shifts to NS1,and the real interest rate falls to i3.
C)The real interest rate rises because of the decrease in the budget surplus.
D)The real interest rate falls because of the decrease in the budget surplus.
E)Investment demand shifts to I1D,and the real interest rate rises to i2.
FIGURE 25-2 Refer to Figure 25-2.Suppose national saving is reflected by NS0 and investment demand is reflected by I0D.Now suppose the government implements a revenue-neutral tax policy that encourages investment.What is the effect on the real interest rate?A)There is no effect on NS or ID,and the interest rate remains at i*.
B)National saving shifts to NS1,and the real interest rate falls to i3.
C)The real interest rate rises because of the decrease in the budget surplus.
D)The real interest rate falls because of the decrease in the budget surplus.
E)Investment demand shifts to I1D,and the real interest rate rises to i2.
Question
Question
Question
The diagram below show the market for financial capital assuming that national income is constant at potential GDP,Y*.  FIGURE 25-2 Refer to Figure 25-2.Suppose national saving is reflected by NS0 and investment demand is reflected by I0D.Now suppose there is a reduction in government purchases.What is the effect on investment demand?
A)National saving shifts to NS1,causing an increase in the quantity of investment demanded from I* to I2.
B)There is no effect on NS or ID,and the quantity of investment demanded remains at I*.
C)Investment demand shifts to I1D,causing an increase in the quantity of investment demanded from I* to I1.
D)Investment demand shifts to I1D, causing an increase in the quantity of investment demanded from I* to I3.
E)National saving shifts to NS1,and investment demand shifts to I1D,causing an increase in the quantity of investment demanded from I* to I3.
FIGURE 25-2 Refer to Figure 25-2.Suppose national saving is reflected by NS0 and investment demand is reflected by I0D.Now suppose there is a reduction in government purchases.What is the effect on investment demand?A)National saving shifts to NS1,causing an increase in the quantity of investment demanded from I* to I2.
B)There is no effect on NS or ID,and the quantity of investment demanded remains at I*.
C)Investment demand shifts to I1D,causing an increase in the quantity of investment demanded from I* to I1.
D)Investment demand shifts to I1D, causing an increase in the quantity of investment demanded from I* to I3.
E)National saving shifts to NS1,and investment demand shifts to I1D,causing an increase in the quantity of investment demanded from I* to I3.
Question
Question
Question
Question
Question
The diagram below show the market for financial capital assuming that national income is constant at potential GDP,Y*.  FIGURE 25-2 Refer to Figure 25-2.Suppose national saving is reflected by NS0 and investment demand is reflected by I0D.Now suppose there is a reduction in government purchases (G).What is likely to happen in this market for financial capital?
A)There is no effect on NS or ID,and the interest rate remains at i*.
B)National saving shifts to NS1 and the interest rate falls to i3.
C)Investment demand shifts to I1D,and the interest rate rises to i2.
D)The real interest rate rises because of the decrease in the budget surplus.
E)The real interest rate falls because of the decrease in the budget surplus.
FIGURE 25-2 Refer to Figure 25-2.Suppose national saving is reflected by NS0 and investment demand is reflected by I0D.Now suppose there is a reduction in government purchases (G).What is likely to happen in this market for financial capital?A)There is no effect on NS or ID,and the interest rate remains at i*.
B)National saving shifts to NS1 and the interest rate falls to i3.
C)Investment demand shifts to I1D,and the interest rate rises to i2.
D)The real interest rate rises because of the decrease in the budget surplus.
E)The real interest rate falls because of the decrease in the budget surplus.
Question
Question
Question
The diagram below shows the market for financial capital in the long run when real GDP is equal to potential output,Y*.  FIGURE 25-3 Refer to Figure 25-3.The equilibrium interest rate in this market is ________% and the equilibrium flow of investment and saving is ________ billion dollars.
A)1; 50
B)2; 60
C)3; 70
D)4; 80
E)5; 90
FIGURE 25-3 Refer to Figure 25-3.The equilibrium interest rate in this market is ________% and the equilibrium flow of investment and saving is ________ billion dollars.A)1; 50
B)2; 60
C)3; 70
D)4; 80
E)5; 90
Question
The diagram below show the market for financial capital assuming that national income is constant at potential GDP,Y*.  FIGURE 25-2 Refer to Figure 25-2.Suppose national saving is reflected by NS0 and investment demand is reflected by I0D.Now suppose the government implements a revenue-neutral tax policy that encourages investment.What is the effect on the quantity of national saving?
A)There is no effect on NS or ID and the quantity of national saving supplied remains at I*.
B)National saving shifts to NS1,and the quantity of national saving supplied rises to I2.
C)Investment demand shifts to I1D and the quantity of national saving supplied rises to I1.
D)Investment demand shifts to I1D,national saving shifts to NS1,and the quantity of national saving rises to I3.
E)National saving shifts to NS1,investment demand shifts to I1D,and the quantity of national saving rises to I1.
FIGURE 25-2 Refer to Figure 25-2.Suppose national saving is reflected by NS0 and investment demand is reflected by I0D.Now suppose the government implements a revenue-neutral tax policy that encourages investment.What is the effect on the quantity of national saving?A)There is no effect on NS or ID and the quantity of national saving supplied remains at I*.
B)National saving shifts to NS1,and the quantity of national saving supplied rises to I2.
C)Investment demand shifts to I1D and the quantity of national saving supplied rises to I1.
D)Investment demand shifts to I1D,national saving shifts to NS1,and the quantity of national saving rises to I3.
E)National saving shifts to NS1,investment demand shifts to I1D,and the quantity of national saving rises to I1.
Question
The diagram below shows the market for financial capital in the long run when real GDP is equal to potential output,Y*.  FIGURE 25-3 Refer to Figure 25-3.Suppose the interest rate in this market for financial capital is 4%.In this case there is an excess ________ financial capital of ________ billion dollars.
A)supply of; 30
B)demand for; -60
C)supply of; 90
D)demand for; 30
E)demand for; 60
FIGURE 25-3 Refer to Figure 25-3.Suppose the interest rate in this market for financial capital is 4%.In this case there is an excess ________ financial capital of ________ billion dollars.A)supply of; 30
B)demand for; -60
C)supply of; 90
D)demand for; 30
E)demand for; 60
Question
Question
The diagram below shows the market for financial capital in the long run when real GDP is equal to potential output,Y*. 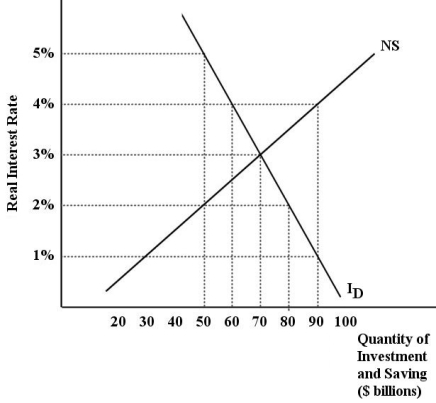 FIGURE 25-3 Refer to Figure 25-3.Suppose the interest rate in this market for financial capital is 2%.In this case there is an excess ________ financial capital of ________ billion dollars.
A)supply of; 30
B)demand for; -30
C)supply of; 50
D)demand for; 30
E)demand for; 80
FIGURE 25-3 Refer to Figure 25-3.Suppose the interest rate in this market for financial capital is 2%.In this case there is an excess ________ financial capital of ________ billion dollars.A)supply of; 30
B)demand for; -30
C)supply of; 50
D)demand for; 30
E)demand for; 80
Question
Question
The diagram below shows the market for financial capital in the long run when real GDP is equal to potential output,Y*.  FIGURE 25-3 Refer to Figure 25-3.Suppose the interest rate in this market for financial capital is 2%.Which of the following statements correctly describes the adjustment that will occur in this market?
A)The excess supply of saving will push up the real interest rate,which will decrease the quantity demanded of investment and increase the quantity supplied of saving.
B)The excess demand for investment will push up the real interest rate,which will decrease the quantity demanded of investment and increase the quantity supplied of saving.
C)The excess supply of saving will push down the real interest rate,which will decrease the quantity demanded of investment and increase the quantity supplied of saving.
D)The excess demand for investment will push down the real interest rate,which will decrease the quantity demanded of investment and increase the quantity supplied of saving.
E)The excess demand for investment will push up the real interest rate,which will increase the quantity demanded of investment and decrease the quantity supplied of saving.
FIGURE 25-3 Refer to Figure 25-3.Suppose the interest rate in this market for financial capital is 2%.Which of the following statements correctly describes the adjustment that will occur in this market?A)The excess supply of saving will push up the real interest rate,which will decrease the quantity demanded of investment and increase the quantity supplied of saving.
B)The excess demand for investment will push up the real interest rate,which will decrease the quantity demanded of investment and increase the quantity supplied of saving.
C)The excess supply of saving will push down the real interest rate,which will decrease the quantity demanded of investment and increase the quantity supplied of saving.
D)The excess demand for investment will push down the real interest rate,which will decrease the quantity demanded of investment and increase the quantity supplied of saving.
E)The excess demand for investment will push up the real interest rate,which will increase the quantity demanded of investment and decrease the quantity supplied of saving.

Unlock Deck
Sign up to unlock the cards in this deck!
Unlock Deck
Unlock Deck
1/130
Play
Full screen (f)
Deck 25: Long-Run Economic Growth
1
Consider the following table for a hypothetical economy in which the initial level of GDP ( )in all cases is 1000.Assume that real GDP grows according to the equation ,where N is the number of years in the future.Numbers are rounded to the nearest whole number. Real GDP with Alternative Growth Rates TABLE 25-1
Note: This question requires a calculator with an exponent function.
Refer to Table 25-1.If this economy is growing at an annual rate of 2%,then real GDP in Year 50 will be
A)1645.
B)1126.
C)2692.
D)500.
E)51 000.
)in all cases is 1000.Assume that real GDP grows according to the equation ,where N is the number of years in the future.Numbers are rounded to the nearest whole number. Real GDP with Alternative Growth Rates TABLE 25-1Note: This question requires a calculator with an exponent function.
Refer to Table 25-1.If this economy is growing at an annual rate of 2%,then real GDP in Year 50 will be
A)1645.
B)1126.
C)2692.
D)500.
E)51 000.
2692.
2
Over a long period of time,perhaps many years,changes in real GDP come primarily from
A)upward shifts of the AS curve.
B)upward shifts of the AE curve.
C)rightward shifts of the AD curve.
D)continuous increases in potential GDP.
E)leftward shifts of the AD curve.
A)upward shifts of the AS curve.
B)upward shifts of the AE curve.
C)rightward shifts of the AD curve.
D)continuous increases in potential GDP.
E)leftward shifts of the AD curve.
continuous increases in potential GDP.
3
Of the variables listed below,the best measure of a nation's average material standard of living is
A)nominal GDP.
B)percent change in nominal GDP.
C)per capita real GDP.
D)per capita nominal GDP.
E)real GDP.
A)nominal GDP.
B)percent change in nominal GDP.
C)per capita real GDP.
D)per capita nominal GDP.
E)real GDP.
per capita real GDP.
4
The diagram below shows alternate paths for two hypothetical economies,each starting with GDP of $1 billion.Assume that Area 1 is equal to Area 2. FIGURE 25-1 Refer to Figure 25-1.Which of the following statements best describes what we know about the difference between the two economies at Year 0?
A)Economy A has a higher level of real GDP at Year 0 than Economy B.
B)Economy B's households are consuming a larger percentage of GDP than Economy A's households.
C)There is no opportunity cost for economic growth for Economy B at Year 0.
D)There is no opportunity cost of economic growth for Economy A at Year 0.
E)Economy A's households are consuming a larger percentage of GDP than Economy B's households.
FIGURE 25-1 Refer to Figure 25-1.Which of the following statements best describes what we know about the difference between the two economies at Year 0?A)Economy A has a higher level of real GDP at Year 0 than Economy B.
B)Economy B's households are consuming a larger percentage of GDP than Economy A's households.
C)There is no opportunity cost for economic growth for Economy B at Year 0.
D)There is no opportunity cost of economic growth for Economy A at Year 0.
E)Economy A's households are consuming a larger percentage of GDP than Economy B's households.
Unlock Deck
Unlock for access to all 130 flashcards in this deck.
Unlock Deck
k this deck
5
Suppose per capita GDP in a richer country is growing at a faster annual rate than in a poorer country.An implication of this difference in growth rates is that
A)the gap between their standards of living will close over time as long as the rate of population growth is higher in the poorer country.
B)the gap between their standards of living will close over time.
C)the difference in their living standards will not change over time.
D)the gap between their standards of living will widen over time.
E)whether the gap in living standards widens or closes over time depends on the absolute size of the relative growth rates.
Unlock Deck
Unlock for access to all 130 flashcards in this deck.
Unlock Deck
k this deck
6
Which of the following is implied by the compounding of economic growth rates?
A)A large increase in investment today has little effect on national income over the long run.
B)Small changes in sustained growth rates can have a significant impact on national income over several decades.
C)Consumers should not save,given the low real returns that compounding produces.
D)A 10% annual rate of return will double an investment in less than 6 years.
E)A 2% annual growth rate of GDP will double national income in 27 years.
Unlock Deck
Unlock for access to all 130 flashcards in this deck.
Unlock Deck
k this deck
7
If real income grows at approximately 4% per year,the number of years it will take for real income to double is approximately
A)5.
B)12.
C)18.
D)36.
E)72.
A)5.
B)12.
C)18.
D)36.
E)72.
Unlock Deck
Unlock for access to all 130 flashcards in this deck.
Unlock Deck
k this deck
8
The diagram below shows alternate paths for two hypothetical economies,each starting with GDP of $1 billion.Assume that Area 1 is equal to Area 2. FIGURE 25-1 Refer to Figure 25-1.Which of the following statements about Economies A and B is correct?
A)Economy A will sustain higher material living standards than Economy B in the long run.
B)Economies A and B will have equal material living standards beginning at Year 0.
C)Economy B will sustain higher material living standards than Economy A in the long run.
D)Economies A and B will have equal material living standards beginning at Year X.
E)Economies A and B will have equal material living standards beginning at Year Y.
FIGURE 25-1 Refer to Figure 25-1.Which of the following statements about Economies A and B is correct?A)Economy A will sustain higher material living standards than Economy B in the long run.
B)Economies A and B will have equal material living standards beginning at Year 0.
C)Economy B will sustain higher material living standards than Economy A in the long run.
D)Economies A and B will have equal material living standards beginning at Year X.
E)Economies A and B will have equal material living standards beginning at Year Y.
Unlock Deck
Unlock for access to all 130 flashcards in this deck.
Unlock Deck
k this deck
9
The diagram below shows alternate paths for two hypothetical economies,each starting with GDP of $1 billion.Assume that Area 1 is equal to Area 2. FIGURE 25-1 Refer to Figure 25-1.The area marked Area 1 represents
A)the value of consumption from Year 0 to Year X in Economy A.
B)the value of the investment in capital goods undertaken by Economy B.
C)the value of the investment in capital goods undertaken by Economy A.
D)the sacrifice of current consumption by Economy B,as compared to Economy A.
E)the sacrifice of current consumption by Economy A,as compared to Economy B.
FIGURE 25-1 Refer to Figure 25-1.The area marked Area 1 representsA)the value of consumption from Year 0 to Year X in Economy A.
B)the value of the investment in capital goods undertaken by Economy B.
C)the value of the investment in capital goods undertaken by Economy A.
D)the sacrifice of current consumption by Economy B,as compared to Economy A.
E)the sacrifice of current consumption by Economy A,as compared to Economy B.
Unlock Deck
Unlock for access to all 130 flashcards in this deck.
Unlock Deck
k this deck
10
If real income grows at approximately 2% per year,the number of years it will take for real income to double is approximately
A)5.
B)12.
C)24.
D)36.
E)72.
A)5.
B)12.
C)24.
D)36.
E)72.
Unlock Deck
Unlock for access to all 130 flashcards in this deck.
Unlock Deck
k this deck
11
Consider the following table for a hypothetical economy in which the initial level of GDP ( )in all cases is 1000.Assume that real GDP grows according to the equation ,where N is the number of years in the future.Numbers are rounded to the nearest whole number. Real GDP with Alternative Growth Rates TABLE 25-1
Note: This question requires a calculator with an exponent function.
Refer to Table 25-1.If this economy is growing at an annual rate of 4%,then real GDP in Year 50 will be
A)2000.
B)1268.
C)2255.
D)7107.
E)51 000.
)in all cases is 1000.Assume that real GDP grows according to the equation ,where N is the number of years in the future.Numbers are rounded to the nearest whole number. Real GDP with Alternative Growth Rates TABLE 25-1Note: This question requires a calculator with an exponent function.
Refer to Table 25-1.If this economy is growing at an annual rate of 4%,then real GDP in Year 50 will be
A)2000.
B)1268.
C)2255.
D)7107.
E)51 000.
Unlock Deck
Unlock for access to all 130 flashcards in this deck.
Unlock Deck
k this deck
12
Between the years 1960 and 2017,the Canadian economy experienced growth in real GDP at an average annual rate of ________%.
A)0.7
B)1.2
C)1.9
D)3.3
E)6.3
A)0.7
B)1.2
C)1.9
D)3.3
E)6.3
Unlock Deck
Unlock for access to all 130 flashcards in this deck.
Unlock Deck
k this deck
13
Suppose GDP in a richer country is growing at the same annual rate as in a poorer country.An implication of these growth rates is that the
A)gap between their standards of living will widen over time.
B)gap between their standards of living will close over time.
C)gap between their standards of living will close over time as long as the rate of population growth is lower in the poorer country.
D)gap between their standards of living will close over time as long as the rate of population growth is lower in the richer country.
E)difference in their living standards will not change over time.
Unlock Deck
Unlock for access to all 130 flashcards in this deck.
Unlock Deck
k this deck
14
Which of the following is a common measure of a country's rate of economic growth?
A)the marginal efficiency of capital
B)the capital-output ratio
C)the level of output per capita
D)the change in output per capita
E)the level of real gross domestic product
A)the marginal efficiency of capital
B)the capital-output ratio
C)the level of output per capita
D)the change in output per capita
E)the level of real gross domestic product
Unlock Deck
Unlock for access to all 130 flashcards in this deck.
Unlock Deck
k this deck
15
Over the long term,by far the most potent force for raising average material living standards is
A)economic growth.
B)reducing inefficiencies.
C)redistributing income.
D)increasing the money supply.
E)appropriate fiscal policies.
A)economic growth.
B)reducing inefficiencies.
C)redistributing income.
D)increasing the money supply.
E)appropriate fiscal policies.
Unlock Deck
Unlock for access to all 130 flashcards in this deck.
Unlock Deck
k this deck
16
In the long run,changes in average material living standards are best shown by
A)growth in real GDP.
B)population growth.
C)growth in real per capita GDP.
D)improvements in fiscal policy.
E)improvements in monetary policy.
A)growth in real GDP.
B)population growth.
C)growth in real per capita GDP.
D)improvements in fiscal policy.
E)improvements in monetary policy.
Unlock Deck
Unlock for access to all 130 flashcards in this deck.
Unlock Deck
k this deck
17
Which of the following is a common measure of a country's level of productivity?
A)the average efficiency of capital
B)the capital-output ratio
C)output per capita
D)output per unit of labour input
E)per capita GDP
A)the average efficiency of capital
B)the capital-output ratio
C)output per capita
D)output per unit of labour input
E)per capita GDP
Unlock Deck
Unlock for access to all 130 flashcards in this deck.
Unlock Deck
k this deck
18
Consider the following table for a hypothetical economy in which the initial level of GDP ( )in all cases is 1000.Assume that real GDP grows according to the equation ,where N is the number of years in the future.Numbers are rounded to the nearest whole number. Real GDP with Alternative Growth Rates TABLE 25-1
Note: This question requires a calculator with an exponent function.
Refer to Table 25-1.What is real GDP in this economy in Year 20 if the annual growth rate is 4%?
A)2191
B)8000
C)20 800
D)80 000
E)836 683
)in all cases is 1000.Assume that real GDP grows according to the equation ,where N is the number of years in the future.Numbers are rounded to the nearest whole number. Real GDP with Alternative Growth Rates TABLE 25-1Note: This question requires a calculator with an exponent function.
Refer to Table 25-1.What is real GDP in this economy in Year 20 if the annual growth rate is 4%?
A)2191
B)8000
C)20 800
D)80 000
E)836 683
Unlock Deck
Unlock for access to all 130 flashcards in this deck.
Unlock Deck
k this deck
19
Consider the following table for a hypothetical economy in which the initial level of GDP ( )in all cases is 1000.Assume that real GDP grows according to the equation ,where N is the number of years in the future.Numbers are rounded to the nearest whole number. Real GDP with Alternative Growth Rates TABLE 25-1
Note: This question requires a calculator with an exponent feature.
Refer to Table 25-1.What is real GDP in this economy in Year 20 if the annual growth rate is 1%?
A)200
B)1020
C)1220
D)6727
E)20 200
)in all cases is 1000.Assume that real GDP grows according to the equation ,where N is the number of years in the future.Numbers are rounded to the nearest whole number. Real GDP with Alternative Growth Rates TABLE 25-1Note: This question requires a calculator with an exponent feature.
Refer to Table 25-1.What is real GDP in this economy in Year 20 if the annual growth rate is 1%?
A)200
B)1020
C)1220
D)6727
E)20 200
Unlock Deck
Unlock for access to all 130 flashcards in this deck.
Unlock Deck
k this deck
20
The theory of economic growth concentrates on the ________ over the long run,not on ________.
A)growth of investment in capital goods; short-run fluctuations of investment
B)growth of real GDP; growth of potential GDP
C)factor utilization rates; growth of the supplies of factors
D)factor utilization rates; growth of real GDP
E)growth of potential output; fluctuations of output around potential
Unlock Deck
Unlock for access to all 130 flashcards in this deck.
Unlock Deck
k this deck
21
Which of the following is a benefit of long-run economic growth?
A)growth in nominal GDP greater than real GDP
B)decreased productive capacity
C)a greater ability to reduce inequality
D)increased future interest rates
E)decreased current saving and increased current consumption
A)growth in nominal GDP greater than real GDP
B)decreased productive capacity
C)a greater ability to reduce inequality
D)increased future interest rates
E)decreased current saving and increased current consumption
Unlock Deck
Unlock for access to all 130 flashcards in this deck.
Unlock Deck
k this deck
22
Consider a closed economy with real GDP in the long run of $400,consumption expenditures of $250,government purchases of $75,and net tax revenue of $20.What is the level of national saving?
A)$55
B)$75
C)$95
D)$225
E)$230
A)$55
B)$75
C)$95
D)$225
E)$230
Unlock Deck
Unlock for access to all 130 flashcards in this deck.
Unlock Deck
k this deck
23
Economic growth is often associated with structural change in the economy,and this change can present difficult policy challenges to governments.Which of the following government policies would be most useful at addressing the social costs of economic growth?
A)expansionary monetary policy
B)the imposition of trade restrictions to protect Canadian jobs
C)subsidies directed at Canadian manufacturing firms
D)worker re-training and education programs
E)reducing income taxes
A)expansionary monetary policy
B)the imposition of trade restrictions to protect Canadian jobs
C)subsidies directed at Canadian manufacturing firms
D)worker re-training and education programs
E)reducing income taxes
Unlock Deck
Unlock for access to all 130 flashcards in this deck.
Unlock Deck
k this deck
24
The four major determinants of economic growth include all of the following EXCEPT
A)technological improvement.
B)growth in physical capital.
C)growth in human capital.
D)growth in financial capital.
E)growth in the labour force.
A)technological improvement.
B)growth in physical capital.
C)growth in human capital.
D)growth in financial capital.
E)growth in the labour force.
Unlock Deck
Unlock for access to all 130 flashcards in this deck.
Unlock Deck
k this deck
25
The diagram below shows alternate paths for two hypothetical economies,each starting with GDP of $1 billion.Assume that Area 1 is equal to Area 2. FIGURE 25-1 Refer to Figure 25-1.Which of the following costs of economic growth are reflected in this diagram?
A)the sacrifice of current consumption
B)lower real interest rate
C)environmental degradation
D)resource exhaustion
E)national saving
FIGURE 25-1 Refer to Figure 25-1.Which of the following costs of economic growth are reflected in this diagram?A)the sacrifice of current consumption
B)lower real interest rate
C)environmental degradation
D)resource exhaustion
E)national saving
Unlock Deck
Unlock for access to all 130 flashcards in this deck.
Unlock Deck
k this deck
26
What is the main reason that alleviation of poverty is more achievable in an economy that is growing?
A)Individuals are more likely to object to the redistribution of income when they earn more.
B)Everyone,including the poor,benefits equally from growth.
C)Poor individuals are relatively easier to be identified in a growing economy.
D)Nobody has to be made worse off when the increment to income caused by growth is redistributed.
E)Wage rates for low-income people are naturally rising.
Unlock Deck
Unlock for access to all 130 flashcards in this deck.
Unlock Deck
k this deck
27
Which of the following is a cost of economic growth?
A)declining future living standards
B)current saving must be sacrificed to increase investment in capital goods
C)improvements in technology
D)the effect on workers whose skills are made obsolete by technical change
E)reduced interest rates
A)declining future living standards
B)current saving must be sacrificed to increase investment in capital goods
C)improvements in technology
D)the effect on workers whose skills are made obsolete by technical change
E)reduced interest rates
Unlock Deck
Unlock for access to all 130 flashcards in this deck.
Unlock Deck
k this deck
28
The table below shows aggregate values for a hypothetical economy.Suppose this economy has real GDP equal to potential output. TABLE 25-2 Refer to Table 25-2.What is the level of public saving for this economy?
A)-$200
B)-$150
C)-$50
D)$150
E)$200
TABLE 25-2 Refer to Table 25-2.What is the level of public saving for this economy?A)-$200
B)-$150
C)-$50
D)$150
E)$200
Unlock Deck
Unlock for access to all 130 flashcards in this deck.
Unlock Deck
k this deck
29
Which of the following equations is a correct expression for national saving in the long run when real GDP equals potential output?
A)NS = Y* - C - G
B)NS = Y* - C + T - G
C)NS = Y* - T - C
D)NS = T - G
E)NS = T - G - C
A)NS = Y* - C - G
B)NS = Y* - C + T - G
C)NS = Y* - T - C
D)NS = T - G
E)NS = T - G - C
Unlock Deck
Unlock for access to all 130 flashcards in this deck.
Unlock Deck
k this deck
30
Long-run economic growth can help alleviate the problems of poverty by
A)creating new low-paying jobs for the unemployed.
B)generating more resources that can be used to reduce income inequality.
C)reallocating income away from low-value production to increase the incentives for high-value production.
D)requiring increased saving on the part of most of the population.
E)increasing future consumption for the middle class.
Unlock Deck
Unlock for access to all 130 flashcards in this deck.
Unlock Deck
k this deck
31
Consuming fewer goods today in order to invest resources in capital goods can be considered the ________ of economic growth.
A)opportunity cost
B)social cost
C)investment cost
D)external cost
E)total cost
A)opportunity cost
B)social cost
C)investment cost
D)external cost
E)total cost
Unlock Deck
Unlock for access to all 130 flashcards in this deck.
Unlock Deck
k this deck
32
Consider the long-run theory of investment,saving,and growth.In the long-run version of our macro model (with real GDP equal to Y*),the equilibrium interest rate is determined where
A)aggregate demand equals aggregate expenditure.
B)desired national saving equals desired investment.
C)the nominal price level equals the real price level.
D)desired consumption equals desired investment.
E)desired saving equals desired consumption.
A)aggregate demand equals aggregate expenditure.
B)desired national saving equals desired investment.
C)the nominal price level equals the real price level.
D)desired consumption equals desired investment.
E)desired saving equals desired consumption.
Unlock Deck
Unlock for access to all 130 flashcards in this deck.
Unlock Deck
k this deck
33
The table below shows aggregate values for a hypothetical economy.Suppose this economy has real GDP equal to potential output. TABLE 25-2 Refer to Table 25-2.What is the level of national saving for this economy?
A)-$200
B)-$150
C)-$50
D)$150
E)$250
TABLE 25-2 Refer to Table 25-2.What is the level of national saving for this economy?A)-$200
B)-$150
C)-$50
D)$150
E)$250
Unlock Deck
Unlock for access to all 130 flashcards in this deck.
Unlock Deck
k this deck
34
If government policies are to be successful in enhancing a country's long-run growth rate,they likely work through generating
A)higher levels of current consumption.
B)greater private investment in physical and human capital.
C)an increase in current consumption and a reduction in saving.
D)a leftward shift in the AS curve.
E)fiscal policies that shift the AD curve to the right.
A)higher levels of current consumption.
B)greater private investment in physical and human capital.
C)an increase in current consumption and a reduction in saving.
D)a leftward shift in the AS curve.
E)fiscal policies that shift the AD curve to the right.
Unlock Deck
Unlock for access to all 130 flashcards in this deck.
Unlock Deck
k this deck
35
The diagram below shows alternate paths for two hypothetical economies,each starting with GDP of $1 billion.Assume that Area 1 is equal to Area 2. FIGURE 25-1 Refer to Figure 25-1.Suppose Economy A jumps to the path of Economy B at Year 0 by increasing the share of GDP that is saved.In that case,which of the following statements about Economy A is true?
A)Economy A will not be able to regain the losses in consumption it incurs by jumping to the path of Economy B.
B)By Year Y,the increase in consumption made possible by the economy's higher growth rate approximately equals the consumption sacrificed in earlier years.
C)By Year X,Economy A is better off in terms of material living standards for having jumped to the path of Economy B.
D)By jumping to a new growth path at Year 0,Economy A has increased the share of national income that is consumed.
E)By Year X,Economy A is saving and investing the same share of its national income as it would have been had it stayed on its original path.
FIGURE 25-1 Refer to Figure 25-1.Suppose Economy A jumps to the path of Economy B at Year 0 by increasing the share of GDP that is saved.In that case,which of the following statements about Economy A is true?A)Economy A will not be able to regain the losses in consumption it incurs by jumping to the path of Economy B.
B)By Year Y,the increase in consumption made possible by the economy's higher growth rate approximately equals the consumption sacrificed in earlier years.
C)By Year X,Economy A is better off in terms of material living standards for having jumped to the path of Economy B.
D)By jumping to a new growth path at Year 0,Economy A has increased the share of national income that is consumed.
E)By Year X,Economy A is saving and investing the same share of its national income as it would have been had it stayed on its original path.
Unlock Deck
Unlock for access to all 130 flashcards in this deck.
Unlock Deck
k this deck
36
The table below shows aggregate values for a hypothetical economy.Suppose this economy has real GDP equal to potential output. TABLE 25-2 Refer to Table 25-2.What is the level of private saving for this economy?
A)$50
B)$100
C)$150
D)$400
E)$450
TABLE 25-2 Refer to Table 25-2.What is the level of private saving for this economy?A)$50
B)$100
C)$150
D)$400
E)$450
Unlock Deck
Unlock for access to all 130 flashcards in this deck.
Unlock Deck
k this deck
37
An important social cost of economic growth is
A)the increasing inequality of income that usually accompanies sustained growth.
B)the sacrifice of current consumption required for a higher level of future consumption.
C)the associated inflation.
D)the associated frictional unemployment.
E)the destruction of jobs due to labour skills of certain workers becoming obsolete.
Unlock Deck
Unlock for access to all 130 flashcards in this deck.
Unlock Deck
k this deck
38
For a given level of technology,a more rapid rate of economic growth can probably be achieved only if a country's citizens are prepared to
A)redistribute income.
B)sacrifice some present consumption.
C)increase their demand for goods and services.
D)increase exports.
E)decrease interest rates.
A)redistribute income.
B)sacrifice some present consumption.
C)increase their demand for goods and services.
D)increase exports.
E)decrease interest rates.
Unlock Deck
Unlock for access to all 130 flashcards in this deck.
Unlock Deck
k this deck
39
Suppose a country transfers resources from the production of consumption goods to the production of capital goods.The result of this shift will be to
A)raise future consumption.
B)raise current living standards.
C)decrease the long-run growth rate.
D)lower future living standards.
E)raise current consumption.
A)raise future consumption.
B)raise current living standards.
C)decrease the long-run growth rate.
D)lower future living standards.
E)raise current consumption.
Unlock Deck
Unlock for access to all 130 flashcards in this deck.
Unlock Deck
k this deck
40
Which of the following is the best example of the acquisition of human capital?
A)A worker takes a training course that increases his/her productivity.
B)A worker receives new machinery enabling him/her to do the amount of work that was formerly done by two workers.
C)A worker communicates more quickly and accurately with suppliers because of upgrades to communications software.
D)A government-sponsored program increases the amount of investment available per worker.
E)A computer chip manufacturer introduces a faster processor for micro-computing.
Unlock Deck
Unlock for access to all 130 flashcards in this deck.
Unlock Deck
k this deck
41
Consider the market for financial capital in the long run.The national saving curve is upward sloping because an increase in the real interest rate
A)leads households to increase their current consumption.
B)leads to an increase in investment demand.
C)decreases the supply of public saving.
D)leads households to reduce their current consumption.
E)decreases the supply of private saving.
A)leads households to increase their current consumption.
B)leads to an increase in investment demand.
C)decreases the supply of public saving.
D)leads households to reduce their current consumption.
E)decreases the supply of private saving.
Unlock Deck
Unlock for access to all 130 flashcards in this deck.
Unlock Deck
k this deck
42
Consider the market for financial capital in the long run.The investment demand curve is downward sloping because
A)an increase in the real interest rate leads to an increase in investment demand.
B)all components of desired investment are negatively related to the real interest rate.
C)all components of desired investment are positively related to the real interest rate.
D)a decrease in the real interest rate reflects a higher opportunity cost to firms of using financial capital.
E)an increase in the real interest rate reflects a lower opportunity cost to firms of using financial capital.
Unlock Deck
Unlock for access to all 130 flashcards in this deck.
Unlock Deck
k this deck
43
The table below shows aggregate values for a hypothetical economy.Suppose this economy has real GDP equal to potential output. TABLE 25-3 Refer to Table 25-3.What is the level of national saving for this economy?
A)$50
B)$100
C)$200
D)$250
E)$300
TABLE 25-3 Refer to Table 25-3.What is the level of national saving for this economy?A)$50
B)$100
C)$200
D)$250
E)$300
Unlock Deck
Unlock for access to all 130 flashcards in this deck.
Unlock Deck
k this deck
44
The table below shows aggregate values for a hypothetical economy.Suppose this economy has real GDP equal to potential output. TABLE 25-3 Refer to Table 25-3.What is the level of public saving for this economy?
A)-$200
B)-$100
C)$200
D)$300
E)$500
TABLE 25-3 Refer to Table 25-3.What is the level of public saving for this economy?A)-$200
B)-$100
C)$200
D)$300
E)$500
Unlock Deck
Unlock for access to all 130 flashcards in this deck.
Unlock Deck
k this deck
45
Consider the long-run theory of investment,saving,and growth.For a given level of national income,a decrease in private consumption or government purchases will cause the equilibrium interest rate to
A)increase and the flow of national saving to decrease.
B)increase and the flow of investment to increase.
C)increase and the flow of investment to decrease.
D)decrease and the flow of national saving to increase.
E)decrease and the flow of national saving to decrease.
A)increase and the flow of national saving to decrease.
B)increase and the flow of investment to increase.
C)increase and the flow of investment to decrease.
D)decrease and the flow of national saving to increase.
E)decrease and the flow of national saving to decrease.
Unlock Deck
Unlock for access to all 130 flashcards in this deck.
Unlock Deck
k this deck
46
Consider the long-run theory of investment,saving,and growth.For a given level of private saving,a decrease in the government's budget deficit ________ the long-run rate of economic growth.
A)will reduce
B)will leave unchanged
C)will increase
D)will diminish
E)none of the above
A)will reduce
B)will leave unchanged
C)will increase
D)will diminish
E)none of the above
Unlock Deck
Unlock for access to all 130 flashcards in this deck.
Unlock Deck
k this deck
47
Consider the long-run theory of investment,saving and growth.For a given level of national income,a decrease in private consumption or government purchases will cause the equilibrium interest rate to
A)increase and the flow of national saving to fall.
B)increase and the flow of investment to increase.
C)increase and the flow of investment to decrease.
D)decrease and the flow of investment to decrease.
E)decrease and the flow of investment to increase.
A)increase and the flow of national saving to fall.
B)increase and the flow of investment to increase.
C)increase and the flow of investment to decrease.
D)decrease and the flow of investment to decrease.
E)decrease and the flow of investment to increase.
Unlock Deck
Unlock for access to all 130 flashcards in this deck.
Unlock Deck
k this deck
48
The table below shows aggregate values for a hypothetical economy.Suppose this economy has real GDP equal to potential output. TABLE 25-3 Refer to Table 25-3.What is the level of combined budget surpluses of all levels of government in this economy?
A)$50
B)$100
C)$500
D)-$200
E)-$500
TABLE 25-3 Refer to Table 25-3.What is the level of combined budget surpluses of all levels of government in this economy?A)$50
B)$100
C)$500
D)-$200
E)-$500
Unlock Deck
Unlock for access to all 130 flashcards in this deck.
Unlock Deck
k this deck
49
The diagram below show the market for financial capital assuming that national income is constant at potential GDP,Y*. FIGURE 25-2 Refer to Figure 25-2.Suppose national saving is reflected by NS0 and investment demand is reflected by I0D.If the real interest rate is i4,there is ________,which will drive the real interest rate up to i*.
A)an excess demand for financial capital
B)an excess supply of financial capital
C)an excess supply of saving
D)an excess demand for public saving
FIGURE 25-2 Refer to Figure 25-2.Suppose national saving is reflected by NS0 and investment demand is reflected by I0D.If the real interest rate is i4,there is ________,which will drive the real interest rate up to i*.A)an excess demand for financial capital
B)an excess supply of financial capital
C)an excess supply of saving
D)an excess demand for public saving
Unlock Deck
Unlock for access to all 130 flashcards in this deck.
Unlock Deck
k this deck
50
Consider the long-run theory of investment,saving,and growth.Suppose the government has a budget deficit of $400.If the country's level of national saving is $200,then private saving must be
A)-$400.
B)$200.
C)$400.
D)$600.
E)$800.
A)-$400.
B)$200.
C)$400.
D)$600.
E)$800.
Unlock Deck
Unlock for access to all 130 flashcards in this deck.
Unlock Deck
k this deck
51
Consider the market for financial capital for a closed economy in the long run.Other things being equal,a country with a high national saving rate will tend to have
A)a high growth rate because aggregate expenditure will be high out of any given income.
B)a high growth rate because sustained high investment is possible with high saving.
C)an AS curve moving continually to the left.
D)trouble achieving potential real national income in the short run.
E)either a high or low growth rate depending on the investment demand schedule.
Unlock Deck
Unlock for access to all 130 flashcards in this deck.
Unlock Deck
k this deck
52
The diagram below show the market for financial capital assuming that national income is constant at potential GDP,Y*. FIGURE 25-2 Refer to Figure 25-2.Suppose national saving is reflected by NS0 and investment demand is reflected by I0D.If the real interest rate is i1,there is ________ which will drive the interest rate down until it reaches i*.
A)an excess demand for financial capital
B)an excess demand for investment
C)an excess supply of financial capital
D)an excess supply of public saving
FIGURE 25-2 Refer to Figure 25-2.Suppose national saving is reflected by NS0 and investment demand is reflected by I0D.If the real interest rate is i1,there is ________ which will drive the interest rate down until it reaches i*.A)an excess demand for financial capital
B)an excess demand for investment
C)an excess supply of financial capital
D)an excess supply of public saving
Unlock Deck
Unlock for access to all 130 flashcards in this deck.
Unlock Deck
k this deck
53
Consider the long-run theory of investment,saving,and growth.For a given level of national income,a decrease in government tax revenues will cause
A)a decrease in national saving.
B)an increase in national saving.
C)an increase in the growth rate.
D)no effect on national saving.
E)a decrease in consumption.
A)a decrease in national saving.
B)an increase in national saving.
C)an increase in the growth rate.
D)no effect on national saving.
E)a decrease in consumption.
Unlock Deck
Unlock for access to all 130 flashcards in this deck.
Unlock Deck
k this deck
54
The table below shows aggregate values for a hypothetical economy.Suppose this economy has real GDP equal to potential output. TABLE 25-3 Refer to Table 25-3.What is the level of private saving for this economy?
A)$50
B)$100
C)$500
D)$2000
E)$3000
TABLE 25-3 Refer to Table 25-3.What is the level of private saving for this economy?A)$50
B)$100
C)$500
D)$2000
E)$3000
Unlock Deck
Unlock for access to all 130 flashcards in this deck.
Unlock Deck
k this deck
55
Consider the long-run theory of investment,saving,and growth.Which of the following statements concerning national saving is true?
A)A country's saving rate is unrelated to its growth rate.
B)An increase in the rate of saving will lead to a reduction in consumption and therefore to both a short-run and a long-run decrease in national income.
C)An increase in the rate of saving will cause an immediate increase in national income,but may cause a drop in national income in the long-run.
D)An increase in the rate of saving will always be offset by a reduction in private investment.
E)An increase in the rate of saving will lead to a short-run reduction in national income,but to higher economic growth in the long run.
Unlock Deck
Unlock for access to all 130 flashcards in this deck.
Unlock Deck
k this deck
56
Consider the long-run theory of investment,saving,and growth.For a given level of private saving,an increase in government purchases will likely ________ the economy's long-run growth rate.
A)slow down
B)accelerate
C)not affect
D)increase
E)Not enough information to know
A)slow down
B)accelerate
C)not affect
D)increase
E)Not enough information to know
Unlock Deck
Unlock for access to all 130 flashcards in this deck.
Unlock Deck
k this deck
57
Consider the long-run theory of investment,saving,and growth.For a given level of national income,an increase in private consumption or government purchases will cause national saving to
A)increase.
B)grow at a constant rate.
C)remain unchanged from its initial level.
D)exceed investment.
E)decrease.
A)increase.
B)grow at a constant rate.
C)remain unchanged from its initial level.
D)exceed investment.
E)decrease.
Unlock Deck
Unlock for access to all 130 flashcards in this deck.
Unlock Deck
k this deck
58
Consider the long-run theory of investment,saving,and growth.Suppose the government has a budget surplus of $2 billion.If the country's level of private saving is $1.2 billion,then national saving must be
A)-$1.2 billion.
B)-$800 million.
C)$0.
D)$800 million
E)$3.2 billion
A)-$1.2 billion.
B)-$800 million.
C)$0.
D)$800 million
E)$3.2 billion
Unlock Deck
Unlock for access to all 130 flashcards in this deck.
Unlock Deck
k this deck
59
Consider the long-run theory of investment,saving,and growth.An increase in the government budget surplus,everything else constant,will cause a(n)
A)decrease in national saving.
B)increase in national saving.
C)decrease in the growth rate.
D)equal increase in private consumption.
E)equal decrease in private investment.
A)decrease in national saving.
B)increase in national saving.
C)decrease in the growth rate.
D)equal increase in private consumption.
E)equal decrease in private investment.
Unlock Deck
Unlock for access to all 130 flashcards in this deck.
Unlock Deck
k this deck
60
Consider a closed economy in the long run.A country with a low national saving rate (as a fraction of real GDP)is likely to have
A)a high growth rate because aggregate expenditure will be high out of any given income.
B)either a high or low growth rate depending on the investment schedule.
C)an AS curve moving continually to the right.
D)trouble achieving potential real national income in the short run.
E)a low growth rate because sustained high investment is not possible with low saving.
Unlock Deck
Unlock for access to all 130 flashcards in this deck.
Unlock Deck
k this deck
61
The Neoclassical growth model assumes that,with a given state of technology,increases in the use of a single factor will eventually
A)increase the average product of the factor.
B)decrease the average product of the factor.
C)lead to an increase in the marginal output of the factor.
D)lead to a decrease in total output by the factor.
E)lead to an increase in the material standard of living.
A)increase the average product of the factor.
B)decrease the average product of the factor.
C)lead to an increase in the marginal output of the factor.
D)lead to a decrease in total output by the factor.
E)lead to an increase in the material standard of living.
Unlock Deck
Unlock for access to all 130 flashcards in this deck.
Unlock Deck
k this deck
62
Which of the following is a central assumption of the Neoclassical growth model?
A)Long-run growth arises from correcting market failures.
B)Long-run growth arises only from technological innovation.
C)There are diminishing marginal returns to a single factor.
D)There are constant marginal returns to investment.
E)There are increasing marginal returns to capital investment.
A)Long-run growth arises from correcting market failures.
B)Long-run growth arises only from technological innovation.
C)There are diminishing marginal returns to a single factor.
D)There are constant marginal returns to investment.
E)There are increasing marginal returns to capital investment.
Unlock Deck
Unlock for access to all 130 flashcards in this deck.
Unlock Deck
k this deck
63
The diagram below show the market for financial capital assuming that national income is constant at potential GDP,Y*. FIGURE 25-2 Refer to Figure 25-2.Suppose national saving is reflected by NS0 and investment demand is reflected by I0D.Now suppose the government implements a revenue-neutral tax policy that encourages investment.What is the effect on the real interest rate?
A)There is no effect on NS or ID,and the interest rate remains at i*.
B)National saving shifts to NS1,and the real interest rate falls to i3.
C)The real interest rate rises because of the decrease in the budget surplus.
D)The real interest rate falls because of the decrease in the budget surplus.
E)Investment demand shifts to I1D,and the real interest rate rises to i2.
FIGURE 25-2 Refer to Figure 25-2.Suppose national saving is reflected by NS0 and investment demand is reflected by I0D.Now suppose the government implements a revenue-neutral tax policy that encourages investment.What is the effect on the real interest rate?A)There is no effect on NS or ID,and the interest rate remains at i*.
B)National saving shifts to NS1,and the real interest rate falls to i3.
C)The real interest rate rises because of the decrease in the budget surplus.
D)The real interest rate falls because of the decrease in the budget surplus.
E)Investment demand shifts to I1D,and the real interest rate rises to i2.
Unlock Deck
Unlock for access to all 130 flashcards in this deck.
Unlock Deck
k this deck
64
The Neoclassical growth model assumes that,with a given state of technology,increases in the use of a single factor eventually cause the
A)average product of the factor to increase.
B)marginal product of the factor to fall.
C)marginal product of the factor to increase at an increasing rate.
D)marginal product of the factor to increase but at a decreasing rate.
E)material standard of living to increase.
A)average product of the factor to increase.
B)marginal product of the factor to fall.
C)marginal product of the factor to increase at an increasing rate.
D)marginal product of the factor to increase but at a decreasing rate.
E)material standard of living to increase.
Unlock Deck
Unlock for access to all 130 flashcards in this deck.
Unlock Deck
k this deck
65
In the Neoclassical growth model,decreases in the population,other things being equal,would eventually result in
A)decreasing GDP and falling living standards.
B)decreasing GDP and increasing living standards.
C)increasing GDP and falling living standards.
D)increasing GDP and increasing living standards.
E)increasing savings and increasing living standards.
A)decreasing GDP and falling living standards.
B)decreasing GDP and increasing living standards.
C)increasing GDP and falling living standards.
D)increasing GDP and increasing living standards.
E)increasing savings and increasing living standards.
Unlock Deck
Unlock for access to all 130 flashcards in this deck.
Unlock Deck
k this deck
66
The diagram below show the market for financial capital assuming that national income is constant at potential GDP,Y*. FIGURE 25-2 Refer to Figure 25-2.Suppose national saving is reflected by NS0 and investment demand is reflected by I0D.Now suppose there is a reduction in government purchases.What is the effect on investment demand?
A)National saving shifts to NS1,causing an increase in the quantity of investment demanded from I* to I2.
B)There is no effect on NS or ID,and the quantity of investment demanded remains at I*.
C)Investment demand shifts to I1D,causing an increase in the quantity of investment demanded from I* to I1.
D)Investment demand shifts to I1D, causing an increase in the quantity of investment demanded from I* to I3.
E)National saving shifts to NS1,and investment demand shifts to I1D,causing an increase in the quantity of investment demanded from I* to I3.
FIGURE 25-2 Refer to Figure 25-2.Suppose national saving is reflected by NS0 and investment demand is reflected by I0D.Now suppose there is a reduction in government purchases.What is the effect on investment demand?A)National saving shifts to NS1,causing an increase in the quantity of investment demanded from I* to I2.
B)There is no effect on NS or ID,and the quantity of investment demanded remains at I*.
C)Investment demand shifts to I1D,causing an increase in the quantity of investment demanded from I* to I1.
D)Investment demand shifts to I1D, causing an increase in the quantity of investment demanded from I* to I3.
E)National saving shifts to NS1,and investment demand shifts to I1D,causing an increase in the quantity of investment demanded from I* to I3.
Unlock Deck
Unlock for access to all 130 flashcards in this deck.
Unlock Deck
k this deck
67
In the Neoclassical growth model,if capital and labour grow at the same rate,we will observe
A)rising GDP but falling living standards.
B)rising GDP but no change in living standards.
C)rising GDP and increasing living standards.
D)increasing living standards but only for workers using labour-intensive production.
E)increasing living standards but only for workers using capital-intensive production.
Unlock Deck
Unlock for access to all 130 flashcards in this deck.
Unlock Deck
k this deck
68
One important assumption of the Neoclassical growth model is that,with a given state of technology,
A)increases in the use of a single factor bring increasing returns.
B)increases in the use of a single factor result in constant returns.
C)increases in the use of single factor bring diminishing returns.
D)the return from successive units of a single factor increases over time.
E)increases in GDP are possible only if all factors are increased at an equal rate.
Unlock Deck
Unlock for access to all 130 flashcards in this deck.
Unlock Deck
k this deck
69
In the long run,an increase in the demand for investment pushes ________ the real interest rate,encourages ________ saving by households,and leads to a ________ future growth rate of potential output.
A)down; less; lower
B)up; less; lower
C)down; less; higher
D)up; more; higher
E)up; more; lower
A)down; less; lower
B)up; less; lower
C)down; less; higher
D)up; more; higher
E)up; more; lower
Unlock Deck
Unlock for access to all 130 flashcards in this deck.
Unlock Deck
k this deck
70
The main properties of a Neoclassical aggregate production function are ________ when all factors are increased proportionally and ________ when any one factor is increased on its own.
A)increasing returns to scale; diminishing marginal returns
B)constant returns to scale; diminishing marginal returns
C)constant returns to scale; constant marginal returns
D)decreasing returns to scale; diminishing marginal returns
E)increasing returns to scale; increasing marginal returns
A)increasing returns to scale; diminishing marginal returns
B)constant returns to scale; diminishing marginal returns
C)constant returns to scale; constant marginal returns
D)decreasing returns to scale; diminishing marginal returns
E)increasing returns to scale; increasing marginal returns
Unlock Deck
Unlock for access to all 130 flashcards in this deck.
Unlock Deck
k this deck
71
The diagram below show the market for financial capital assuming that national income is constant at potential GDP,Y*. FIGURE 25-2 Refer to Figure 25-2.Suppose national saving is reflected by NS0 and investment demand is reflected by I0D.Now suppose there is a reduction in government purchases (G).What is likely to happen in this market for financial capital?
A)There is no effect on NS or ID,and the interest rate remains at i*.
B)National saving shifts to NS1 and the interest rate falls to i3.
C)Investment demand shifts to I1D,and the interest rate rises to i2.
D)The real interest rate rises because of the decrease in the budget surplus.
E)The real interest rate falls because of the decrease in the budget surplus.
FIGURE 25-2 Refer to Figure 25-2.Suppose national saving is reflected by NS0 and investment demand is reflected by I0D.Now suppose there is a reduction in government purchases (G).What is likely to happen in this market for financial capital?A)There is no effect on NS or ID,and the interest rate remains at i*.
B)National saving shifts to NS1 and the interest rate falls to i3.
C)Investment demand shifts to I1D,and the interest rate rises to i2.
D)The real interest rate rises because of the decrease in the budget surplus.
E)The real interest rate falls because of the decrease in the budget surplus.
Unlock Deck
Unlock for access to all 130 flashcards in this deck.
Unlock Deck
k this deck
72
Consider the Neoclassical growth model.The effect of an increase in population (or the labour force)in an economy,with everything else held constant,is
A)an increase in per capita national income.
B)an increasingly aging population.
C)a decrease in per capita output.
D)a decrease in the capital-output ratio.
E)an inward shift of the production possibilities boundary.
A)an increase in per capita national income.
B)an increasingly aging population.
C)a decrease in per capita output.
D)a decrease in the capital-output ratio.
E)an inward shift of the production possibilities boundary.
Unlock Deck
Unlock for access to all 130 flashcards in this deck.
Unlock Deck
k this deck
73
In the Neoclassical growth model,whenever diminishing returns applies,increases in the population,other things being equal,are accompanied by
A)decreasing GDP and falling living standards.
B)decreasing GDP and increasing living standards.
C)increasing GDP and falling living standards.
D)increasing GDP and constant living standards.
E)increasing GDP and increasing living standards.
A)decreasing GDP and falling living standards.
B)decreasing GDP and increasing living standards.
C)increasing GDP and falling living standards.
D)increasing GDP and constant living standards.
E)increasing GDP and increasing living standards.
Unlock Deck
Unlock for access to all 130 flashcards in this deck.
Unlock Deck
k this deck
74
The diagram below shows the market for financial capital in the long run when real GDP is equal to potential output,Y*. FIGURE 25-3 Refer to Figure 25-3.The equilibrium interest rate in this market is ________% and the equilibrium flow of investment and saving is ________ billion dollars.
A)1; 50
B)2; 60
C)3; 70
D)4; 80
E)5; 90
FIGURE 25-3 Refer to Figure 25-3.The equilibrium interest rate in this market is ________% and the equilibrium flow of investment and saving is ________ billion dollars.A)1; 50
B)2; 60
C)3; 70
D)4; 80
E)5; 90
Unlock Deck
Unlock for access to all 130 flashcards in this deck.
Unlock Deck
k this deck
75
The diagram below show the market for financial capital assuming that national income is constant at potential GDP,Y*. FIGURE 25-2 Refer to Figure 25-2.Suppose national saving is reflected by NS0 and investment demand is reflected by I0D.Now suppose the government implements a revenue-neutral tax policy that encourages investment.What is the effect on the quantity of national saving?
A)There is no effect on NS or ID and the quantity of national saving supplied remains at I*.
B)National saving shifts to NS1,and the quantity of national saving supplied rises to I2.
C)Investment demand shifts to I1D and the quantity of national saving supplied rises to I1.
D)Investment demand shifts to I1D,national saving shifts to NS1,and the quantity of national saving rises to I3.
E)National saving shifts to NS1,investment demand shifts to I1D,and the quantity of national saving rises to I1.
FIGURE 25-2 Refer to Figure 25-2.Suppose national saving is reflected by NS0 and investment demand is reflected by I0D.Now suppose the government implements a revenue-neutral tax policy that encourages investment.What is the effect on the quantity of national saving?A)There is no effect on NS or ID and the quantity of national saving supplied remains at I*.
B)National saving shifts to NS1,and the quantity of national saving supplied rises to I2.
C)Investment demand shifts to I1D and the quantity of national saving supplied rises to I1.
D)Investment demand shifts to I1D,national saving shifts to NS1,and the quantity of national saving rises to I3.
E)National saving shifts to NS1,investment demand shifts to I1D,and the quantity of national saving rises to I1.
Unlock Deck
Unlock for access to all 130 flashcards in this deck.
Unlock Deck
k this deck
76
The diagram below shows the market for financial capital in the long run when real GDP is equal to potential output,Y*. FIGURE 25-3 Refer to Figure 25-3.Suppose the interest rate in this market for financial capital is 4%.In this case there is an excess ________ financial capital of ________ billion dollars.
A)supply of; 30
B)demand for; -60
C)supply of; 90
D)demand for; 30
E)demand for; 60
FIGURE 25-3 Refer to Figure 25-3.Suppose the interest rate in this market for financial capital is 4%.In this case there is an excess ________ financial capital of ________ billion dollars.A)supply of; 30
B)demand for; -60
C)supply of; 90
D)demand for; 30
E)demand for; 60
Unlock Deck
Unlock for access to all 130 flashcards in this deck.
Unlock Deck
k this deck
77
In the Neoclassical growth model,increases in the stock of physical capital,other things being equal,will lead to
A)decreasing GDP and falling living standards.
B)decreasing GDP and increasing living standards.
C)increasing GDP and falling living standards.
D)increasing GDP and increasing living standards.
E)increasing GDP and decreased national wealth.
A)decreasing GDP and falling living standards.
B)decreasing GDP and increasing living standards.
C)increasing GDP and falling living standards.
D)increasing GDP and increasing living standards.
E)increasing GDP and decreased national wealth.
Unlock Deck
Unlock for access to all 130 flashcards in this deck.
Unlock Deck
k this deck
78
The diagram below shows the market for financial capital in the long run when real GDP is equal to potential output,Y*. FIGURE 25-3 Refer to Figure 25-3.Suppose the interest rate in this market for financial capital is 2%.In this case there is an excess ________ financial capital of ________ billion dollars.
A)supply of; 30
B)demand for; -30
C)supply of; 50
D)demand for; 30
E)demand for; 80
FIGURE 25-3 Refer to Figure 25-3.Suppose the interest rate in this market for financial capital is 2%.In this case there is an excess ________ financial capital of ________ billion dollars.A)supply of; 30
B)demand for; -30
C)supply of; 50
D)demand for; 30
E)demand for; 80
Unlock Deck
Unlock for access to all 130 flashcards in this deck.
Unlock Deck
k this deck
79
Data from most industrialized countries show that countries with high investment rates (as a percentage of GDP)tend to be countries
A)with the highest levels of per capita GDP.
B)with the highest levels of GDP.
C)with high rates of economic growth.
D)with the lowest rate of national saving.
E)with a negative relationship between investment and the rate of economic growth.
A)with the highest levels of per capita GDP.
B)with the highest levels of GDP.
C)with high rates of economic growth.
D)with the lowest rate of national saving.
E)with a negative relationship between investment and the rate of economic growth.
Unlock Deck
Unlock for access to all 130 flashcards in this deck.
Unlock Deck
k this deck
80
The diagram below shows the market for financial capital in the long run when real GDP is equal to potential output,Y*. FIGURE 25-3 Refer to Figure 25-3.Suppose the interest rate in this market for financial capital is 2%.Which of the following statements correctly describes the adjustment that will occur in this market?
A)The excess supply of saving will push up the real interest rate,which will decrease the quantity demanded of investment and increase the quantity supplied of saving.
B)The excess demand for investment will push up the real interest rate,which will decrease the quantity demanded of investment and increase the quantity supplied of saving.
C)The excess supply of saving will push down the real interest rate,which will decrease the quantity demanded of investment and increase the quantity supplied of saving.
D)The excess demand for investment will push down the real interest rate,which will decrease the quantity demanded of investment and increase the quantity supplied of saving.
E)The excess demand for investment will push up the real interest rate,which will increase the quantity demanded of investment and decrease the quantity supplied of saving.
FIGURE 25-3 Refer to Figure 25-3.Suppose the interest rate in this market for financial capital is 2%.Which of the following statements correctly describes the adjustment that will occur in this market?A)The excess supply of saving will push up the real interest rate,which will decrease the quantity demanded of investment and increase the quantity supplied of saving.
B)The excess demand for investment will push up the real interest rate,which will decrease the quantity demanded of investment and increase the quantity supplied of saving.
C)The excess supply of saving will push down the real interest rate,which will decrease the quantity demanded of investment and increase the quantity supplied of saving.
D)The excess demand for investment will push down the real interest rate,which will decrease the quantity demanded of investment and increase the quantity supplied of saving.
E)The excess demand for investment will push up the real interest rate,which will increase the quantity demanded of investment and decrease the quantity supplied of saving.
Unlock Deck
Unlock for access to all 130 flashcards in this deck.
Unlock Deck
k this deck
Unlock Deck
Unlock for access to all 130 flashcards in this deck.


