Deck 2: Economic Theories, data, and Graphs
Full screen (f)
Question
Question
Question
Question
Question
Question
Question
Question
Question
Question
Question
Question
Question
Question
Question
Question
Question
Question
Question
Question
Question
Question
Question
Question
Question
Question
Question
Question
Question
Question
Question
Question
Question
Question
Question
Question
Question
Question
Question
Question
Question
The table below shows hypothetical monthly cell phone plan fees for the identical service over several years.  TABLE 2-2 Refer to Table 2-2.Assume that 2015 is used as the base year,with the index number = 100.The value of the index number in 2017 is
A)100.
B)0.72.
C)72.73.
D)1.375.
E)137.5.
TABLE 2-2 Refer to Table 2-2.Assume that 2015 is used as the base year,with the index number = 100.The value of the index number in 2017 isA)100.
B)0.72.
C)72.73.
D)1.375.
E)137.5.
Question
The table below shows hypothetical monthly cell phone plan fees for the identical service over several years.  TABLE 2-2 Refer to Table 2-2.Assume that 2015 is used as the base year,with the index number = 100.What is the percentage change in the monthly fee from 2018 to 2019?
A)-28.6%
B)-10.0%
C)-71.4%
D)-25.0%
E)-35.0%
TABLE 2-2 Refer to Table 2-2.Assume that 2015 is used as the base year,with the index number = 100.What is the percentage change in the monthly fee from 2018 to 2019?A)-28.6%
B)-10.0%
C)-71.4%
D)-25.0%
E)-35.0%
Question
Question
Question
The table below shows hypothetical tuition costs at a Canadian university.  TABLE 2-1 Refer to Table 2-1.The increase in tuition fees from 2015 to 2019 is
A)200.
B)100/5000.
C)4%.
D)0.04%.
E)200/5200.
TABLE 2-1 Refer to Table 2-1.The increase in tuition fees from 2015 to 2019 isA)200.
B)100/5000.
C)4%.
D)0.04%.
E)200/5200.
Question
The table below shows hypothetical tuition costs at a Canadian university. 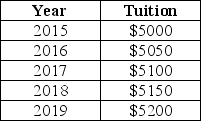 TABLE 2-1 Refer to Table 2-1.Assume that 2015 is used as the base year,with the index number = 100.The value of the index number in 2019 is
A)100.
B)104.
C)1.04.
D)96.
E)0.96.
TABLE 2-1 Refer to Table 2-1.Assume that 2015 is used as the base year,with the index number = 100.The value of the index number in 2019 isA)100.
B)104.
C)1.04.
D)96.
E)0.96.
Question
The table below shows hypothetical data for volumes of e-books and hardcover books sold over a 3-year period in a particular city. 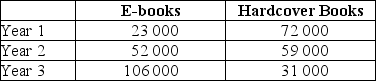 TABLE 2-3 Refer to Table 2-3.Suppose we choose Year 1 as the base year and construct a series of index numbers with which to analyze sales data.The index numbers for volumes of hardcover books sold (starting with Year 1)is
A)431; 819; 100.
B)43.1; 81.9; 100.
C)100; 81.9; 43.1.
D)100; 0.819; 0.431.
E)0.431; 0.819; 100.
TABLE 2-3 Refer to Table 2-3.Suppose we choose Year 1 as the base year and construct a series of index numbers with which to analyze sales data.The index numbers for volumes of hardcover books sold (starting with Year 1)isA)431; 819; 100.
B)43.1; 81.9; 100.
C)100; 81.9; 43.1.
D)100; 0.819; 0.431.
E)0.431; 0.819; 100.
Question
Question
Let 1 stand for "any given period" and 2 stand for "base period." The formula of any index number can be written as
A)value of index at 1 =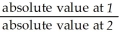 × 100.
B)value of index at 1 =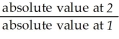 × 100.
C)value of index at 1 =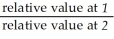 × 100.
D)value of index at 1 = .
.
E)value of index at 1 = .
.
A)value of index at 1 =
× 100.B)value of index at 1 =
× 100.C)value of index at 1 =
× 100.D)value of index at 1 =
.E)value of index at 1 =
. Question
Question
Question
The table below shows hypothetical monthly cell phone plan fees for the identical service over several years.  TABLE 2-2 Refer to Table 2-2.Assume that 2015 is used as the base year,with the index number = 100.The value of the index number in 2018 is calculated as follows:
A)(35/100)× 100 = 35.
B)35/55 = 0.64.
C)55/35 = 1.57.
D)(35/55)× 100 = 63.64.
E)(55/35)× 100 = 157.14.
TABLE 2-2 Refer to Table 2-2.Assume that 2015 is used as the base year,with the index number = 100.The value of the index number in 2018 is calculated as follows:A)(35/100)× 100 = 35.
B)35/55 = 0.64.
C)55/35 = 1.57.
D)(35/55)× 100 = 63.64.
E)(55/35)× 100 = 157.14.
Question
The table below shows hypothetical monthly cell phone plan fees for the identical service over several years.  TABLE 2-2 Refer to Table 2-2.Assume that 2015 is used as the base year,with the index number = 100.Which of the following series is the correct set of index numbers for the monthly cell phone charges from 2015 to 2019?
A)0.55; 0.50; 0.40; 0.35; 0.25
B)100; 91; 73; 64; 45
C)55; 50; 40; 35; 25
D)1.0; 0.91; 0.73; 0.64; 0.45
E)100%; 91%; 73%; 64%; 45%
TABLE 2-2 Refer to Table 2-2.Assume that 2015 is used as the base year,with the index number = 100.Which of the following series is the correct set of index numbers for the monthly cell phone charges from 2015 to 2019?A)0.55; 0.50; 0.40; 0.35; 0.25
B)100; 91; 73; 64; 45
C)55; 50; 40; 35; 25
D)1.0; 0.91; 0.73; 0.64; 0.45
E)100%; 91%; 73%; 64%; 45%
Question
The table below shows hypothetical tuition costs at a Canadian university.  TABLE 2-1 Refer to Table 2-1.Assume that 2017 is used as the base year,with the index number = 100.The value of the index number in 2015 is calculated as follows:
A)5000/5100 = 0.98.
B)(5100/5000)× 100 = 102.
C)5100/5000 = 1.02.
D)5100/5100 = 100.
E)(5000/5100)× 100 = 98.
TABLE 2-1 Refer to Table 2-1.Assume that 2017 is used as the base year,with the index number = 100.The value of the index number in 2015 is calculated as follows:A)5000/5100 = 0.98.
B)(5100/5000)× 100 = 102.
C)5100/5000 = 1.02.
D)5100/5100 = 100.
E)(5000/5100)× 100 = 98.
Question
Question
Question
The table below shows hypothetical monthly cell phone plan fees for the identical service over several years. 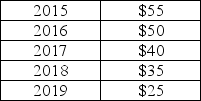 TABLE 2-2 Refer to Table 2-2.Assume that 2015 is used as the base year,with the index number = 100.The value of the index number in 2019 is
A)0.25.
B)2.5.
C)25.0.
D)0.45.
E)45.45.
TABLE 2-2 Refer to Table 2-2.Assume that 2015 is used as the base year,with the index number = 100.The value of the index number in 2019 isA)0.25.
B)2.5.
C)25.0.
D)0.45.
E)45.45.
Question
The table below shows hypothetical tuition costs at a Canadian university.  TABLE 2-1 Refer to Table 2-1.Assume that 2015 is used as the base year,with the index number = 100.The value of the index number in 2017 is calculated as follows:
A)(5000/5100)× 100 = 98.
B)5100/5000 = 1.02.
C)5000/5100 = 0.98.
D)5100/5100 = 100.
E)(5100/5000)× 100 = 102.
TABLE 2-1 Refer to Table 2-1.Assume that 2015 is used as the base year,with the index number = 100.The value of the index number in 2017 is calculated as follows:A)(5000/5100)× 100 = 98.
B)5100/5000 = 1.02.
C)5000/5100 = 0.98.
D)5100/5100 = 100.
E)(5100/5000)× 100 = 102.
Question
The table below shows hypothetical data for volumes of e-books and hardcover books sold over a 3-year period in a particular city.  TABLE 2-3 Refer to Table 2-3.Suppose we choose Year 1 as the base year and construct a series of index numbers with which to analyze the sales data.The index numbers for volumes of e-books sold (starting with Year 1)is
A)100; 44.2; 21.7.
B)100; 226.1; 460.9.
C)23 000; 52 000; 106 000.
D)100; 126.1; 360.1.
E)1; 0.442; 0.217.
TABLE 2-3 Refer to Table 2-3.Suppose we choose Year 1 as the base year and construct a series of index numbers with which to analyze the sales data.The index numbers for volumes of e-books sold (starting with Year 1)isA)100; 44.2; 21.7.
B)100; 226.1; 460.9.
C)23 000; 52 000; 106 000.
D)100; 126.1; 360.1.
E)1; 0.442; 0.217.
Question
Question
The table below shows hypothetical data for the volume of gold and nickel output across several years.  TABLE 2-5 Refer to Table 2-5.What is the index number for nickel output in Year 6?
A)108.2
B)105.3
C)110.7
D)95.0
E)95.0%
TABLE 2-5 Refer to Table 2-5.What is the index number for nickel output in Year 6?A)108.2
B)105.3
C)110.7
D)95.0
E)95.0%
Question
The table below shows hypothetical prices for a particular anatomy textbook at a university bookstore over several years.  TABLE 2-4 Refer to Table 2-4.The increase in the price of the textbook from 2015 to 2019 is
A)-40.
B)40.
C)18.2%.
D)22.2%.
E)40%.
TABLE 2-4 Refer to Table 2-4.The increase in the price of the textbook from 2015 to 2019 isA)-40.
B)40.
C)18.2%.
D)22.2%.
E)40%.
Question
The table below shows hypothetical data for the volume of gold and nickel output across several years.  TABLE 2-5 Refer to Table 2-5.What is the index number for gold output in Year 8?
A)111.9
B)111.9%
C)11.9
D)11.9%
E)1.119
TABLE 2-5 Refer to Table 2-5.What is the index number for gold output in Year 8?A)111.9
B)111.9%
C)11.9
D)11.9%
E)1.119
Question
The table below shows hypothetical data for the volume of gold and nickel output across several years.  TABLE 2-6 Refer to Table 2-6.What is the percentage change in gold output from Year 1 to Year 7?
A)17.9%
B)84.8%
C)15.2%
D)-15.2%
E)0.152%
TABLE 2-6 Refer to Table 2-6.What is the percentage change in gold output from Year 1 to Year 7?A)17.9%
B)84.8%
C)15.2%
D)-15.2%
E)0.152%
Question
The table below shows hypothetical data for the volume of gold and nickel output across several years.  TABLE 2-5 Refer to Table 2-5.What is the index number for gold output in Year 1?
A)0.91
B)109.7
C)1.097
D)91.2
E)99.7
TABLE 2-5 Refer to Table 2-5.What is the index number for gold output in Year 1?A)0.91
B)109.7
C)1.097
D)91.2
E)99.7
Question
The table below shows the approximate value of Canada's crude oil and natural gas exports over a 5-year period.The amounts shown are billions of dollars. 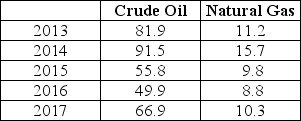 TABLE 2-7 Refer to Table 2-7.Assume that 2013 is the base year,with an index number = 100.What is the index number for the value of natural gas exports in 2017?
A)0.912
B)92.0
C)92.0%
D)1.09
E)109.7
TABLE 2-7 Refer to Table 2-7.Assume that 2013 is the base year,with an index number = 100.What is the index number for the value of natural gas exports in 2017?A)0.912
B)92.0
C)92.0%
D)1.09
E)109.7
Question
The table below shows the approximate value of Canada's crude oil and natural gas exports over a 5-year period.The amounts shown are billions of dollars.  TABLE 2-7 Refer to Table 2-7.Assume that 2013 is the base year,with an index number = 100.What is the index number for the value of crude oil exports in 2017?
A)1.22
B)122.4
C)122.4%
D)0.817
E)81.7
TABLE 2-7 Refer to Table 2-7.Assume that 2013 is the base year,with an index number = 100.What is the index number for the value of crude oil exports in 2017?A)1.22
B)122.4
C)122.4%
D)0.817
E)81.7
Question
The table below shows hypothetical data for the volume of gold and nickel output across several years. 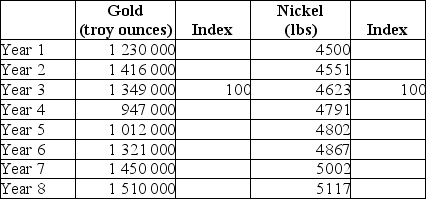 TABLE 2-5 Refer to Table 2-5.What is the index number for nickel output in Year 2?
A)98.4%
B)98.4
C)-72.0%
D)72.0%
E)0.984%
TABLE 2-5 Refer to Table 2-5.What is the index number for nickel output in Year 2?A)98.4%
B)98.4
C)-72.0%
D)72.0%
E)0.984%
Question
The table below shows hypothetical prices for a particular anatomy textbook at a university bookstore over several years.  TABLE 2-4 Refer to Table 2-4.Assume that 2015 is used as the base year,with the index number = 100.The value of the index number in 2017 is
A)0.878.
B)1.0.
C)1.139.
D)87.8.
E)113.9.
TABLE 2-4 Refer to Table 2-4.Assume that 2015 is used as the base year,with the index number = 100.The value of the index number in 2017 isA)0.878.
B)1.0.
C)1.139.
D)87.8.
E)113.9.
Question
The table below shows hypothetical prices for a particular anatomy textbook at a university bookstore over several years. 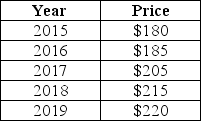 TABLE 2-4 Refer to Table 2-4.Assume that 2015 is used as the base year,with the index number = 100.The value of the index number in 2018 is calculated as follows:
A)215/180 = 1.194.
B)180/215 = 0.837.
C)(215/180)× 100 = 119.4.
D)(180/215)× 100 = 83.7.
E)(215 - 180)= 35.
TABLE 2-4 Refer to Table 2-4.Assume that 2015 is used as the base year,with the index number = 100.The value of the index number in 2018 is calculated as follows:A)215/180 = 1.194.
B)180/215 = 0.837.
C)(215/180)× 100 = 119.4.
D)(180/215)× 100 = 83.7.
E)(215 - 180)= 35.
Question
The table below shows the approximate value of Canada's crude oil and natural gas exports over a 5-year period.The amounts shown are billions of dollars.  TABLE 2-7 Refer to Table 2-7.Assume that 2013 is the base year,with an index number = 100.What is the index number for the value of crude oil exports in 2016?
A)1.64
B)164.1
C)60.9
D)0.609
E)60.9%
TABLE 2-7 Refer to Table 2-7.Assume that 2013 is the base year,with an index number = 100.What is the index number for the value of crude oil exports in 2016?A)1.64
B)164.1
C)60.9
D)0.609
E)60.9%
Question
The table below shows hypothetical data for volumes of e-books and hardcover books sold over a 3-year period in a particular city.  TABLE 2-3 Refer to Table 2-3.Between Year 1 and Year 3,what is the percentage change in sales of e-books?
A)83 000%
B)460.9%
C)360.9%
D)21.7%
E)83%
TABLE 2-3 Refer to Table 2-3.Between Year 1 and Year 3,what is the percentage change in sales of e-books?A)83 000%
B)460.9%
C)360.9%
D)21.7%
E)83%
Question
The table below shows the approximate value of Canada's crude oil and natural gas exports over a 5-year period.The amounts shown are billions of dollars.  TABLE 2-7 Refer to Table 2-7.Assume that 2013 is the base year,with an index number = 100.What is the index number for the value of natural gas exports in 2016?
A)0.109
B)108.7%
C)108.7
D)78.6
E)0.786
TABLE 2-7 Refer to Table 2-7.Assume that 2013 is the base year,with an index number = 100.What is the index number for the value of natural gas exports in 2016?A)0.109
B)108.7%
C)108.7
D)78.6
E)0.786
Question
The table below shows hypothetical data for volumes of e-books and hardcover books sold over a 3-year period in a particular city.  TABLE 2-3 Refer to Table 2-3.Between Year 1 and Year 3,what is the percentage change in sales of hardcover books?
A)0.569%
B)56.9%
C)-56.9%
D)-0.569%
E)-569%
TABLE 2-3 Refer to Table 2-3.Between Year 1 and Year 3,what is the percentage change in sales of hardcover books?A)0.569%
B)56.9%
C)-56.9%
D)-0.569%
E)-569%
Question
The table below shows hypothetical prices for a particular anatomy textbook at a university bookstore over several years.  TABLE 2-4 Refer to Table 2-4.Assume that 2019 is used as the base year,with the index number = 100.The value of the index number in 2015 is
A)0.818.
B)1.0.
C)1.222.
D)81.8.
E)122.2.
TABLE 2-4 Refer to Table 2-4.Assume that 2019 is used as the base year,with the index number = 100.The value of the index number in 2015 isA)0.818.
B)1.0.
C)1.222.
D)81.8.
E)122.2.
Question
The table below shows hypothetical data for the volume of gold and nickel output across several years.  TABLE 2-6 Refer to Table 2-6.What is the index number for gold output in Year 8?
A)104.1%
B)104.1
C)1.04
D)60
E)60%
TABLE 2-6 Refer to Table 2-6.What is the index number for gold output in Year 8?A)104.1%
B)104.1
C)1.04
D)60
E)60%
Question
The table below shows hypothetical data for the volume of gold and nickel output across several years.  TABLE 2-6 Refer to Table 2-6.What is the index number for nickel output in Year 3?
A)92.4%
B)-379
C)379
D)0.924%
E)92.4
TABLE 2-6 Refer to Table 2-6.What is the index number for nickel output in Year 3?A)92.4%
B)-379
C)379
D)0.924%
E)92.4
Question
The table below shows hypothetical data for the volume of gold and nickel output across several years.  TABLE 2-6 Refer to Table 2-6.What is the index number for gold output in Year 2?
A)97.7%
B)0.977
C)-3.4%
D)97.7
E)-34%
TABLE 2-6 Refer to Table 2-6.What is the index number for gold output in Year 2?A)97.7%
B)0.977
C)-3.4%
D)97.7
E)-34%
Question
The table below shows the approximate value of Canada's crude oil and natural gas exports over a 5-year period.The amounts shown are billions of dollars.  TABLE 2-7 Refer to Table 2-7.Assume that 2013 is the base year,with an index number = 100.What is the percentage change in the value of exports of crude oil from 2013 to 2017?
A)-18.3%
B)-183.2%
C)-100%
D)18.3%
E)183.2%
TABLE 2-7 Refer to Table 2-7.Assume that 2013 is the base year,with an index number = 100.What is the percentage change in the value of exports of crude oil from 2013 to 2017?A)-18.3%
B)-183.2%
C)-100%
D)18.3%
E)183.2%
Question
The table below shows hypothetical data for the volume of gold and nickel output across several years. 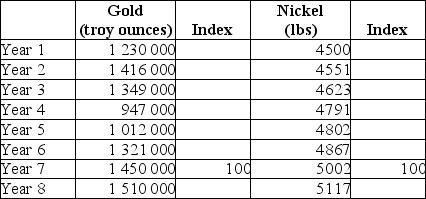 TABLE 2-6 Refer to Table 2-6.What is the index number for nickel output in Year 5?
A)-200
B)-200%
C)96
D)0.96%
E)96%
TABLE 2-6 Refer to Table 2-6.What is the index number for nickel output in Year 5?A)-200
B)-200%
C)96
D)0.96%
E)96%

Unlock Deck
Sign up to unlock the cards in this deck!
Unlock Deck
Unlock Deck
1/147
Play
Full screen (f)
Deck 2: Economic Theories, data, and Graphs
1
Which of the following is a normative statement?
A)The higher is the level of taxes,the lower is consumption spending.
B)The higher is the level of taxes,the higher are wage demands.
C)A reduction in export taxes on petroleum would result in higher wages.
D)Tuition fees should be waived for low-income students.
E)A free-trade agreement between two countries will result in an increase in trade.
Tuition fees should be waived for low-income students.
2
Which is the best description of a normative statement? A normative statement
A)can be derived logically from facts.
B)concerns what is provable.
C)is a statement that is empirically testable.
D)is one that involves a value judgment.
E)has no place in the study and practice of economics.
A)can be derived logically from facts.
B)concerns what is provable.
C)is a statement that is empirically testable.
D)is one that involves a value judgment.
E)has no place in the study and practice of economics.
is one that involves a value judgment.
3
Which of the following best describes a theory? A theory
A)enables one to predict the future with certainty.
B)is designed to explain and predict what we observe.
C)is used to impose order on the world.
D)can only be tested with a controlled experiment.
E)assumes definitions for variables.
A)enables one to predict the future with certainty.
B)is designed to explain and predict what we observe.
C)is used to impose order on the world.
D)can only be tested with a controlled experiment.
E)assumes definitions for variables.
is designed to explain and predict what we observe.
4
Which of the following best describes the relationship between positive and normative statements in economics?
A)Normative statements are those with which all economists agree; positive statements may give rise to some disagreement.
B)Positive and normative statements are alternate ways of describing the desirability of certain economic policies.
C)Normative statements evaluate the desirability of certain economic changes; positive statements do not.
D)Neither positive nor normative statements are concerned with the desirability of certain economic changes.
E)Economists generally agree with each other regardless of whether a question is positive or normative.
Unlock Deck
Unlock for access to all 147 flashcards in this deck.
Unlock Deck
k this deck
5
Suppose an economist tells you that the unemployment rate in Canada last year was 7.8%.This is an example of a(n)________ statement.
A)autonomous
B)positive
C)normative
D)induced
E)imputed
A)autonomous
B)positive
C)normative
D)induced
E)imputed
Unlock Deck
Unlock for access to all 147 flashcards in this deck.
Unlock Deck
k this deck
6
Which is the best description of positive statements? Positive statements
A)have been verified by appeal to factual evidence.
B)form the basis of all normative arguments.
C)are falsifiable in principle by appeal to factual evidence.
D)are seldom employed in social sciences like economics.
E)have no place in economics because economics deals only with value judgments.
A)have been verified by appeal to factual evidence.
B)form the basis of all normative arguments.
C)are falsifiable in principle by appeal to factual evidence.
D)are seldom employed in social sciences like economics.
E)have no place in economics because economics deals only with value judgments.
Unlock Deck
Unlock for access to all 147 flashcards in this deck.
Unlock Deck
k this deck
7
Which of the following is a normative statement?
A)The sun rises in the west and sets in the east.
B)A government deficit will reduce unemployment and cause an increase in prices.
C)Reducing unemployment is more important than reducing inflation.
D)Queen Elizabeth II is the wealthiest woman in the world.
E)An increase in the price of lumber is followed by a decrease in the construction of new houses.
Unlock Deck
Unlock for access to all 147 flashcards in this deck.
Unlock Deck
k this deck
8
The statement that a 2% increase in the money supply leads to a 2% increase in the price level is an example of a(n)
A)prediction.
B)assumption.
C)normative statement.
D)variable.
E)model.
A)prediction.
B)assumption.
C)normative statement.
D)variable.
E)model.
Unlock Deck
Unlock for access to all 147 flashcards in this deck.
Unlock Deck
k this deck
9
A positive statement is one that states
A)what is,was,or will be.
B)what is and what should be.
C)what should be but is not.
D)what is desirable.
E)non-negative numbers.
A)what is,was,or will be.
B)what is and what should be.
C)what should be but is not.
D)what is desirable.
E)non-negative numbers.
Unlock Deck
Unlock for access to all 147 flashcards in this deck.
Unlock Deck
k this deck
10
The statement that a country's rate of economic growth is positively influenced by its level of investment is an example of a(n)
A)variable.
B)definition.
C)normative statement.
D)theory.
E)economic law.
A)variable.
B)definition.
C)normative statement.
D)theory.
E)economic law.
Unlock Deck
Unlock for access to all 147 flashcards in this deck.
Unlock Deck
k this deck
11
Which of the following statements belongs more properly in the field of normative economics than positive economics?
A)An increase in the minimum wage leads to more unemployment.
B)The price of one Canadian dollar is $0.85 U.S.
C)When a drought occurs,the price of vegetables tends to rise.
D)Canadian governments should provide assistance to the auto industry.
E)Technological change has reduced the cost of cell phone service.
Unlock Deck
Unlock for access to all 147 flashcards in this deck.
Unlock Deck
k this deck
12
An assertion about the desirability of reducing unemployment by lowering payroll taxes is most likely
A)a theory.
B)a testable proposition.
C)a hypothesis.
D)a normative statement.
E)a positive statement.
A)a theory.
B)a testable proposition.
C)a hypothesis.
D)a normative statement.
E)a positive statement.
Unlock Deck
Unlock for access to all 147 flashcards in this deck.
Unlock Deck
k this deck
13
Suppose an economist tells you that,on average,people in Canada have too much personal debt.This is an example of a(n)________ statement.
A)autonomous
B)positive
C)normative
D)independent
E)induced
A)autonomous
B)positive
C)normative
D)independent
E)induced
Unlock Deck
Unlock for access to all 147 flashcards in this deck.
Unlock Deck
k this deck
14
Suppose there is a theory that several things influence the price of fish in Halifax,one of which is the weather during the fishing season.When examining the determinants of the price of fish,the weather is
A)an endogenous variable,as it influences the price of fish.
B)an exogenous variable,as it is determined outside the theory.
C)a stock,as it influences the quantity of fish caught.
D)an act of God and,therefore,has no legitimate connection with the theory.
E)an endogenous variable,as it is determined within the theory.
Unlock Deck
Unlock for access to all 147 flashcards in this deck.
Unlock Deck
k this deck
15
The statement that introducing a policy of legislated rent controls will lead to a housing shortage is an example of a(n)
A)assumption.
B)prediction.
C)theory.
D)normative statement.
E)model.
A)assumption.
B)prediction.
C)theory.
D)normative statement.
E)model.
Unlock Deck
Unlock for access to all 147 flashcards in this deck.
Unlock Deck
k this deck
16
Disagreements over positive statements
A)cannot arise because positive statements are facts.
B)are best handled by an appeal to the facts.
C)arise from the failure to distinguish between a positive and a normative statement.
D)are basically devoid of any emotion.
E)never occur.
A)cannot arise because positive statements are facts.
B)are best handled by an appeal to the facts.
C)arise from the failure to distinguish between a positive and a normative statement.
D)are basically devoid of any emotion.
E)never occur.
Unlock Deck
Unlock for access to all 147 flashcards in this deck.
Unlock Deck
k this deck
17
Choose the statement that best characterizes an economic theory.A valid theory
A)allows one to deduce a normative statement.
B)appeals to the law of large numbers.
C)generates a hypothesis that can predict future events.
D)extrapolates from the past behaviour of a variable to predict its future course.
E)allows one to prove irrefutably one's hypothesis.
A)allows one to deduce a normative statement.
B)appeals to the law of large numbers.
C)generates a hypothesis that can predict future events.
D)extrapolates from the past behaviour of a variable to predict its future course.
E)allows one to prove irrefutably one's hypothesis.
Unlock Deck
Unlock for access to all 147 flashcards in this deck.
Unlock Deck
k this deck
18
An economic theory requires,among other things,
A)a set of definitions of the variables to be considered.
B)a controlled laboratory setting in which the theory can be tested.
C)that the set of predictions be correct.
D)a set of value judgments to interpret the empirical evidence.
E)the use of endogenous variables only.
A)a set of definitions of the variables to be considered.
B)a controlled laboratory setting in which the theory can be tested.
C)that the set of predictions be correct.
D)a set of value judgments to interpret the empirical evidence.
E)the use of endogenous variables only.
Unlock Deck
Unlock for access to all 147 flashcards in this deck.
Unlock Deck
k this deck
19
Which is an example of a positive statement?
A)There should be one price for gasoline throughout Canada.
B)The higher the price for gasoline,the less of it will be consumed.
C)Substitutes for fossil fuels should be developed.
D)Canada should reduce its imports of consumer goods.
E)Corporations in Canada should pay more taxes.
A)There should be one price for gasoline throughout Canada.
B)The higher the price for gasoline,the less of it will be consumed.
C)Substitutes for fossil fuels should be developed.
D)Canada should reduce its imports of consumer goods.
E)Corporations in Canada should pay more taxes.
Unlock Deck
Unlock for access to all 147 flashcards in this deck.
Unlock Deck
k this deck
20
Choose the statement that best describes how endogenous variables differ from exogenous variables.
A)An endogenous variable is a flow,while an exogenous variable is a stock.
B)An endogenous variable is explained outside the theory and influences an exogenous variable while an exogenous variable is explained within the theory.
C)An exogenous variable is a function of the endogenous variable,and both are flow variables.
D)An endogenous variable is a function of the exogenous variable,and both are stock variables.
E)An endogenous variable is explained within the theory,while an exogenous variable influences the endogenous variables but is determined outside the theory.
Unlock Deck
Unlock for access to all 147 flashcards in this deck.
Unlock Deck
k this deck
21
Economists at the Department of Finance in Ottawa employ an economic model that predicts the effects of an increase in the GST.After implementation of the change,suppose researchers find that the empirical data is in conflict with the model's prediction.They are likely to
A)modify the prediction in light of the new evidence.
B)ignore the empirical evidence and continue using the model.
C)modify the model in light of this newly acquired empirical knowledge.
D)reject the empirical data as faulty because it did not support the theory.
E)modify the data to suit the definitions and assumptions.
Unlock Deck
Unlock for access to all 147 flashcards in this deck.
Unlock Deck
k this deck
22
Choose the answer that best explains why economists build models that abstract from the complexities of reality.
A)Because the complexities of reality are unimportant.
B)Because they believe they gain a greater understanding of reality.
C)Because economists are not interested in reality.
D)Because this allows economists to conduct controlled experiments to test their theories.
E)Because economics deals only in the abstract.
Unlock Deck
Unlock for access to all 147 flashcards in this deck.
Unlock Deck
k this deck
23
The scientific approach is central to the study of economics.In economic theory,a prediction is
A)not testable.
B)a prophesy of how the future will unfold.
C)a causal statement of the following form: A will occur because B occurred.
D)a conditional statement of the following form: if A occurs,then B will follow.
E)always based on the law of large numbers.
A)not testable.
B)a prophesy of how the future will unfold.
C)a causal statement of the following form: A will occur because B occurred.
D)a conditional statement of the following form: if A occurs,then B will follow.
E)always based on the law of large numbers.
Unlock Deck
Unlock for access to all 147 flashcards in this deck.
Unlock Deck
k this deck
24
Suppose economists at the World Bank discover a positive correlation between family income and female education levels in developing countries.We can say that
A)the correlation is inconsistent with a theory that an increase in female education levels causes an increase in family income.
B)an increase in family income causes an increase in female education levels.
C)an increase in female education levels causes an increase in family incomes.
D)there is a causal relationship between family income and female education.
E)the observed correlation is consistent with a theory that an increase in female education levels causes an increase in family income.
Unlock Deck
Unlock for access to all 147 flashcards in this deck.
Unlock Deck
k this deck
25
An economic model that contains a highly realistic set of assumptions is
A)useful because there is then very little difference between "theory" and "reality."
B)necessarily better able to predict the future.
C)certainly superior to a model whose assumptions are somewhat unrealistic.
D)more abstract than a model whose assumptions are further removed from reality.
E)not likely to be useful because of its particularized nature and its complexity.
Unlock Deck
Unlock for access to all 147 flashcards in this deck.
Unlock Deck
k this deck
26
In order to test a theory,one must
A)develop a better explanation than the one presented.
B)present a series of normative statements and positive statements.
C)use assumptions that most closely reflect reality.
D)develop normative statements from the law of large numbers.
E)confront the predictions of the theory with evidence.
A)develop a better explanation than the one presented.
B)present a series of normative statements and positive statements.
C)use assumptions that most closely reflect reality.
D)develop normative statements from the law of large numbers.
E)confront the predictions of the theory with evidence.
Unlock Deck
Unlock for access to all 147 flashcards in this deck.
Unlock Deck
k this deck
27
Suppose an individual wheat farmer's income is influenced by the region's average daily temperature.When examining the determinants of individual farmer income,the average daily temperature is a(n)________ variable.
A)endogenous
B)exogenous
C)flow
D)dependent
E)induced
A)endogenous
B)exogenous
C)flow
D)dependent
E)induced
Unlock Deck
Unlock for access to all 147 flashcards in this deck.
Unlock Deck
k this deck
28
Suppose we have data for 1000 students for a period of one year.The data show that those students who spend more hours studying have a higher grade point average (GPA).We can say that
A)if hours of study time increase,then GPA will automatically increase.
B)having a higher GPA leads students to spend more time studying.
C)there is a causal relationship between hours of study time and GPA.
D)more hours spent studying leads to a higher GPA.
E)there is a positive correlation between hours of study time and GPA.
Unlock Deck
Unlock for access to all 147 flashcards in this deck.
Unlock Deck
k this deck
29
Economics is scientific because
A)economists routinely conduct controlled experiments.
B)individual behaviour is predictable.
C)economists routinely conduct laboratory experiments.
D)economists use data.
E)economists test hypotheses by appealing to empirical evidence.
A)economists routinely conduct controlled experiments.
B)individual behaviour is predictable.
C)economists routinely conduct laboratory experiments.
D)economists use data.
E)economists test hypotheses by appealing to empirical evidence.
Unlock Deck
Unlock for access to all 147 flashcards in this deck.
Unlock Deck
k this deck
30
If we seek to explain the number of seats sold on a particular air route,say Toronto to Halifax,over a one-year period,we would consider many variables.Which of the following variables would be endogenous to our theory?
A)the average salary of Canadian airline pilots
B)the number of airline seats sold on this route
C)the price of jet fuel
D)the number of fog days in Halifax
E)the unemployment rate in Toronto
A)the average salary of Canadian airline pilots
B)the number of airline seats sold on this route
C)the price of jet fuel
D)the number of fog days in Halifax
E)the unemployment rate in Toronto
Unlock Deck
Unlock for access to all 147 flashcards in this deck.
Unlock Deck
k this deck
31
Which of the following pairs of words have similar meanings?
A)induced and autonomous
B)endogenous and autonomous
C)independent and exogenous
D)dependent and exogenous
E)induced and exogenous
A)induced and autonomous
B)endogenous and autonomous
C)independent and exogenous
D)dependent and exogenous
E)induced and exogenous
Unlock Deck
Unlock for access to all 147 flashcards in this deck.
Unlock Deck
k this deck
32
Economists build models that abstract from the complexities of reality because
A)it is easier to do so.
B)they believe they gain a greater understanding of reality.
C)economists are not interested in reality.
D)economists do not understand the real world.
E)the complexities of reality are unimportant.
A)it is easier to do so.
B)they believe they gain a greater understanding of reality.
C)economists are not interested in reality.
D)economists do not understand the real world.
E)the complexities of reality are unimportant.
Unlock Deck
Unlock for access to all 147 flashcards in this deck.
Unlock Deck
k this deck
33
A hypothesis (or a prediction)is a statement about
A)how assumptions affect theories.
B)those things which we believe to be true,but cannot prove.
C)what will certainly happen in the future.
D)the relationship between facts explained by the hypothesis.
E)how two or more variables are related to each other.
A)how assumptions affect theories.
B)those things which we believe to be true,but cannot prove.
C)what will certainly happen in the future.
D)the relationship between facts explained by the hypothesis.
E)how two or more variables are related to each other.
Unlock Deck
Unlock for access to all 147 flashcards in this deck.
Unlock Deck
k this deck
34
The scientific approach to economic inquiry involves
A)choosing data that will support the predictions.
B)using only endogenous variables in economic models.
C)testing the predictions with empirical data.
D)testing the reality of the assumptions of the model.
E)using only independent variables.
A)choosing data that will support the predictions.
B)using only endogenous variables in economic models.
C)testing the predictions with empirical data.
D)testing the reality of the assumptions of the model.
E)using only independent variables.
Unlock Deck
Unlock for access to all 147 flashcards in this deck.
Unlock Deck
k this deck
35
Choose the statement that best characterizes an economic theory.An economic theory
A)is only useful if its underlying assumptions are realistic.
B)will be useful as long as it is logically consistent.
C)must be judged on its ability to explain and predict real-world phenomena.
D)will predict more accurately if it contains a greater number of mathematical equations.
E)will be useful only if all human behaviour is rational.
Unlock Deck
Unlock for access to all 147 flashcards in this deck.
Unlock Deck
k this deck
36
Of the following,which is the most important characteristic of a successful theory?
A)The theory provides a basis for facts about economic behaviour.
B)The theory could never be refuted.
C)The theory adequately explains all economic behaviour.
D)All assumptions on which the theory is based are true.
E)The theory allows us to predict behaviour reasonably accurately.
A)The theory provides a basis for facts about economic behaviour.
B)The theory could never be refuted.
C)The theory adequately explains all economic behaviour.
D)All assumptions on which the theory is based are true.
E)The theory allows us to predict behaviour reasonably accurately.
Unlock Deck
Unlock for access to all 147 flashcards in this deck.
Unlock Deck
k this deck
37
When an economist assumes that the owners of firms are motivated only by the desire to maximize profits,the economist most likely believes that
A)all people enter business for their own selfish gain.
B)the assumption is descriptively accurate,since surveys have been taken and the owners of firms have admitted that their only objective is to maximize profits.
C)it doesn't matter whether or not the assumption is descriptively accurate; what matters is whether a theory built on the assumption predicts well.
D)the assumption is inaccurate,since surveys have been taken and the owners of firms have admitted that they care about more than just profits.
E)individuals entering business are quite narrow in their personal objectives.
Unlock Deck
Unlock for access to all 147 flashcards in this deck.
Unlock Deck
k this deck
38
Suppose economists at the World Bank develop a theory with a prediction that increased levels of foreign aid lead to increases in per capita GDP in the recipient developing countries.They find empirical evidence that is consistent with this theory.The economists are able to conclude that
A)the theory is valid,but should be subjected to continued scrutiny.
B)the theory has been proven correct.
C)the theory is always reliable.
D)the evidence is rejected by the theory.
E)the assumptions used in the theory have been proven correct.
A)the theory is valid,but should be subjected to continued scrutiny.
B)the theory has been proven correct.
C)the theory is always reliable.
D)the evidence is rejected by the theory.
E)the assumptions used in the theory have been proven correct.
Unlock Deck
Unlock for access to all 147 flashcards in this deck.
Unlock Deck
k this deck
39
Suppose a theory predicts that lowering tuition fees at Canadian universities will increase enrollment from low-income households.If empirical evidence is inconsistent with this prediction,then we
A)need to amend the theory.
B)should test the theory again.
C)should change the empirical data.
D)should increase tuition fees back to their initial level.
E)change the exogenous variables in the theory.
A)need to amend the theory.
B)should test the theory again.
C)should change the empirical data.
D)should increase tuition fees back to their initial level.
E)change the exogenous variables in the theory.
Unlock Deck
Unlock for access to all 147 flashcards in this deck.
Unlock Deck
k this deck
40
Suppose a particular theory predicts that on Monday,Wednesday,and Friday the stock market will rise and that on Tuesday and Thursday the stock market will fall.If an economist tests this theory and finds that over a six-month period the theory predicts accurately,the economist would likely say that the theory
A)has been proven correct.
B)is reliable.
C)is not in conflict with the evidence.
D)shouldn't be taken seriously.
E)is not useful because stock markets involve irrational human behaviour.
A)has been proven correct.
B)is reliable.
C)is not in conflict with the evidence.
D)shouldn't be taken seriously.
E)is not useful because stock markets involve irrational human behaviour.
Unlock Deck
Unlock for access to all 147 flashcards in this deck.
Unlock Deck
k this deck
41
The table below shows hypothetical monthly cell phone plan fees for the identical service over several years. TABLE 2-2 Refer to Table 2-2.Assume that 2015 is used as the base year,with the index number = 100.The value of the index number in 2017 is
A)100.
B)0.72.
C)72.73.
D)1.375.
E)137.5.
TABLE 2-2 Refer to Table 2-2.Assume that 2015 is used as the base year,with the index number = 100.The value of the index number in 2017 isA)100.
B)0.72.
C)72.73.
D)1.375.
E)137.5.
Unlock Deck
Unlock for access to all 147 flashcards in this deck.
Unlock Deck
k this deck
42
The table below shows hypothetical monthly cell phone plan fees for the identical service over several years. TABLE 2-2 Refer to Table 2-2.Assume that 2015 is used as the base year,with the index number = 100.What is the percentage change in the monthly fee from 2018 to 2019?
A)-28.6%
B)-10.0%
C)-71.4%
D)-25.0%
E)-35.0%
TABLE 2-2 Refer to Table 2-2.Assume that 2015 is used as the base year,with the index number = 100.What is the percentage change in the monthly fee from 2018 to 2019?A)-28.6%
B)-10.0%
C)-71.4%
D)-25.0%
E)-35.0%
Unlock Deck
Unlock for access to all 147 flashcards in this deck.
Unlock Deck
k this deck
43
For a given year,an index number of average prices across the economy (in Canada,the Consumer Price Index)is the ratio of the
A)price of several goods in the given year to that in the base year.
B)simple average price of all goods in the given year to that in the base year.
C)average price of several goods in the base year to that in the given year.
D)weighted prices of a typical bundle of goods purchased in a given year to that in the base year.
E)weighted prices of a typical bundle of goods purchased in the base year to that in the given year.
Unlock Deck
Unlock for access to all 147 flashcards in this deck.
Unlock Deck
k this deck
44
When studying economic data,and when comparing the magnitude of changes in variables with different scales it is best to
A)compare the absolute data on each variable.
B)compare the relative data on each variable.
C)express each variable as an index number.
D)express each variable as a logarithmic number.
E)use only time-series data.
A)compare the absolute data on each variable.
B)compare the relative data on each variable.
C)express each variable as an index number.
D)express each variable as a logarithmic number.
E)use only time-series data.
Unlock Deck
Unlock for access to all 147 flashcards in this deck.
Unlock Deck
k this deck
45
The table below shows hypothetical tuition costs at a Canadian university. TABLE 2-1 Refer to Table 2-1.The increase in tuition fees from 2015 to 2019 is
A)200.
B)100/5000.
C)4%.
D)0.04%.
E)200/5200.
TABLE 2-1 Refer to Table 2-1.The increase in tuition fees from 2015 to 2019 isA)200.
B)100/5000.
C)4%.
D)0.04%.
E)200/5200.
Unlock Deck
Unlock for access to all 147 flashcards in this deck.
Unlock Deck
k this deck
46
The table below shows hypothetical tuition costs at a Canadian university. TABLE 2-1 Refer to Table 2-1.Assume that 2015 is used as the base year,with the index number = 100.The value of the index number in 2019 is
A)100.
B)104.
C)1.04.
D)96.
E)0.96.
TABLE 2-1 Refer to Table 2-1.Assume that 2015 is used as the base year,with the index number = 100.The value of the index number in 2019 isA)100.
B)104.
C)1.04.
D)96.
E)0.96.
Unlock Deck
Unlock for access to all 147 flashcards in this deck.
Unlock Deck
k this deck
47
The table below shows hypothetical data for volumes of e-books and hardcover books sold over a 3-year period in a particular city. TABLE 2-3 Refer to Table 2-3.Suppose we choose Year 1 as the base year and construct a series of index numbers with which to analyze sales data.The index numbers for volumes of hardcover books sold (starting with Year 1)is
A)431; 819; 100.
B)43.1; 81.9; 100.
C)100; 81.9; 43.1.
D)100; 0.819; 0.431.
E)0.431; 0.819; 100.
TABLE 2-3 Refer to Table 2-3.Suppose we choose Year 1 as the base year and construct a series of index numbers with which to analyze sales data.The index numbers for volumes of hardcover books sold (starting with Year 1)isA)431; 819; 100.
B)43.1; 81.9; 100.
C)100; 81.9; 43.1.
D)100; 0.819; 0.431.
E)0.431; 0.819; 100.
Unlock Deck
Unlock for access to all 147 flashcards in this deck.
Unlock Deck
k this deck
48
The base year for an index number is
A)determined by the year the variable equals exactly 100.
B)dependant upon the type of data.
C)declared by the federal government.
D)chosen arbitrarily by those who construct the data series.
E)the year in which 2 or more index numbers are equal to 100.
A)determined by the year the variable equals exactly 100.
B)dependant upon the type of data.
C)declared by the federal government.
D)chosen arbitrarily by those who construct the data series.
E)the year in which 2 or more index numbers are equal to 100.
Unlock Deck
Unlock for access to all 147 flashcards in this deck.
Unlock Deck
k this deck
49
Let 1 stand for "any given period" and 2 stand for "base period." The formula of any index number can be written as
A)value of index at 1 = × 100.
B)value of index at 1 = × 100.
C)value of index at 1 = × 100.
D)value of index at 1 = .
E)value of index at 1 = .
A)value of index at 1 =
× 100.B)value of index at 1 =
× 100.C)value of index at 1 =
× 100.D)value of index at 1 =
.E)value of index at 1 =
. Unlock Deck
Unlock for access to all 147 flashcards in this deck.
Unlock Deck
k this deck
50
An index number expresses the value of a variable in any given period
A)as a percentage of its value in the base period.
B)as a weighted average.
C)as a proportional weighted average.
D)as an average of its value in the base period.
E)as an absolute compared to the base period.
A)as a percentage of its value in the base period.
B)as a weighted average.
C)as a proportional weighted average.
D)as an average of its value in the base period.
E)as an absolute compared to the base period.
Unlock Deck
Unlock for access to all 147 flashcards in this deck.
Unlock Deck
k this deck
51
When studying economic data,index numbers are especially valuable when comparing
A)relative movements in different variables measured in different units.
B)relative movements in real and nominal variables.
C)linear and logarithmic data.
D)time-series data with cross-sectional data.
E)government data with private-sector data.
A)relative movements in different variables measured in different units.
B)relative movements in real and nominal variables.
C)linear and logarithmic data.
D)time-series data with cross-sectional data.
E)government data with private-sector data.
Unlock Deck
Unlock for access to all 147 flashcards in this deck.
Unlock Deck
k this deck
52
The table below shows hypothetical monthly cell phone plan fees for the identical service over several years. TABLE 2-2 Refer to Table 2-2.Assume that 2015 is used as the base year,with the index number = 100.The value of the index number in 2018 is calculated as follows:
A)(35/100)× 100 = 35.
B)35/55 = 0.64.
C)55/35 = 1.57.
D)(35/55)× 100 = 63.64.
E)(55/35)× 100 = 157.14.
TABLE 2-2 Refer to Table 2-2.Assume that 2015 is used as the base year,with the index number = 100.The value of the index number in 2018 is calculated as follows:A)(35/100)× 100 = 35.
B)35/55 = 0.64.
C)55/35 = 1.57.
D)(35/55)× 100 = 63.64.
E)(55/35)× 100 = 157.14.
Unlock Deck
Unlock for access to all 147 flashcards in this deck.
Unlock Deck
k this deck
53
The table below shows hypothetical monthly cell phone plan fees for the identical service over several years. TABLE 2-2 Refer to Table 2-2.Assume that 2015 is used as the base year,with the index number = 100.Which of the following series is the correct set of index numbers for the monthly cell phone charges from 2015 to 2019?
A)0.55; 0.50; 0.40; 0.35; 0.25
B)100; 91; 73; 64; 45
C)55; 50; 40; 35; 25
D)1.0; 0.91; 0.73; 0.64; 0.45
E)100%; 91%; 73%; 64%; 45%
TABLE 2-2 Refer to Table 2-2.Assume that 2015 is used as the base year,with the index number = 100.Which of the following series is the correct set of index numbers for the monthly cell phone charges from 2015 to 2019?A)0.55; 0.50; 0.40; 0.35; 0.25
B)100; 91; 73; 64; 45
C)55; 50; 40; 35; 25
D)1.0; 0.91; 0.73; 0.64; 0.45
E)100%; 91%; 73%; 64%; 45%
Unlock Deck
Unlock for access to all 147 flashcards in this deck.
Unlock Deck
k this deck
54
The table below shows hypothetical tuition costs at a Canadian university. TABLE 2-1 Refer to Table 2-1.Assume that 2017 is used as the base year,with the index number = 100.The value of the index number in 2015 is calculated as follows:
A)5000/5100 = 0.98.
B)(5100/5000)× 100 = 102.
C)5100/5000 = 1.02.
D)5100/5100 = 100.
E)(5000/5100)× 100 = 98.
TABLE 2-1 Refer to Table 2-1.Assume that 2017 is used as the base year,with the index number = 100.The value of the index number in 2015 is calculated as follows:A)5000/5100 = 0.98.
B)(5100/5000)× 100 = 102.
C)5100/5000 = 1.02.
D)5100/5100 = 100.
E)(5000/5100)× 100 = 98.
Unlock Deck
Unlock for access to all 147 flashcards in this deck.
Unlock Deck
k this deck
55
If a theory's prediction is tested and is in conflict with the evidence,
A)the original data and assumptions should be discarded.
B)it is rejected with certainty,because it is not possible to reject a hypothesis that is actually true.
C)the statistical tolerance of risk for accepting a false hypothesis should be increased.
D)inquiry into the matter should cease.
E)a new hypothesis is usually suggested and tested.
Unlock Deck
Unlock for access to all 147 flashcards in this deck.
Unlock Deck
k this deck
56
Most economists believe that economic analysis ________ be made completely free of judgement,in part because it is ________ to absolutely refute a theory on the basis of factual evidence.
A)can; possible
B)can; impossible
C)cannot; possible
D)cannot; impossible
E)will; necessary
A)can; possible
B)can; impossible
C)cannot; possible
D)cannot; impossible
E)will; necessary
Unlock Deck
Unlock for access to all 147 flashcards in this deck.
Unlock Deck
k this deck
57
The table below shows hypothetical monthly cell phone plan fees for the identical service over several years. TABLE 2-2 Refer to Table 2-2.Assume that 2015 is used as the base year,with the index number = 100.The value of the index number in 2019 is
A)0.25.
B)2.5.
C)25.0.
D)0.45.
E)45.45.
TABLE 2-2 Refer to Table 2-2.Assume that 2015 is used as the base year,with the index number = 100.The value of the index number in 2019 isA)0.25.
B)2.5.
C)25.0.
D)0.45.
E)45.45.
Unlock Deck
Unlock for access to all 147 flashcards in this deck.
Unlock Deck
k this deck
58
The table below shows hypothetical tuition costs at a Canadian university. TABLE 2-1 Refer to Table 2-1.Assume that 2015 is used as the base year,with the index number = 100.The value of the index number in 2017 is calculated as follows:
A)(5000/5100)× 100 = 98.
B)5100/5000 = 1.02.
C)5000/5100 = 0.98.
D)5100/5100 = 100.
E)(5100/5000)× 100 = 102.
TABLE 2-1 Refer to Table 2-1.Assume that 2015 is used as the base year,with the index number = 100.The value of the index number in 2017 is calculated as follows:A)(5000/5100)× 100 = 98.
B)5100/5000 = 1.02.
C)5000/5100 = 0.98.
D)5100/5100 = 100.
E)(5100/5000)× 100 = 102.
Unlock Deck
Unlock for access to all 147 flashcards in this deck.
Unlock Deck
k this deck
59
The table below shows hypothetical data for volumes of e-books and hardcover books sold over a 3-year period in a particular city. TABLE 2-3 Refer to Table 2-3.Suppose we choose Year 1 as the base year and construct a series of index numbers with which to analyze the sales data.The index numbers for volumes of e-books sold (starting with Year 1)is
A)100; 44.2; 21.7.
B)100; 226.1; 460.9.
C)23 000; 52 000; 106 000.
D)100; 126.1; 360.1.
E)1; 0.442; 0.217.
TABLE 2-3 Refer to Table 2-3.Suppose we choose Year 1 as the base year and construct a series of index numbers with which to analyze the sales data.The index numbers for volumes of e-books sold (starting with Year 1)isA)100; 44.2; 21.7.
B)100; 226.1; 460.9.
C)23 000; 52 000; 106 000.
D)100; 126.1; 360.1.
E)1; 0.442; 0.217.
Unlock Deck
Unlock for access to all 147 flashcards in this deck.
Unlock Deck
k this deck
60
When testing theories,economics is disadvantaged compared to the natural sciences because
A)it deals with human behaviour and thus is not open to empirical testing.
B)it is usually not possible to conduct controlled experiments in economics,in contrast with certain other sciences.
C)economic hypotheses cannot be accepted with complete certainty,by contrast with the other sciences.
D)economic variables do not change enough to provide reliable data for testing hypotheses.
E)some economic variables are determined within the theory.
Unlock Deck
Unlock for access to all 147 flashcards in this deck.
Unlock Deck
k this deck
61
The table below shows hypothetical data for the volume of gold and nickel output across several years. TABLE 2-5 Refer to Table 2-5.What is the index number for nickel output in Year 6?
A)108.2
B)105.3
C)110.7
D)95.0
E)95.0%
TABLE 2-5 Refer to Table 2-5.What is the index number for nickel output in Year 6?A)108.2
B)105.3
C)110.7
D)95.0
E)95.0%
Unlock Deck
Unlock for access to all 147 flashcards in this deck.
Unlock Deck
k this deck
62
The table below shows hypothetical prices for a particular anatomy textbook at a university bookstore over several years. TABLE 2-4 Refer to Table 2-4.The increase in the price of the textbook from 2015 to 2019 is
A)-40.
B)40.
C)18.2%.
D)22.2%.
E)40%.
TABLE 2-4 Refer to Table 2-4.The increase in the price of the textbook from 2015 to 2019 isA)-40.
B)40.
C)18.2%.
D)22.2%.
E)40%.
Unlock Deck
Unlock for access to all 147 flashcards in this deck.
Unlock Deck
k this deck
63
The table below shows hypothetical data for the volume of gold and nickel output across several years. TABLE 2-5 Refer to Table 2-5.What is the index number for gold output in Year 8?
A)111.9
B)111.9%
C)11.9
D)11.9%
E)1.119
TABLE 2-5 Refer to Table 2-5.What is the index number for gold output in Year 8?A)111.9
B)111.9%
C)11.9
D)11.9%
E)1.119
Unlock Deck
Unlock for access to all 147 flashcards in this deck.
Unlock Deck
k this deck
64
The table below shows hypothetical data for the volume of gold and nickel output across several years. TABLE 2-6 Refer to Table 2-6.What is the percentage change in gold output from Year 1 to Year 7?
A)17.9%
B)84.8%
C)15.2%
D)-15.2%
E)0.152%
TABLE 2-6 Refer to Table 2-6.What is the percentage change in gold output from Year 1 to Year 7?A)17.9%
B)84.8%
C)15.2%
D)-15.2%
E)0.152%
Unlock Deck
Unlock for access to all 147 flashcards in this deck.
Unlock Deck
k this deck
65
The table below shows hypothetical data for the volume of gold and nickel output across several years. TABLE 2-5 Refer to Table 2-5.What is the index number for gold output in Year 1?
A)0.91
B)109.7
C)1.097
D)91.2
E)99.7
TABLE 2-5 Refer to Table 2-5.What is the index number for gold output in Year 1?A)0.91
B)109.7
C)1.097
D)91.2
E)99.7
Unlock Deck
Unlock for access to all 147 flashcards in this deck.
Unlock Deck
k this deck
66
The table below shows the approximate value of Canada's crude oil and natural gas exports over a 5-year period.The amounts shown are billions of dollars. TABLE 2-7 Refer to Table 2-7.Assume that 2013 is the base year,with an index number = 100.What is the index number for the value of natural gas exports in 2017?
A)0.912
B)92.0
C)92.0%
D)1.09
E)109.7
TABLE 2-7 Refer to Table 2-7.Assume that 2013 is the base year,with an index number = 100.What is the index number for the value of natural gas exports in 2017?A)0.912
B)92.0
C)92.0%
D)1.09
E)109.7
Unlock Deck
Unlock for access to all 147 flashcards in this deck.
Unlock Deck
k this deck
67
The table below shows the approximate value of Canada's crude oil and natural gas exports over a 5-year period.The amounts shown are billions of dollars. TABLE 2-7 Refer to Table 2-7.Assume that 2013 is the base year,with an index number = 100.What is the index number for the value of crude oil exports in 2017?
A)1.22
B)122.4
C)122.4%
D)0.817
E)81.7
TABLE 2-7 Refer to Table 2-7.Assume that 2013 is the base year,with an index number = 100.What is the index number for the value of crude oil exports in 2017?A)1.22
B)122.4
C)122.4%
D)0.817
E)81.7
Unlock Deck
Unlock for access to all 147 flashcards in this deck.
Unlock Deck
k this deck
68
The table below shows hypothetical data for the volume of gold and nickel output across several years. TABLE 2-5 Refer to Table 2-5.What is the index number for nickel output in Year 2?
A)98.4%
B)98.4
C)-72.0%
D)72.0%
E)0.984%
TABLE 2-5 Refer to Table 2-5.What is the index number for nickel output in Year 2?A)98.4%
B)98.4
C)-72.0%
D)72.0%
E)0.984%
Unlock Deck
Unlock for access to all 147 flashcards in this deck.
Unlock Deck
k this deck
69
The table below shows hypothetical prices for a particular anatomy textbook at a university bookstore over several years. TABLE 2-4 Refer to Table 2-4.Assume that 2015 is used as the base year,with the index number = 100.The value of the index number in 2017 is
A)0.878.
B)1.0.
C)1.139.
D)87.8.
E)113.9.
TABLE 2-4 Refer to Table 2-4.Assume that 2015 is used as the base year,with the index number = 100.The value of the index number in 2017 isA)0.878.
B)1.0.
C)1.139.
D)87.8.
E)113.9.
Unlock Deck
Unlock for access to all 147 flashcards in this deck.
Unlock Deck
k this deck
70
The table below shows hypothetical prices for a particular anatomy textbook at a university bookstore over several years. TABLE 2-4 Refer to Table 2-4.Assume that 2015 is used as the base year,with the index number = 100.The value of the index number in 2018 is calculated as follows:
A)215/180 = 1.194.
B)180/215 = 0.837.
C)(215/180)× 100 = 119.4.
D)(180/215)× 100 = 83.7.
E)(215 - 180)= 35.
TABLE 2-4 Refer to Table 2-4.Assume that 2015 is used as the base year,with the index number = 100.The value of the index number in 2018 is calculated as follows:A)215/180 = 1.194.
B)180/215 = 0.837.
C)(215/180)× 100 = 119.4.
D)(180/215)× 100 = 83.7.
E)(215 - 180)= 35.
Unlock Deck
Unlock for access to all 147 flashcards in this deck.
Unlock Deck
k this deck
71
The table below shows the approximate value of Canada's crude oil and natural gas exports over a 5-year period.The amounts shown are billions of dollars. TABLE 2-7 Refer to Table 2-7.Assume that 2013 is the base year,with an index number = 100.What is the index number for the value of crude oil exports in 2016?
A)1.64
B)164.1
C)60.9
D)0.609
E)60.9%
TABLE 2-7 Refer to Table 2-7.Assume that 2013 is the base year,with an index number = 100.What is the index number for the value of crude oil exports in 2016?A)1.64
B)164.1
C)60.9
D)0.609
E)60.9%
Unlock Deck
Unlock for access to all 147 flashcards in this deck.
Unlock Deck
k this deck
72
The table below shows hypothetical data for volumes of e-books and hardcover books sold over a 3-year period in a particular city. TABLE 2-3 Refer to Table 2-3.Between Year 1 and Year 3,what is the percentage change in sales of e-books?
A)83 000%
B)460.9%
C)360.9%
D)21.7%
E)83%
TABLE 2-3 Refer to Table 2-3.Between Year 1 and Year 3,what is the percentage change in sales of e-books?A)83 000%
B)460.9%
C)360.9%
D)21.7%
E)83%
Unlock Deck
Unlock for access to all 147 flashcards in this deck.
Unlock Deck
k this deck
73
The table below shows the approximate value of Canada's crude oil and natural gas exports over a 5-year period.The amounts shown are billions of dollars. TABLE 2-7 Refer to Table 2-7.Assume that 2013 is the base year,with an index number = 100.What is the index number for the value of natural gas exports in 2016?
A)0.109
B)108.7%
C)108.7
D)78.6
E)0.786
TABLE 2-7 Refer to Table 2-7.Assume that 2013 is the base year,with an index number = 100.What is the index number for the value of natural gas exports in 2016?A)0.109
B)108.7%
C)108.7
D)78.6
E)0.786
Unlock Deck
Unlock for access to all 147 flashcards in this deck.
Unlock Deck
k this deck
74
The table below shows hypothetical data for volumes of e-books and hardcover books sold over a 3-year period in a particular city. TABLE 2-3 Refer to Table 2-3.Between Year 1 and Year 3,what is the percentage change in sales of hardcover books?
A)0.569%
B)56.9%
C)-56.9%
D)-0.569%
E)-569%
TABLE 2-3 Refer to Table 2-3.Between Year 1 and Year 3,what is the percentage change in sales of hardcover books?A)0.569%
B)56.9%
C)-56.9%
D)-0.569%
E)-569%
Unlock Deck
Unlock for access to all 147 flashcards in this deck.
Unlock Deck
k this deck
75
The table below shows hypothetical prices for a particular anatomy textbook at a university bookstore over several years. TABLE 2-4 Refer to Table 2-4.Assume that 2019 is used as the base year,with the index number = 100.The value of the index number in 2015 is
A)0.818.
B)1.0.
C)1.222.
D)81.8.
E)122.2.
TABLE 2-4 Refer to Table 2-4.Assume that 2019 is used as the base year,with the index number = 100.The value of the index number in 2015 isA)0.818.
B)1.0.
C)1.222.
D)81.8.
E)122.2.
Unlock Deck
Unlock for access to all 147 flashcards in this deck.
Unlock Deck
k this deck
76
The table below shows hypothetical data for the volume of gold and nickel output across several years. TABLE 2-6 Refer to Table 2-6.What is the index number for gold output in Year 8?
A)104.1%
B)104.1
C)1.04
D)60
E)60%
TABLE 2-6 Refer to Table 2-6.What is the index number for gold output in Year 8?A)104.1%
B)104.1
C)1.04
D)60
E)60%
Unlock Deck
Unlock for access to all 147 flashcards in this deck.
Unlock Deck
k this deck
77
The table below shows hypothetical data for the volume of gold and nickel output across several years. TABLE 2-6 Refer to Table 2-6.What is the index number for nickel output in Year 3?
A)92.4%
B)-379
C)379
D)0.924%
E)92.4
TABLE 2-6 Refer to Table 2-6.What is the index number for nickel output in Year 3?A)92.4%
B)-379
C)379
D)0.924%
E)92.4
Unlock Deck
Unlock for access to all 147 flashcards in this deck.
Unlock Deck
k this deck
78
The table below shows hypothetical data for the volume of gold and nickel output across several years. TABLE 2-6 Refer to Table 2-6.What is the index number for gold output in Year 2?
A)97.7%
B)0.977
C)-3.4%
D)97.7
E)-34%
TABLE 2-6 Refer to Table 2-6.What is the index number for gold output in Year 2?A)97.7%
B)0.977
C)-3.4%
D)97.7
E)-34%
Unlock Deck
Unlock for access to all 147 flashcards in this deck.
Unlock Deck
k this deck
79
The table below shows the approximate value of Canada's crude oil and natural gas exports over a 5-year period.The amounts shown are billions of dollars. TABLE 2-7 Refer to Table 2-7.Assume that 2013 is the base year,with an index number = 100.What is the percentage change in the value of exports of crude oil from 2013 to 2017?
A)-18.3%
B)-183.2%
C)-100%
D)18.3%
E)183.2%
TABLE 2-7 Refer to Table 2-7.Assume that 2013 is the base year,with an index number = 100.What is the percentage change in the value of exports of crude oil from 2013 to 2017?A)-18.3%
B)-183.2%
C)-100%
D)18.3%
E)183.2%
Unlock Deck
Unlock for access to all 147 flashcards in this deck.
Unlock Deck
k this deck
80
The table below shows hypothetical data for the volume of gold and nickel output across several years. TABLE 2-6 Refer to Table 2-6.What is the index number for nickel output in Year 5?
A)-200
B)-200%
C)96
D)0.96%
E)96%
TABLE 2-6 Refer to Table 2-6.What is the index number for nickel output in Year 5?A)-200
B)-200%
C)96
D)0.96%
E)96%
Unlock Deck
Unlock for access to all 147 flashcards in this deck.
Unlock Deck
k this deck
Unlock Deck
Unlock for access to all 147 flashcards in this deck.


