Deck 31: Government Debt and Deficits
Full screen (f)
Question
Question
Question
Question
Question
Question
Question
Question
Question
Question
Question
Question
Question
Question
Question
Question
Question
Question
Question
Question
Question
Question
The table below shows government purchases G), net tax revenues T), and debt-service payments iD) over a 4-year period for a hypothetical economy. All figures are in billions of dollars. Assume the stock of debt at the end of 2012 is $500 billion. 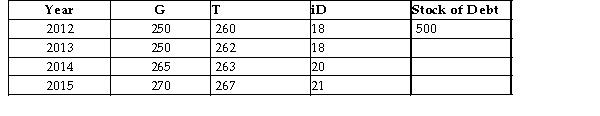 TABLE 31-1
Refer to Table 31.1. What is the budget deficit in 2012?
A) $18 billion
B) -$8 billion
C) $8 billion.
D) -$10 billion
E) $10 billion
TABLE 31-1Refer to Table 31.1. What is the budget deficit in 2012?
A) $18 billion
B) -$8 billion
C) $8 billion.
D) -$10 billion
E) $10 billion
Question
The table below shows government purchases G), net tax revenues T), and debt-service payments iD) over a 4-year period for a hypothetical economy. All figures are in billions of dollars. Assume the stock of debt at the end of 2012 is $500 billion. TABLE 31-1
Refer to Table 31.1. What is the primary budget deficit in 2014?
A) $22 billion
B) -$22 billion
C) $21 billion
D) $2 billion
E) -$2 billion
TABLE 31-1Refer to Table 31.1. What is the primary budget deficit in 2014?
A) $22 billion
B) -$22 billion
C) $21 billion
D) $2 billion
E) -$2 billion
Question
Question
Question
Question
The table below shows government purchases G), net tax revenues T), and debt-service payments iD) over a 4-year period for a hypothetical economy. All figures are in billions of dollars. Assume the stock of debt at the end of 2012 is $500 billion. TABLE 31-1
The Canadian federal debt-to-GDP ratio reached a post Second World War high of about % in 1996. By 2015/2016, the debt-to GDP ratio was forecast to be about %.
A) 80; 110
B) 50; 0
C) 40; 10
D) 110; 50
E) 70; 30
TABLE 31-1The Canadian federal debt-to-GDP ratio reached a post Second World War high of about % in 1996. By 2015/2016, the debt-to GDP ratio was forecast to be about %.
A) 80; 110
B) 50; 0
C) 40; 10
D) 110; 50
E) 70; 30
Question
The table below shows government purchases G), net tax revenues T), and debt-service payments iD) over a 4-year period for a hypothetical economy. All figures are in billions of dollars. Assume the stock of debt at the end of 2012 is $500 billion. TABLE 31-1
Refer to Table 31.1. What is the stock of debt at the end of 2015?
A) $494 billion
B) $500 billion
C) $506 billion
D) $528 billion
E) $552 billion
TABLE 31-1Refer to Table 31.1. What is the stock of debt at the end of 2015?
A) $494 billion
B) $500 billion
C) $506 billion
D) $528 billion
E) $552 billion
Question
The table below shows government purchases G), net tax revenues T), and debt-service payments iD) over a 4-year period for a hypothetical economy. All figures are in billions of dollars. Assume the stock of debt at the end of 2012 is $500 billion. TABLE 31-1
Refer to Table 31.1. What is the primary budget deficit in 2013?
A) -$12 billion
B) $12 billion
C) -$6 billion
D) $6 billion
E) There is no primary budget deficit.
TABLE 31-1Refer to Table 31.1. What is the primary budget deficit in 2013?
A) -$12 billion
B) $12 billion
C) -$6 billion
D) $6 billion
E) There is no primary budget deficit.
Question
Question
The table below shows government purchases G), net tax revenues T), and debt-service payments iD) over a 4-year period for a hypothetical economy. All figures are in billions of dollars. Assume the stock of debt at the end of 2012 is $500 billion. TABLE 31-1
The Canadian federal governmentʹs debt-to-GDP ratio climbed steadily from
A) 1939 to the late 1980s.
B) 1960 to the late 1990s.
C) 1975 to the mid 1990s.
D) 1995 to 2009.
E) 2000 to 2015.
TABLE 31-1The Canadian federal governmentʹs debt-to-GDP ratio climbed steadily from
A) 1939 to the late 1980s.
B) 1960 to the late 1990s.
C) 1975 to the mid 1990s.
D) 1995 to 2009.
E) 2000 to 2015.
Question
The table below shows government purchases G), net tax revenues T), and debt-service payments iD) over a 4-year period for a hypothetical economy. All figures are in billions of dollars. Assume the stock of debt at the end of 2012 is $500 billion. TABLE 31-1
Refer to Table 31.1. What is the budget deficit in 2015?
A) -$24 billion
B) $24 billion
C) -$3 billion
D) $3 billion
E) $21 billion
TABLE 31-1Refer to Table 31.1. What is the budget deficit in 2015?
A) -$24 billion
B) $24 billion
C) -$3 billion
D) $3 billion
E) $21 billion
Question
Question
The table below shows government purchases G), net tax revenues T), and debt-service payments iD) over a 4-year period for a hypothetical economy. All figures are in billions of dollars. Assume the stock of debt at the end of 2012 is $500 billion. TABLE 31-1
Consider two economies, A and B. Economy A has a stock of government debt equal to $800 billion and a
Debt-to-GDP ratio of 10%. Economy B has a stock of government debt equal to $22 billion and a debt -to-GDP ratio of 80%. What is the GDP for each economy?
A) Economy A: GDP = $8 trillion Economy B: GDP = $27.5 billion
B) Economy A: GDP = $80 billion Economy B: GDP = $18.7 billion
C) Economy A: GDP = $80 trillion Economy B: GDP = $275 billion
D) Economy A: GDP = $800 billion Economy B: GDP = $22 billion
E) Economy A: GDP = $8 trillion Economy B: GDP = $2.75 billion
TABLE 31-1Consider two economies, A and B. Economy A has a stock of government debt equal to $800 billion and a
Debt-to-GDP ratio of 10%. Economy B has a stock of government debt equal to $22 billion and a debt -to-GDP ratio of 80%. What is the GDP for each economy?
A) Economy A: GDP = $8 trillion Economy B: GDP = $27.5 billion
B) Economy A: GDP = $80 billion Economy B: GDP = $18.7 billion
C) Economy A: GDP = $80 trillion Economy B: GDP = $275 billion
D) Economy A: GDP = $800 billion Economy B: GDP = $22 billion
E) Economy A: GDP = $8 trillion Economy B: GDP = $2.75 billion
Question
Question
Question
The table below shows government purchases G), net tax revenues T), and debt-service payments iD) over a 4-year period for a hypothetical economy. All figures are in billions of dollars. Assume the stock of debt at the end of 2012 is $500 billion. TABLE 31-1
The Canadian federal governmentʹs net debt as a percentage of GDP reached a historic high of
A) 70% in 1996 due to large and persistent deficits throughout the 1970s.
B) 70% in 1982 due to the OPEC oil shock in the mid 1970s and the severe inflation that followed.
C) 110% in 1946 as a result of Canadaʹs participation in the Second World War.
D) 52% in 2012 due to the fiscal expansion following the global financial crisis.
E) 90% in the late 1960s due to massive infrastructure projects in progress across Canada.
TABLE 31-1The Canadian federal governmentʹs net debt as a percentage of GDP reached a historic high of
A) 70% in 1996 due to large and persistent deficits throughout the 1970s.
B) 70% in 1982 due to the OPEC oil shock in the mid 1970s and the severe inflation that followed.
C) 110% in 1946 as a result of Canadaʹs participation in the Second World War.
D) 52% in 2012 due to the fiscal expansion following the global financial crisis.
E) 90% in the late 1960s due to massive infrastructure projects in progress across Canada.
Question
Question
The table below shows government purchases G), net tax revenues T), and debt-service payments iD) over a 4-year period for a hypothetical economy. All figures are in billions of dollars. Assume the stock of debt at the end of 2012 is $500 billion. TABLE 31-1
Refer to Table 31.1. What is the stock of debt at the end of 2013?
A) $488 billion
B) $494 billion
C) $500 billion
D) $506 billion
E) $512 billion
TABLE 31-1Refer to Table 31.1. What is the stock of debt at the end of 2013?
A) $488 billion
B) $494 billion
C) $500 billion
D) $506 billion
E) $512 billion
Question
Question
The diagram below shows the budget deficit function for a government in a hypothetical economy.
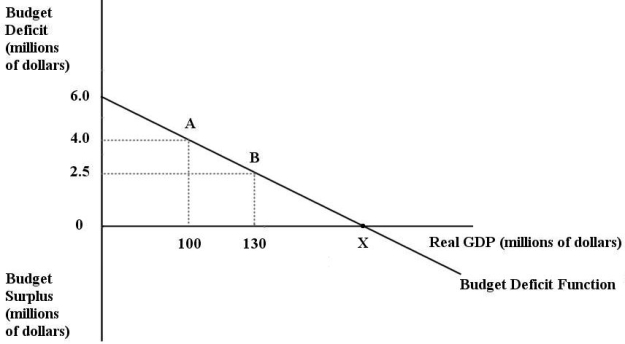 FIGURE 31-1
Refer to Figure 31-1. Initially, suppose real GDP is $100 million and the budget deficit is $4 million, as shown by point A on the graph. Which of the following is consistent with a move from point A to point B?
A) implementation of an expansionary fiscal policy
B) implementation of a contractionary fiscal policy
C) implementation of a contractionary monetary policy
D) the economy entering into a recession
E) the economy entering into a boom
FIGURE 31-1Refer to Figure 31-1. Initially, suppose real GDP is $100 million and the budget deficit is $4 million, as shown by point A on the graph. Which of the following is consistent with a move from point A to point B?
A) implementation of an expansionary fiscal policy
B) implementation of a contractionary fiscal policy
C) implementation of a contractionary monetary policy
D) the economy entering into a recession
E) the economy entering into a boom
Question
Question
The diagram below shows two budget deficit functions for a hypothetical economy.
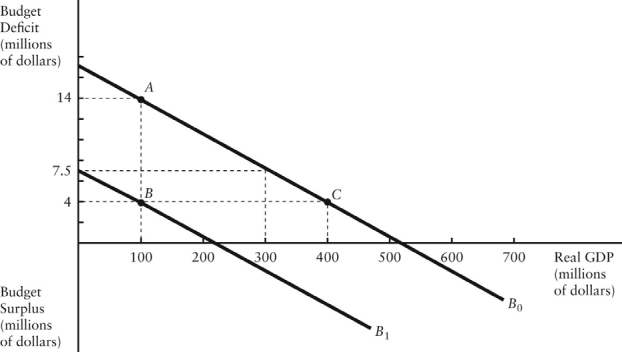 FIGURE 31-2
Refer to Figure 31-2. Initially, suppose the economy is at point A. If the government were to then implement a fiscal expansion, the structural budget deficit would be
A) $4 million.
B) $6 million.
C) $7 million.
D) $10 million.
E) Insufficient information to know.
FIGURE 31-2Refer to Figure 31-2. Initially, suppose the economy is at point A. If the government were to then implement a fiscal expansion, the structural budget deficit would be
A) $4 million.
B) $6 million.
C) $7 million.
D) $10 million.
E) Insufficient information to know.
Question
Question
The diagram below shows the budget deficit function for a government in a hypothetical economy.
FIGURE 31-1
Refer to Figure 31-1. Initially, suppose real GDP is $100 million and the budget deficit is $4 million, as shown by point A. If the government implements a contractionary fiscal policy by decreasing its purchases of goods and services, then
A) the budget deficit function would shift up.
B) the budget deficit function would shift down.
C) the budget deficit function would become steeper.
D) the budget deficit function would become flatter.
E) the size of the budget deficit would decrease as we move from point A to point B.
FIGURE 31-1Refer to Figure 31-1. Initially, suppose real GDP is $100 million and the budget deficit is $4 million, as shown by point A. If the government implements a contractionary fiscal policy by decreasing its purchases of goods and services, then
A) the budget deficit function would shift up.
B) the budget deficit function would shift down.
C) the budget deficit function would become steeper.
D) the budget deficit function would become flatter.
E) the size of the budget deficit would decrease as we move from point A to point B.
Question
The diagram below shows the budget deficit function for a government in a hypothetical economy.
FIGURE 31-1
Refer to Figure 31-1. Initially, suppose real GDP is $100 million and the budget deficit is $4 million, as shown by point A. If the government implements an expansionary fiscal policy by increasing its purchases of goods and services, then
A) the budget deficit function would shift down.
B) the budget deficit function would become steeper.
C) the budget deficit function would become flatter.
D) the budget deficit function would shift up.
E) the size of the budget deficit would decrease as we move from point A to point B.
FIGURE 31-1Refer to Figure 31-1. Initially, suppose real GDP is $100 million and the budget deficit is $4 million, as shown by point A. If the government implements an expansionary fiscal policy by increasing its purchases of goods and services, then
A) the budget deficit function would shift down.
B) the budget deficit function would become steeper.
C) the budget deficit function would become flatter.
D) the budget deficit function would shift up.
E) the size of the budget deficit would decrease as we move from point A to point B.
Question
The diagram below shows two budget deficit functions for a hypothetical economy.
FIGURE 31-2
Refer to Figure 31-2. Initially, suppose the economy is at point A on budget deficit function B0. Real GDP Y) is
$100 million. If the level of potential output Y*)were $300 million, the structural budget deficit would be
A) $2 million.
B) $14 million.
C) measured by the vertical distance between the horizontal axis and B0 at real GDP = 300).
D) measured by the vertical distance between point A and the budget deficit that would exist at real GDP = 300 million.
E) Insufficient information to know.
FIGURE 31-2Refer to Figure 31-2. Initially, suppose the economy is at point A on budget deficit function B0. Real GDP Y) is
$100 million. If the level of potential output Y*)were $300 million, the structural budget deficit would be
A) $2 million.
B) $14 million.
C) measured by the vertical distance between the horizontal axis and B0 at real GDP = 300).
D) measured by the vertical distance between point A and the budget deficit that would exist at real GDP = 300 million.
E) Insufficient information to know.
Question
Question
Question
The diagram below shows two budget deficit functions for a hypothetical economy.
FIGURE 31-2
Refer to Figure 31-2. Initially, suppose real GDP is $100 million and the budget deficit is $14 million, as shown by point A. Which of the following events could result in a move from point A to point B?
A) the implementation of an expansionary fiscal policy
B) the implementation of a contractionary fiscal policy
C) the implementation of an expansionary monetary policy
D) the implementation of a contractionary monetary policy
E) the economy entering into a boom
FIGURE 31-2Refer to Figure 31-2. Initially, suppose real GDP is $100 million and the budget deficit is $14 million, as shown by point A. Which of the following events could result in a move from point A to point B?
A) the implementation of an expansionary fiscal policy
B) the implementation of a contractionary fiscal policy
C) the implementation of an expansionary monetary policy
D) the implementation of a contractionary monetary policy
E) the economy entering into a boom
Question
Question
The diagram below shows two budget deficit functions for a hypothetical economy.
FIGURE 31-2
Refer to Figure 31-2. Initially, suppose real GDP is $100 million and the budget deficit is $14 million, as shown by point A. Which of the following events could result in a move from point A to point C?
A) a fiscal expansion and an increase in GDP
B) a fiscal contraction and an increase in GDP
C) a fiscal expansion and a decrease in GDP
D) a fiscal contraction and a decrease in GDP
E) an increase in GDP with no change in fiscal policy
FIGURE 31-2Refer to Figure 31-2. Initially, suppose real GDP is $100 million and the budget deficit is $14 million, as shown by point A. Which of the following events could result in a move from point A to point C?
A) a fiscal expansion and an increase in GDP
B) a fiscal contraction and an increase in GDP
C) a fiscal expansion and a decrease in GDP
D) a fiscal contraction and a decrease in GDP
E) an increase in GDP with no change in fiscal policy
Question
The table below shows government purchases G), net tax revenues T), and debt-service payments iD) over a 4-year period for a hypothetical economy. All figures are in billions of dollars. Assume the stock of debt at the end of 2012 is $500 billion. TABLE 31-1
In every year between 1998 and 2008, the Canadian federal government had a
A) budget deficit, indicating that even deep cuts in government spending were not sufficient to alleviate the problem.
B) primary deficit, indicating that tax revenues were insufficient to cover discretionary government expenditures.
C) budget deficit, which contributed to a growing stock of government debt.
D) primary surplus but overall deficit, indicating that tax revenues were more than sufficient to cover discretionary government expenditures.
E) budget surplus, indicating that tax revenues were more than sufficient to cover total government expenditures.
TABLE 31-1In every year between 1998 and 2008, the Canadian federal government had a
A) budget deficit, indicating that even deep cuts in government spending were not sufficient to alleviate the problem.
B) primary deficit, indicating that tax revenues were insufficient to cover discretionary government expenditures.
C) budget deficit, which contributed to a growing stock of government debt.
D) primary surplus but overall deficit, indicating that tax revenues were more than sufficient to cover discretionary government expenditures.
E) budget surplus, indicating that tax revenues were more than sufficient to cover total government expenditures.
Question
The diagram below shows the budget deficit function for a government in a hypothetical economy.
FIGURE 31-1
Refer to Figure 31-1. For the given budget deficit function in the diagram, the government will have a budget surplus if
1) real GDP increases beyond $X million
2) the interest rate on government debt decreases
3) government expenditure decreases
A) 1 only
B) 2 only
C) 3 only
D) 1 or 2 or 3
E) 2 or 3 only
FIGURE 31-1Refer to Figure 31-1. For the given budget deficit function in the diagram, the government will have a budget surplus if
1) real GDP increases beyond $X million
2) the interest rate on government debt decreases
3) government expenditure decreases
A) 1 only
B) 2 only
C) 3 only
D) 1 or 2 or 3
E) 2 or 3 only
Question
Question
Question
Question
Question
The table below shows government purchases G), net tax revenues T), and debt-service payments iD) over a 4-year period for a hypothetical economy. All figures are in billions of dollars. Assume the stock of debt at the end of 2012 is $500 billion. TABLE 31-1
The Canadian federal government had a budget surplus each year from until 2008.
A) 1945
B) 1967
C) 1987
D) 1998
E) 2000
TABLE 31-1The Canadian federal government had a budget surplus each year from until 2008.
A) 1945
B) 1967
C) 1987
D) 1998
E) 2000
Question
The diagram below shows the budget deficit function for a government in a hypothetical economy.
FIGURE 31-1
Refer to Figure 31-1. Initially, suppose real GDP is $100 million and the budget deficit is $4 million, as shown by point A. If the government implements an expansionary fiscal policy by decreasing lump -sum taxes, then
A) the budget deficit function would shift up.
B) the budget deficit function would shift down.
C) the budget deficit function would become steeper.
D) the budget deficit function would become flatter.
E) the size of the budget deficit would decrease as we move from point A to point B.
FIGURE 31-1Refer to Figure 31-1. Initially, suppose real GDP is $100 million and the budget deficit is $4 million, as shown by point A. If the government implements an expansionary fiscal policy by decreasing lump -sum taxes, then
A) the budget deficit function would shift up.
B) the budget deficit function would shift down.
C) the budget deficit function would become steeper.
D) the budget deficit function would become flatter.
E) the size of the budget deficit would decrease as we move from point A to point B.
Question
The data below provides the Actual and Structural Budget Deficits, as a percentage of real GDP, for Canada between 1999 and 2010. Note that a negative value in the table indicates a budget surplus.
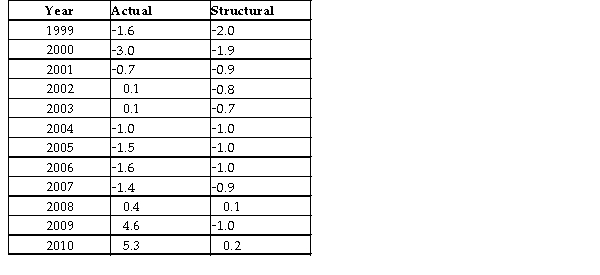 TABLE 31-2
Refer to Table 31-2. Based on the data in the table, in which of the following years was output greater than potential?
A) 1999
B) 2004
C) 2000
D) 2008
E) 2010
TABLE 31-2Refer to Table 31-2. Based on the data in the table, in which of the following years was output greater than potential?
A) 1999
B) 2004
C) 2000
D) 2008
E) 2010
Question
Question
Question
The diagram below shows two budget deficit functions for a hypothetical economy.
FIGURE 31-2
Refer to Figure 31-2. Initially, suppose the economy is at point A on budget deficit function B0. Real GDP Y) is
$100 million. If the level of potential output Y*) were $300 million, the structural budget deficit would be
A) $4 million.
B) $6.5 million.
C) $7.5 million.
D) $14 million.
E) Insufficient information to know.
FIGURE 31-2Refer to Figure 31-2. Initially, suppose the economy is at point A on budget deficit function B0. Real GDP Y) is
$100 million. If the level of potential output Y*) were $300 million, the structural budget deficit would be
A) $4 million.
B) $6.5 million.
C) $7.5 million.
D) $14 million.
E) Insufficient information to know.
Question
The diagram below shows two budget deficit functions for a hypothetical economy.
FIGURE 31-2
Refer to Figure 31-2. Initially, suppose the economy is at point A on budget deficit function B0. Real GDP Y) is
$100 million. If the government implements a fiscal policy that causes the budget deficit function to shift to B1, we can conclude that the policy was and the structural deficit will be than previously.
A) expansionary; smaller
B) expansionary; larger
C) contractionary; larger
D) contractionary; smaller
FIGURE 31-2Refer to Figure 31-2. Initially, suppose the economy is at point A on budget deficit function B0. Real GDP Y) is
$100 million. If the government implements a fiscal policy that causes the budget deficit function to shift to B1, we can conclude that the policy was and the structural deficit will be than previously.
A) expansionary; smaller
B) expansionary; larger
C) contractionary; larger
D) contractionary; smaller
Question
Question
The diagram below shows two budget deficit functions for a hypothetical economy.
FIGURE 31-2
Refer to Figure 31-2. Initially, suppose the economy is at point A on budget deficit function B0. Real GDP Y) is
$100 million. If the level of potential output Y*) were $400 million, the structural budget deficit would be
A) $14 million.
B) $4 million.
C) negative.
D) -$10 million.
E) $0.
FIGURE 31-2Refer to Figure 31-2. Initially, suppose the economy is at point A on budget deficit function B0. Real GDP Y) is
$100 million. If the level of potential output Y*) were $400 million, the structural budget deficit would be
A) $14 million.
B) $4 million.
C) negative.
D) -$10 million.
E) $0.
Question
The data below provides the Actual and Structural Budget Deficits, as a percentage of real GDP, for Canada between 1999 and 2010. Note that a negative value in the table indicates a budget surplus.
TABLE 31-2
Refer to Table 31-2. Based on the data in the table, over which of the following intervals was fiscal policy expansionary?
A) 1999-2003 because the structural budget deficit is falling
B) 1999-2003 because the structural budget deficit is rising
C) 2008-2010 because the actual deficit is greater than zero
D) 2004-2007 because the structural budget deficit is fairly stable
TABLE 31-2Refer to Table 31-2. Based on the data in the table, over which of the following intervals was fiscal policy expansionary?
A) 1999-2003 because the structural budget deficit is falling
B) 1999-2003 because the structural budget deficit is rising
C) 2008-2010 because the actual deficit is greater than zero
D) 2004-2007 because the structural budget deficit is fairly stable
Question
Question
The data below provides the Actual and Structural Budget Deficits, as a percentage of real GDP, for Canada between 1999 and 2010. Note that a negative value in the table indicates a budget surplus.
TABLE 31-2
Refer to Table 31-2. Consider the years 2008-2010. The fact that the actual budget deficit in each year was greater than the structural budget deficit reflects the fact that
A) output was equal to potential.
B) fiscal policy was contractionary over that time.
C) fiscal policy was expansionary over that time.
D) actual GDP was less than potential in each of those years.
E) actual GDP was greater than potential in each of those years.
TABLE 31-2Refer to Table 31-2. Consider the years 2008-2010. The fact that the actual budget deficit in each year was greater than the structural budget deficit reflects the fact that
A) output was equal to potential.
B) fiscal policy was contractionary over that time.
C) fiscal policy was expansionary over that time.
D) actual GDP was less than potential in each of those years.
E) actual GDP was greater than potential in each of those years.
Question
Question
The diagram below shows two budget deficit functions for a hypothetical economy.
FIGURE 31-2
The governmentʹs structural budget deficit is the budget deficit that would exist
A) if real GDP were equal to potential GDP.
B) with taxes and expenditures measured at the equilibrium level of GDP.
C) if policy were changed to eliminate the business cycle.
D) if tax rates were set to maximize tax revenues.
E) if there were no discretionary fiscal interventions in the economy.
FIGURE 31-2The governmentʹs structural budget deficit is the budget deficit that would exist
A) if real GDP were equal to potential GDP.
B) with taxes and expenditures measured at the equilibrium level of GDP.
C) if policy were changed to eliminate the business cycle.
D) if tax rates were set to maximize tax revenues.
E) if there were no discretionary fiscal interventions in the economy.
Question
The data below provides the Actual and Structural Budget Deficits, as a percentage of real GDP, for Canada between 1999 and 2010. Note that a negative value in the table indicates a budget surplus.
TABLE 31-2
Refer to Table 31-2. Consider the year 2004. Based on the data in the table we can conclude that
A) fiscal policy was expansionary in that year.
B) real output was less than potential in that year.
C) real output was equal to potential in that year.
D) real output was greater than potential in that year.
E) monetary policy was expansionary in that year.
TABLE 31-2Refer to Table 31-2. Consider the year 2004. Based on the data in the table we can conclude that
A) fiscal policy was expansionary in that year.
B) real output was less than potential in that year.
C) real output was equal to potential in that year.
D) real output was greater than potential in that year.
E) monetary policy was expansionary in that year.
Question
The diagram below shows two budget deficit functions for a hypothetical economy.
FIGURE 31-2
Suppose the governmentʹs actual budget deficit is equal to the structural budget deficit. Then it must be the case that
A) the primary budget deficit is zero.
B) the overall government budget is balanced.
C) the debt-to-GDP ratio is stable.
D) real GDP is equal to potential GDP.
E) the government is not reporting all of its expenses.
FIGURE 31-2Suppose the governmentʹs actual budget deficit is equal to the structural budget deficit. Then it must be the case that
A) the primary budget deficit is zero.
B) the overall government budget is balanced.
C) the debt-to-GDP ratio is stable.
D) real GDP is equal to potential GDP.
E) the government is not reporting all of its expenses.
Question
The diagram below shows two budget deficit functions for a hypothetical economy.
FIGURE 31-2
Refer to Figure 31-2. Initially, suppose the economy is at point A on budget deficit function B0. Real GDP Y) is
$100 million. If the level of potential output Y*) were $300 million, the cyclical component of the actual budget deficit would be
A) $4 million.
B) $6.5 million.
C) $7.5 million.
D) $14 million.
E) Insufficient information to know.
FIGURE 31-2Refer to Figure 31-2. Initially, suppose the economy is at point A on budget deficit function B0. Real GDP Y) is
$100 million. If the level of potential output Y*) were $300 million, the cyclical component of the actual budget deficit would be
A) $4 million.
B) $6.5 million.
C) $7.5 million.
D) $14 million.
E) Insufficient information to know.
Question
Question
The diagram below shows two budget deficit functions for a hypothetical economy.
FIGURE 31-2
If the economy goes into a recession, the structural budget deficit is most likely to
A) increase, because government expenditures and tax revenues will both rise.
B) increase, because government expenditures will rise and tax revenues will decline.
C) remain unchanged, although there will be a primary budget surplus.
D) remain unchanged, unless government actively changes its fiscal policy.
E) decrease, because government expenditures will decrease and tax revenues will rise.
FIGURE 31-2If the economy goes into a recession, the structural budget deficit is most likely to
A) increase, because government expenditures and tax revenues will both rise.
B) increase, because government expenditures will rise and tax revenues will decline.
C) remain unchanged, although there will be a primary budget surplus.
D) remain unchanged, unless government actively changes its fiscal policy.
E) decrease, because government expenditures will decrease and tax revenues will rise.
Question
The diagram below shows two budget deficit functions for a hypothetical economy.
FIGURE 31-2
The best measure of the change in the stance of a governmentʹs fiscal policy is
A) the actual budget deficit.
B) the cyclically adjusted deficit.
C) the change in the structural budget deficit.
D) the change in the actual budget deficit.
E) the change in the primary budget deficit.
FIGURE 31-2The best measure of the change in the stance of a governmentʹs fiscal policy is
A) the actual budget deficit.
B) the cyclically adjusted deficit.
C) the change in the structural budget deficit.
D) the change in the actual budget deficit.
E) the change in the primary budget deficit.
Question
The diagram below shows two budget deficit functions for a hypothetical economy.
FIGURE 31-2
The governmentʹs structural budget deficit adjusts for
A) any primary budget surplus or deficit incurred by the federal government.
B) changes in investment to smooth fluctuations in national income.
C) changes in spending or tax revenues caused by deviations in national income from potential output.
D) increases in the money supply in excess of the real growth in the economy.
E) interest rate changes that affect the absolute amount of debt-service payments.
FIGURE 31-2The governmentʹs structural budget deficit adjusts for
A) any primary budget surplus or deficit incurred by the federal government.
B) changes in investment to smooth fluctuations in national income.
C) changes in spending or tax revenues caused by deviations in national income from potential output.
D) increases in the money supply in excess of the real growth in the economy.
E) interest rate changes that affect the absolute amount of debt-service payments.
Question
The diagram below shows two budget deficit functions for a hypothetical economy.
FIGURE 31-2
Refer to Figure 31-2. Initially, suppose the economy is at point A on budget deficit function B0. Real GDP Y) is
$100 million. If the level of potential output Y*) were $300 million, how much of the actual budget deficit is due to the underlying structure of fiscal policy and is therefore independent of the current level of GDP?
A) $4 million.
B) $6.5 million.
C) $7.5 million.
D) $14 million.
E) Insufficient information to know.
FIGURE 31-2Refer to Figure 31-2. Initially, suppose the economy is at point A on budget deficit function B0. Real GDP Y) is
$100 million. If the level of potential output Y*) were $300 million, how much of the actual budget deficit is due to the underlying structure of fiscal policy and is therefore independent of the current level of GDP?
A) $4 million.
B) $6.5 million.
C) $7.5 million.
D) $14 million.
E) Insufficient information to know.

Unlock Deck
Sign up to unlock the cards in this deck!
Unlock Deck
Unlock Deck
1/129
Play
Full screen (f)
Deck 31: Government Debt and Deficits
1
In any given year, the governmentʹs debt-service payments are
A) equal to the annual budget deficit.
B) equal to the annual primary budget deficit.
C) the interest payments on the outstanding stock of government debt.
D) not related to the government deficit.
E) not required unless the debt is held by foreigners.
A) equal to the annual budget deficit.
B) equal to the annual primary budget deficit.
C) the interest payments on the outstanding stock of government debt.
D) not related to the government deficit.
E) not required unless the debt is held by foreigners.
C
2
Do we get a useful and meaningful statistic by dividing the national debt by the GDP?
A) No we are essentially ʺdividing apples by oranges,ʺ which is unhelpful.
B) No the GDP is not a meaningful measure of the well-being of the economy.
C) Yes we can then see how much of the national debt is owed by each individual citizen.
D) Yes we can see the burden of the debt in relation to the size of the economy.
E) No dividing a stock by a flow can never be sensible.
D
3
The governmentʹs primary budget deficit or surplus) is the
A) non-interest expenditures and interest payments.
B) sum of total government expenditures and revenues.
C) sum of interest payments and revenues.
D) total budget deficit between two fiscal years.
E) total budget deficit or surplus) excluding debt-service payments.
A) non-interest expenditures and interest payments.
B) sum of total government expenditures and revenues.
C) sum of interest payments and revenues.
D) total budget deficit between two fiscal years.
E) total budget deficit or surplus) excluding debt-service payments.
E
4
The federal governmentʹs ʺprimary budget deficitʺ
A) includes domestic borrowing but excludes foreign borrowing.
B) excludes debt-service payments.
C) is the amount of government borrowing in a fiscal year.
D) is the amount of tax revenue minus the amount of interest paid on the public debt.
E) is the most important indicator of the level of government spending.
Unlock Deck
Unlock for access to all 129 flashcards in this deck.
Unlock Deck
k this deck
5
If voters want to know how their tax dollars are being spent and how the federal government is managing its current spending, they should look at
A) federal/provincial tax transfers.
B) changes in the money supply.
C) the primary budget balance.
D) the overall budget balance.
E) the inflation adjusted deficit.
A) federal/provincial tax transfers.
B) changes in the money supply.
C) the primary budget balance.
D) the overall budget balance.
E) the inflation adjusted deficit.
Unlock Deck
Unlock for access to all 129 flashcards in this deck.
Unlock Deck
k this deck
6
Consider the following variables:
G = government purchases
I = interest rate on government debt D = stock of government debt
T = net tax revenue
The governmentʹs budget deficit can be expressed as
A) ΔD = G + iD) - T.
B) ΔD = G - iD) + T.
C) deficit = D - G + iD) + T.
D) deficit = D - T + G + iD).
E) T = ΔD - G + iD).
G = government purchases
I = interest rate on government debt D = stock of government debt
T = net tax revenue
The governmentʹs budget deficit can be expressed as
A) ΔD = G + iD) - T.
B) ΔD = G - iD) + T.
C) deficit = D - G + iD) + T.
D) deficit = D - T + G + iD).
E) T = ΔD - G + iD).
Unlock Deck
Unlock for access to all 129 flashcards in this deck.
Unlock Deck
k this deck
7
The governmentʹs primary budget deficit or surplus) is the difference between the
A) non-interest expenditures and interest payments.
B) interest payments and revenues.
C) total budget deficit or surplus) and debt-service payments.
D) total budget deficit or surplus) between one year and the next.
E) total government expenditures and revenues.
A) non-interest expenditures and interest payments.
B) interest payments and revenues.
C) total budget deficit or surplus) and debt-service payments.
D) total budget deficit or surplus) between one year and the next.
E) total government expenditures and revenues.
Unlock Deck
Unlock for access to all 129 flashcards in this deck.
Unlock Deck
k this deck
8
The governmentʹs annual primary budget deficit is equal to the
A) accumulation of government borrowing.
B) decrease in the stock of government debt during the course of a year.
C) excess of governmentʹs program expenditures over tax revenues in a given fiscal year.
D) total amount of government spending on program expenses, personnel, and capital outlays.
E) excess of current revenue over current expenditure.
Unlock Deck
Unlock for access to all 129 flashcards in this deck.
Unlock Deck
k this deck
9
Suppose the stock of government debt in Canada at the end of one fiscal year is $475 billion. If the stock of debt falls to $461 billion by the end of the next fiscal year, and debt-service payments during that year were $38 billion, then we know that the government had
A) a primary budget surplus of $52 billion.
B) a primary budget surplus of $14 billion.
C) a primary budget surplus of $24 billion.
D) an annual budget surplus of $38 billion.
E) an annual budget deficit of $14 billion.
A) a primary budget surplus of $52 billion.
B) a primary budget surplus of $14 billion.
C) a primary budget surplus of $24 billion.
D) an annual budget surplus of $38 billion.
E) an annual budget deficit of $14 billion.
Unlock Deck
Unlock for access to all 129 flashcards in this deck.
Unlock Deck
k this deck
10
Consider the governmentʹs budget constraint. The accumulated stock of government debt will begin to fall
A) if the governmentʹs debt-service payments are zero.
B) if the government does not borrow money.
C) if the growth rate of real GDP is higher than the real interest rate.
D) when the governmentʹs annual budget is in deficit.
E) when the governmentʹs annual budget is in surplus.
A) if the governmentʹs debt-service payments are zero.
B) if the government does not borrow money.
C) if the growth rate of real GDP is higher than the real interest rate.
D) when the governmentʹs annual budget is in deficit.
E) when the governmentʹs annual budget is in surplus.
Unlock Deck
Unlock for access to all 129 flashcards in this deck.
Unlock Deck
k this deck
11
When a government changes its fiscal policy, it is
A) changing the exchange rates to change national income.
B) increasing the money supply to increase national income.
C) changing government spending and/or tax rates to achieve some objective.
D) using government spending and taxes together with changing the money supply in order to achieve full employment.
E) buying and selling private bonds to increase or decrease the overnight lending rate.
Unlock Deck
Unlock for access to all 129 flashcards in this deck.
Unlock Deck
k this deck
12
Consider the federal governmentʹs budget constraint. If the governmentʹs total budget deficit is $27 billion and its debt-service payments are $29 billion, then its
A) primary budget deficit is $2 billion.
B) primary budget deficit is $56 billion.
C) primary budget surplus is $2 billion.
D) primary budget surplus is $56 billion.
E) Not enough information to determine.
A) primary budget deficit is $2 billion.
B) primary budget deficit is $56 billion.
C) primary budget surplus is $2 billion.
D) primary budget surplus is $56 billion.
E) Not enough information to determine.
Unlock Deck
Unlock for access to all 129 flashcards in this deck.
Unlock Deck
k this deck
13
Suppose that in Year 2 there was a higher federal budget deficit than in Year 1. This could be explained by
In Year 2.
A) lower real interest rates
B) higher real GDP with fiscal policy constant)
C) lower real GDP with fiscal policy constant)
D) lower government expenditure with real GDP constant)
E) a lower primary budget surplus
In Year 2.
A) lower real interest rates
B) higher real GDP with fiscal policy constant)
C) lower real GDP with fiscal policy constant)
D) lower government expenditure with real GDP constant)
E) a lower primary budget surplus
Unlock Deck
Unlock for access to all 129 flashcards in this deck.
Unlock Deck
k this deck
14
In any given year, the governmentʹs debt-service payments are equal to
A) fiscal borrowing) × the interest rate).
B) government spending) × the interest rate).
C) government spending - tax revenue) × the interest rate).
D) total outstanding government debt) × the interest rate).
E) government spending + tax revenue) × the interest rate).
A) fiscal borrowing) × the interest rate).
B) government spending) × the interest rate).
C) government spending - tax revenue) × the interest rate).
D) total outstanding government debt) × the interest rate).
E) government spending + tax revenue) × the interest rate).
Unlock Deck
Unlock for access to all 129 flashcards in this deck.
Unlock Deck
k this deck
15
If we want to know whether tax revenues are sufficient to finance the discretionary part of government expenditure, which of the following measures should we analyze?
A) the cyclically adjusted deficit/surplus
B) the governmentʹs budget constraint
C) the debt-to-GDP ratio
D) the governmentʹs primary deficit/surplus
E) the interest rate on government bonds compared to the growth rate of real GDP
A) the cyclically adjusted deficit/surplus
B) the governmentʹs budget constraint
C) the debt-to-GDP ratio
D) the governmentʹs primary deficit/surplus
E) the interest rate on government bonds compared to the growth rate of real GDP
Unlock Deck
Unlock for access to all 129 flashcards in this deck.
Unlock Deck
k this deck
16
A simple equation describing the governmentʹs budget constraint is
A) government expenditure = tax revenue - borrowing.
B) government expenditure = tax revenue + borrowing.
C) government expenditure = tax revenue + debt-service payments.
D) tax revenue = government expenditure + borrowing.
E) tax revenue = borrowing - government expenditure.
A) government expenditure = tax revenue - borrowing.
B) government expenditure = tax revenue + borrowing.
C) government expenditure = tax revenue + debt-service payments.
D) tax revenue = government expenditure + borrowing.
E) tax revenue = borrowing - government expenditure.
Unlock Deck
Unlock for access to all 129 flashcards in this deck.
Unlock Deck
k this deck
17
The extent to which tax revenues are able to finance the discretionary part of total government expenditure is best measured by the
A) cyclically adjusted deficit/surplus.
B) governmentʹs current fiscal policy.
C) debt-to-GDP ratio.
D) governmentʹs primary budget deficit or surplus.
E) tax-to-GDP ratio.
A) cyclically adjusted deficit/surplus.
B) governmentʹs current fiscal policy.
C) debt-to-GDP ratio.
D) governmentʹs primary budget deficit or surplus.
E) tax-to-GDP ratio.
Unlock Deck
Unlock for access to all 129 flashcards in this deck.
Unlock Deck
k this deck
18
What is the difference between the governmentʹs debt and the governmentʹs deficit?
A) The debt is the annual shortfall of revenues minus disbursements whereas the deficit is the accumulation of past debts.
B) The debt is the amount the government pays in interest payments whereas the deficit has not yet incurred interest charges.
C) The debt is the amount payable to the Bank of Canada whereas the deficit is the annual shortfall of revenue minus disbursements.
D) The debt is the accumulation of past deficits whereas the deficit is the annual shortfall between revenues and disbursements.
E) The debt is the difference between tax revenues and government expenditures whereas the deficit is the difference between tax revenues and borrowing.
Unlock Deck
Unlock for access to all 129 flashcards in this deck.
Unlock Deck
k this deck
19
Suppose the stock of government debt in Canada at the end of one fiscal year is $475 billion. If the stock of debt falls to $461 billion by the end of the next fiscal year, then we know that in that year
A) the government had a primary budget surplus of $14 billion.
B) the government had a primary budget deficit of $14 billion.
C) tax revenues increased by $14 billion.
D) the government had an annual budget surplus of $14 billion.
E) debt-service payments fell by $14 billion.
A) the government had a primary budget surplus of $14 billion.
B) the government had a primary budget deficit of $14 billion.
C) tax revenues increased by $14 billion.
D) the government had an annual budget surplus of $14 billion.
E) debt-service payments fell by $14 billion.
Unlock Deck
Unlock for access to all 129 flashcards in this deck.
Unlock Deck
k this deck
20
Consider the following variables:
G = government purchases
I = interest rate on government debt D = stock of government debt
T = net tax revenue
The governmentʹs budget constraint can be expressed as
A) G + iD) = borrowing - T.
B) G + iD) - T = borrowing.
C) G + iD) + T = borrowing.
D) G - T - iD) = borrowing.
E) G - iD) = borrowing + T.
Unlock Deck
Unlock for access to all 129 flashcards in this deck.
Unlock Deck
k this deck
21
The stock of government debt will continue to rise unless the government
A) increases its taxes.
B) decreases its expenditures.
C) decreases the size of its transfers.
D) runs a budget surplus.
E) runs a budget deficit.
A) increases its taxes.
B) decreases its expenditures.
C) decreases the size of its transfers.
D) runs a budget surplus.
E) runs a budget deficit.
Unlock Deck
Unlock for access to all 129 flashcards in this deck.
Unlock Deck
k this deck
22
The table below shows government purchases G), net tax revenues T), and debt-service payments iD) over a 4-year period for a hypothetical economy. All figures are in billions of dollars. Assume the stock of debt at the end of 2012 is $500 billion. TABLE 31-1
Refer to Table 31.1. What is the budget deficit in 2012?
A) $18 billion
B) -$8 billion
C) $8 billion.
D) -$10 billion
E) $10 billion
TABLE 31-1Refer to Table 31.1. What is the budget deficit in 2012?
A) $18 billion
B) -$8 billion
C) $8 billion.
D) -$10 billion
E) $10 billion
Unlock Deck
Unlock for access to all 129 flashcards in this deck.
Unlock Deck
k this deck
23
The table below shows government purchases G), net tax revenues T), and debt-service payments iD) over a 4-year period for a hypothetical economy. All figures are in billions of dollars. Assume the stock of debt at the end of 2012 is $500 billion. TABLE 31-1
Refer to Table 31.1. What is the primary budget deficit in 2014?
A) $22 billion
B) -$22 billion
C) $21 billion
D) $2 billion
E) -$2 billion
TABLE 31-1Refer to Table 31.1. What is the primary budget deficit in 2014?
A) $22 billion
B) -$22 billion
C) $21 billion
D) $2 billion
E) -$2 billion
Unlock Deck
Unlock for access to all 129 flashcards in this deck.
Unlock Deck
k this deck
24
Suppose during one fiscal year, government purchases are $195 billion, debt-service payments are $22 billion and net tax revenues are $208 billion. What is the governmentʹs primary budget deficit/surplus?
A) primary budget surplus of $22 billion
B) primary budget deficit of $13 billion
C) primary budget surplus of $13 billion
D) primary budget deficit of $9 billion
E) primary budget surplus of $9 billion
A) primary budget surplus of $22 billion
B) primary budget deficit of $13 billion
C) primary budget surplus of $13 billion
D) primary budget deficit of $9 billion
E) primary budget surplus of $9 billion
Unlock Deck
Unlock for access to all 129 flashcards in this deck.
Unlock Deck
k this deck
25
The governmentʹs current spending and taxation policies cannot affect the
A) primary budget deficit.
B) annual budget deficit.
C) size of its transfers.
D) change in the stock of government debt.
E) existing stock of government debt.
A) primary budget deficit.
B) annual budget deficit.
C) size of its transfers.
D) change in the stock of government debt.
E) existing stock of government debt.
Unlock Deck
Unlock for access to all 129 flashcards in this deck.
Unlock Deck
k this deck
26
Consider two economies, A and B. Economy A has a stock of government debt equal to $800 billion, while Economy B has a stock of government debt equal to $22 billion. In order to determine the economic importance of these government debt loads in the respective economies, it is necessary to know for each economy.
A) the level of government expenditures
B) the net tax rate
C) the primary budget deficit
D) the GDP
E) the stance of monetary policy
A) the level of government expenditures
B) the net tax rate
C) the primary budget deficit
D) the GDP
E) the stance of monetary policy
Unlock Deck
Unlock for access to all 129 flashcards in this deck.
Unlock Deck
k this deck
27
The table below shows government purchases G), net tax revenues T), and debt-service payments iD) over a 4-year period for a hypothetical economy. All figures are in billions of dollars. Assume the stock of debt at the end of 2012 is $500 billion. TABLE 31-1
The Canadian federal debt-to-GDP ratio reached a post Second World War high of about % in 1996. By 2015/2016, the debt-to GDP ratio was forecast to be about %.
A) 80; 110
B) 50; 0
C) 40; 10
D) 110; 50
E) 70; 30
TABLE 31-1The Canadian federal debt-to-GDP ratio reached a post Second World War high of about % in 1996. By 2015/2016, the debt-to GDP ratio was forecast to be about %.
A) 80; 110
B) 50; 0
C) 40; 10
D) 110; 50
E) 70; 30
Unlock Deck
Unlock for access to all 129 flashcards in this deck.
Unlock Deck
k this deck
28
The table below shows government purchases G), net tax revenues T), and debt-service payments iD) over a 4-year period for a hypothetical economy. All figures are in billions of dollars. Assume the stock of debt at the end of 2012 is $500 billion. TABLE 31-1
Refer to Table 31.1. What is the stock of debt at the end of 2015?
A) $494 billion
B) $500 billion
C) $506 billion
D) $528 billion
E) $552 billion
TABLE 31-1Refer to Table 31.1. What is the stock of debt at the end of 2015?
A) $494 billion
B) $500 billion
C) $506 billion
D) $528 billion
E) $552 billion
Unlock Deck
Unlock for access to all 129 flashcards in this deck.
Unlock Deck
k this deck
29
The table below shows government purchases G), net tax revenues T), and debt-service payments iD) over a 4-year period for a hypothetical economy. All figures are in billions of dollars. Assume the stock of debt at the end of 2012 is $500 billion. TABLE 31-1
Refer to Table 31.1. What is the primary budget deficit in 2013?
A) -$12 billion
B) $12 billion
C) -$6 billion
D) $6 billion
E) There is no primary budget deficit.
TABLE 31-1Refer to Table 31.1. What is the primary budget deficit in 2013?
A) -$12 billion
B) $12 billion
C) -$6 billion
D) $6 billion
E) There is no primary budget deficit.
Unlock Deck
Unlock for access to all 129 flashcards in this deck.
Unlock Deck
k this deck
30
Suppose during one fiscal year, government purchases are $195 billion, debt-service payments are $22 billion and net tax revenues are $208 billion. What is the annual budget deficit/surplus?
A) budget surplus of $22 billion
B) budget deficit of $13 billion
C) budget surplus of $13 billion
D) budget deficit of $9 billion
E) budget surplus of $9 billion
A) budget surplus of $22 billion
B) budget deficit of $13 billion
C) budget surplus of $13 billion
D) budget deficit of $9 billion
E) budget surplus of $9 billion
Unlock Deck
Unlock for access to all 129 flashcards in this deck.
Unlock Deck
k this deck
31
The table below shows government purchases G), net tax revenues T), and debt-service payments iD) over a 4-year period for a hypothetical economy. All figures are in billions of dollars. Assume the stock of debt at the end of 2012 is $500 billion. TABLE 31-1
The Canadian federal governmentʹs debt-to-GDP ratio climbed steadily from
A) 1939 to the late 1980s.
B) 1960 to the late 1990s.
C) 1975 to the mid 1990s.
D) 1995 to 2009.
E) 2000 to 2015.
TABLE 31-1The Canadian federal governmentʹs debt-to-GDP ratio climbed steadily from
A) 1939 to the late 1980s.
B) 1960 to the late 1990s.
C) 1975 to the mid 1990s.
D) 1995 to 2009.
E) 2000 to 2015.
Unlock Deck
Unlock for access to all 129 flashcards in this deck.
Unlock Deck
k this deck
32
The table below shows government purchases G), net tax revenues T), and debt-service payments iD) over a 4-year period for a hypothetical economy. All figures are in billions of dollars. Assume the stock of debt at the end of 2012 is $500 billion. TABLE 31-1
Refer to Table 31.1. What is the budget deficit in 2015?
A) -$24 billion
B) $24 billion
C) -$3 billion
D) $3 billion
E) $21 billion
TABLE 31-1Refer to Table 31.1. What is the budget deficit in 2015?
A) -$24 billion
B) $24 billion
C) -$3 billion
D) $3 billion
E) $21 billion
Unlock Deck
Unlock for access to all 129 flashcards in this deck.
Unlock Deck
k this deck
33
Suppose the stock of government debt in Canada at the end of one fiscal year is $475 billion. If the stock of debt rises to $482 billion by the end of the next fiscal year, then we know that in that year
A) debt-service payments rose by $7 billion.
B) the government had a primary budget surplus of $7 billion.
C) the government had an annual budget deficit of $7 billion.
D) the government had a primary budget deficit of $7 billion.
E) tax revenues decreased by $7 billion.
A) debt-service payments rose by $7 billion.
B) the government had a primary budget surplus of $7 billion.
C) the government had an annual budget deficit of $7 billion.
D) the government had a primary budget deficit of $7 billion.
E) tax revenues decreased by $7 billion.
Unlock Deck
Unlock for access to all 129 flashcards in this deck.
Unlock Deck
k this deck
34
The table below shows government purchases G), net tax revenues T), and debt-service payments iD) over a 4-year period for a hypothetical economy. All figures are in billions of dollars. Assume the stock of debt at the end of 2012 is $500 billion. TABLE 31-1
Consider two economies, A and B. Economy A has a stock of government debt equal to $800 billion and a
Debt-to-GDP ratio of 10%. Economy B has a stock of government debt equal to $22 billion and a debt -to-GDP ratio of 80%. What is the GDP for each economy?
A) Economy A: GDP = $8 trillion Economy B: GDP = $27.5 billion
B) Economy A: GDP = $80 billion Economy B: GDP = $18.7 billion
C) Economy A: GDP = $80 trillion Economy B: GDP = $275 billion
D) Economy A: GDP = $800 billion Economy B: GDP = $22 billion
E) Economy A: GDP = $8 trillion Economy B: GDP = $2.75 billion
TABLE 31-1Consider two economies, A and B. Economy A has a stock of government debt equal to $800 billion and a
Debt-to-GDP ratio of 10%. Economy B has a stock of government debt equal to $22 billion and a debt -to-GDP ratio of 80%. What is the GDP for each economy?
A) Economy A: GDP = $8 trillion Economy B: GDP = $27.5 billion
B) Economy A: GDP = $80 billion Economy B: GDP = $18.7 billion
C) Economy A: GDP = $80 trillion Economy B: GDP = $275 billion
D) Economy A: GDP = $800 billion Economy B: GDP = $22 billion
E) Economy A: GDP = $8 trillion Economy B: GDP = $2.75 billion
Unlock Deck
Unlock for access to all 129 flashcards in this deck.
Unlock Deck
k this deck
35
Suppose the stock of government debt in Canada at the end of one fiscal year Year 1) is $475 billion. During the following year Year 2), government purchases were $180 billion, debt -service payments were $25 billion, and net tax revenues were $208 billion. What is the stock of debt at the end of Year 2?
A) $422 billion
B) $457 billion
C) $472 billion
D) $475 billion
E) $478 billion
A) $422 billion
B) $457 billion
C) $472 billion
D) $475 billion
E) $478 billion
Unlock Deck
Unlock for access to all 129 flashcards in this deck.
Unlock Deck
k this deck
36
If the governmentʹs total budget surplus is $10 billion and its debt-service payments are $8 billion, then its primary budget surplus is
A) $2 billion.
B) $8 billion.
C) $10 billion.
D) $18 billion.
E) -$2 billion.
A) $2 billion.
B) $8 billion.
C) $10 billion.
D) $18 billion.
E) -$2 billion.
Unlock Deck
Unlock for access to all 129 flashcards in this deck.
Unlock Deck
k this deck
37
The table below shows government purchases G), net tax revenues T), and debt-service payments iD) over a 4-year period for a hypothetical economy. All figures are in billions of dollars. Assume the stock of debt at the end of 2012 is $500 billion. TABLE 31-1
The Canadian federal governmentʹs net debt as a percentage of GDP reached a historic high of
A) 70% in 1996 due to large and persistent deficits throughout the 1970s.
B) 70% in 1982 due to the OPEC oil shock in the mid 1970s and the severe inflation that followed.
C) 110% in 1946 as a result of Canadaʹs participation in the Second World War.
D) 52% in 2012 due to the fiscal expansion following the global financial crisis.
E) 90% in the late 1960s due to massive infrastructure projects in progress across Canada.
TABLE 31-1The Canadian federal governmentʹs net debt as a percentage of GDP reached a historic high of
A) 70% in 1996 due to large and persistent deficits throughout the 1970s.
B) 70% in 1982 due to the OPEC oil shock in the mid 1970s and the severe inflation that followed.
C) 110% in 1946 as a result of Canadaʹs participation in the Second World War.
D) 52% in 2012 due to the fiscal expansion following the global financial crisis.
E) 90% in the late 1960s due to massive infrastructure projects in progress across Canada.
Unlock Deck
Unlock for access to all 129 flashcards in this deck.
Unlock Deck
k this deck
38
If the governmentʹs total budget deficit is $24 billion and its debt -service payments are $20 billion, then its
Is $4 billion.
A) cyclically adjusted deficit
B) primary budget deficit
C) primary budget surplus
D) government expenditure
E) total tax revenue
Is $4 billion.
A) cyclically adjusted deficit
B) primary budget deficit
C) primary budget surplus
D) government expenditure
E) total tax revenue
Unlock Deck
Unlock for access to all 129 flashcards in this deck.
Unlock Deck
k this deck
39
The table below shows government purchases G), net tax revenues T), and debt-service payments iD) over a 4-year period for a hypothetical economy. All figures are in billions of dollars. Assume the stock of debt at the end of 2012 is $500 billion. TABLE 31-1
Refer to Table 31.1. What is the stock of debt at the end of 2013?
A) $488 billion
B) $494 billion
C) $500 billion
D) $506 billion
E) $512 billion
TABLE 31-1Refer to Table 31.1. What is the stock of debt at the end of 2013?
A) $488 billion
B) $494 billion
C) $500 billion
D) $506 billion
E) $512 billion
Unlock Deck
Unlock for access to all 129 flashcards in this deck.
Unlock Deck
k this deck
40
If the governmentʹs tax revenues are less than its total spending including debt-service payments), then we know
1) the government has an annual budget deficit;
2) the government has a primary budget deficit;
3) the stock of government debt is increasing.
A) 1 only
B) 2 only
C) 3 only
D) 1 and 2
E) 1 and 3
1) the government has an annual budget deficit;
2) the government has a primary budget deficit;
3) the stock of government debt is increasing.
A) 1 only
B) 2 only
C) 3 only
D) 1 and 2
E) 1 and 3
Unlock Deck
Unlock for access to all 129 flashcards in this deck.
Unlock Deck
k this deck
41
The diagram below shows the budget deficit function for a government in a hypothetical economy.
FIGURE 31-1
Refer to Figure 31-1. Initially, suppose real GDP is $100 million and the budget deficit is $4 million, as shown by point A on the graph. Which of the following is consistent with a move from point A to point B?
A) implementation of an expansionary fiscal policy
B) implementation of a contractionary fiscal policy
C) implementation of a contractionary monetary policy
D) the economy entering into a recession
E) the economy entering into a boom
FIGURE 31-1Refer to Figure 31-1. Initially, suppose real GDP is $100 million and the budget deficit is $4 million, as shown by point A on the graph. Which of the following is consistent with a move from point A to point B?
A) implementation of an expansionary fiscal policy
B) implementation of a contractionary fiscal policy
C) implementation of a contractionary monetary policy
D) the economy entering into a recession
E) the economy entering into a boom
Unlock Deck
Unlock for access to all 129 flashcards in this deck.
Unlock Deck
k this deck
42
Consider the governmentʹs budget deficit function, graphed with the budget deficit on the vertical axis and real GDP on the horizontal axis. The vertical position or height) of the budget deficit function is determined by
A) the governmentʹs fiscal policies.
B) nominal GDP.
C) the interest rate times taxes.
D) the purchase and sale of government securities on the open market.
E) the stock of government debt minus government spending.
A) the governmentʹs fiscal policies.
B) nominal GDP.
C) the interest rate times taxes.
D) the purchase and sale of government securities on the open market.
E) the stock of government debt minus government spending.
Unlock Deck
Unlock for access to all 129 flashcards in this deck.
Unlock Deck
k this deck
43
The diagram below shows two budget deficit functions for a hypothetical economy.
FIGURE 31-2
Refer to Figure 31-2. Initially, suppose the economy is at point A. If the government were to then implement a fiscal expansion, the structural budget deficit would be
A) $4 million.
B) $6 million.
C) $7 million.
D) $10 million.
E) Insufficient information to know.
FIGURE 31-2Refer to Figure 31-2. Initially, suppose the economy is at point A. If the government were to then implement a fiscal expansion, the structural budget deficit would be
A) $4 million.
B) $6 million.
C) $7 million.
D) $10 million.
E) Insufficient information to know.
Unlock Deck
Unlock for access to all 129 flashcards in this deck.
Unlock Deck
k this deck
44
Consider the governmentʹs budget deficit function over a two-year time span - Years 1 and 2. Suppose in Year 2 there was a lower federal budget deficit than in Year 1. This could be explained by in Year 2.
A) higher government expenditures with constant real GDP)
B) higher real GDP with constant fiscal policy)
C) lower real GDP with constant fiscal policy)
D) a higher stock of government debt
E) an upward shift of the budget deficit function
A) higher government expenditures with constant real GDP)
B) higher real GDP with constant fiscal policy)
C) lower real GDP with constant fiscal policy)
D) a higher stock of government debt
E) an upward shift of the budget deficit function
Unlock Deck
Unlock for access to all 129 flashcards in this deck.
Unlock Deck
k this deck
45
The diagram below shows the budget deficit function for a government in a hypothetical economy.
FIGURE 31-1
Refer to Figure 31-1. Initially, suppose real GDP is $100 million and the budget deficit is $4 million, as shown by point A. If the government implements a contractionary fiscal policy by decreasing its purchases of goods and services, then
A) the budget deficit function would shift up.
B) the budget deficit function would shift down.
C) the budget deficit function would become steeper.
D) the budget deficit function would become flatter.
E) the size of the budget deficit would decrease as we move from point A to point B.
FIGURE 31-1Refer to Figure 31-1. Initially, suppose real GDP is $100 million and the budget deficit is $4 million, as shown by point A. If the government implements a contractionary fiscal policy by decreasing its purchases of goods and services, then
A) the budget deficit function would shift up.
B) the budget deficit function would shift down.
C) the budget deficit function would become steeper.
D) the budget deficit function would become flatter.
E) the size of the budget deficit would decrease as we move from point A to point B.
Unlock Deck
Unlock for access to all 129 flashcards in this deck.
Unlock Deck
k this deck
46
The diagram below shows the budget deficit function for a government in a hypothetical economy.
FIGURE 31-1
Refer to Figure 31-1. Initially, suppose real GDP is $100 million and the budget deficit is $4 million, as shown by point A. If the government implements an expansionary fiscal policy by increasing its purchases of goods and services, then
A) the budget deficit function would shift down.
B) the budget deficit function would become steeper.
C) the budget deficit function would become flatter.
D) the budget deficit function would shift up.
E) the size of the budget deficit would decrease as we move from point A to point B.
FIGURE 31-1Refer to Figure 31-1. Initially, suppose real GDP is $100 million and the budget deficit is $4 million, as shown by point A. If the government implements an expansionary fiscal policy by increasing its purchases of goods and services, then
A) the budget deficit function would shift down.
B) the budget deficit function would become steeper.
C) the budget deficit function would become flatter.
D) the budget deficit function would shift up.
E) the size of the budget deficit would decrease as we move from point A to point B.
Unlock Deck
Unlock for access to all 129 flashcards in this deck.
Unlock Deck
k this deck
47
The diagram below shows two budget deficit functions for a hypothetical economy.
FIGURE 31-2
Refer to Figure 31-2. Initially, suppose the economy is at point A on budget deficit function B0. Real GDP Y) is
$100 million. If the level of potential output Y*)were $300 million, the structural budget deficit would be
A) $2 million.
B) $14 million.
C) measured by the vertical distance between the horizontal axis and B0 at real GDP = 300).
D) measured by the vertical distance between point A and the budget deficit that would exist at real GDP = 300 million.
E) Insufficient information to know.
FIGURE 31-2Refer to Figure 31-2. Initially, suppose the economy is at point A on budget deficit function B0. Real GDP Y) is
$100 million. If the level of potential output Y*)were $300 million, the structural budget deficit would be
A) $2 million.
B) $14 million.
C) measured by the vertical distance between the horizontal axis and B0 at real GDP = 300).
D) measured by the vertical distance between point A and the budget deficit that would exist at real GDP = 300 million.
E) Insufficient information to know.
Unlock Deck
Unlock for access to all 129 flashcards in this deck.
Unlock Deck
k this deck
48
Consider the governmentʹs budget deficit function. With an unchanged fiscal policy by government, an increase in GDP tends to net tax revenues and thus the budget deficit.
A) raise; raise
B) raise; lower
C) lower; raise
D) lower; lower
E) lower; leave unchanged
A) raise; raise
B) raise; lower
C) lower; raise
D) lower; lower
E) lower; leave unchanged
Unlock Deck
Unlock for access to all 129 flashcards in this deck.
Unlock Deck
k this deck
49
Suppose the governmentʹs budget deficit falls from one year to the next, but there has been no change in the governmentʹs fiscal policy. The change in the budget deficit can be explained by
A) a rising real interest rate.
B) a change in the stance of fiscal policy.
C) a rising real GDP.
D) a rise in the cyclically adjusted deficit.
E) a rise in the primary budget deficit.
A) a rising real interest rate.
B) a change in the stance of fiscal policy.
C) a rising real GDP.
D) a rise in the cyclically adjusted deficit.
E) a rise in the primary budget deficit.
Unlock Deck
Unlock for access to all 129 flashcards in this deck.
Unlock Deck
k this deck
50
The diagram below shows two budget deficit functions for a hypothetical economy.
FIGURE 31-2
Refer to Figure 31-2. Initially, suppose real GDP is $100 million and the budget deficit is $14 million, as shown by point A. Which of the following events could result in a move from point A to point B?
A) the implementation of an expansionary fiscal policy
B) the implementation of a contractionary fiscal policy
C) the implementation of an expansionary monetary policy
D) the implementation of a contractionary monetary policy
E) the economy entering into a boom
FIGURE 31-2Refer to Figure 31-2. Initially, suppose real GDP is $100 million and the budget deficit is $14 million, as shown by point A. Which of the following events could result in a move from point A to point B?
A) the implementation of an expansionary fiscal policy
B) the implementation of a contractionary fiscal policy
C) the implementation of an expansionary monetary policy
D) the implementation of a contractionary monetary policy
E) the economy entering into a boom
Unlock Deck
Unlock for access to all 129 flashcards in this deck.
Unlock Deck
k this deck
51
Consider the governmentʹs budget deficit function. If the economy goes into a recession, a government budget deficit is most likely to
A) increase, because government expenditures and tax revenues will both rise.
B) increase, because government expenditures will rise and tax revenues will decline.
C) remain unchanged, although there will be a primary budget surplus.
D) remain unchanged, because changes in government expenditures and tax revenues will balance each other out.
E) decrease, because government expenditures will decrease and tax revenues will rise.
Unlock Deck
Unlock for access to all 129 flashcards in this deck.
Unlock Deck
k this deck
52
The diagram below shows two budget deficit functions for a hypothetical economy.
FIGURE 31-2
Refer to Figure 31-2. Initially, suppose real GDP is $100 million and the budget deficit is $14 million, as shown by point A. Which of the following events could result in a move from point A to point C?
A) a fiscal expansion and an increase in GDP
B) a fiscal contraction and an increase in GDP
C) a fiscal expansion and a decrease in GDP
D) a fiscal contraction and a decrease in GDP
E) an increase in GDP with no change in fiscal policy
FIGURE 31-2Refer to Figure 31-2. Initially, suppose real GDP is $100 million and the budget deficit is $14 million, as shown by point A. Which of the following events could result in a move from point A to point C?
A) a fiscal expansion and an increase in GDP
B) a fiscal contraction and an increase in GDP
C) a fiscal expansion and a decrease in GDP
D) a fiscal contraction and a decrease in GDP
E) an increase in GDP with no change in fiscal policy
Unlock Deck
Unlock for access to all 129 flashcards in this deck.
Unlock Deck
k this deck
53
The table below shows government purchases G), net tax revenues T), and debt-service payments iD) over a 4-year period for a hypothetical economy. All figures are in billions of dollars. Assume the stock of debt at the end of 2012 is $500 billion. TABLE 31-1
In every year between 1998 and 2008, the Canadian federal government had a
A) budget deficit, indicating that even deep cuts in government spending were not sufficient to alleviate the problem.
B) primary deficit, indicating that tax revenues were insufficient to cover discretionary government expenditures.
C) budget deficit, which contributed to a growing stock of government debt.
D) primary surplus but overall deficit, indicating that tax revenues were more than sufficient to cover discretionary government expenditures.
E) budget surplus, indicating that tax revenues were more than sufficient to cover total government expenditures.
TABLE 31-1In every year between 1998 and 2008, the Canadian federal government had a
A) budget deficit, indicating that even deep cuts in government spending were not sufficient to alleviate the problem.
B) primary deficit, indicating that tax revenues were insufficient to cover discretionary government expenditures.
C) budget deficit, which contributed to a growing stock of government debt.
D) primary surplus but overall deficit, indicating that tax revenues were more than sufficient to cover discretionary government expenditures.
E) budget surplus, indicating that tax revenues were more than sufficient to cover total government expenditures.
Unlock Deck
Unlock for access to all 129 flashcards in this deck.
Unlock Deck
k this deck
54
The diagram below shows the budget deficit function for a government in a hypothetical economy.
FIGURE 31-1
Refer to Figure 31-1. For the given budget deficit function in the diagram, the government will have a budget surplus if
1) real GDP increases beyond $X million
2) the interest rate on government debt decreases
3) government expenditure decreases
A) 1 only
B) 2 only
C) 3 only
D) 1 or 2 or 3
E) 2 or 3 only
FIGURE 31-1Refer to Figure 31-1. For the given budget deficit function in the diagram, the government will have a budget surplus if
1) real GDP increases beyond $X million
2) the interest rate on government debt decreases
3) government expenditure decreases
A) 1 only
B) 2 only
C) 3 only
D) 1 or 2 or 3
E) 2 or 3 only
Unlock Deck
Unlock for access to all 129 flashcards in this deck.
Unlock Deck
k this deck
55
The budget deficit function is graphed with the budget deficit on the vertical axis and on the horizontal axis, and is .
A) real GDP; downward sloping
B) real GDP; upward sloping
C) the interest rate; downward sloping
D) the interest rate; upward sloping
E) the interest rate; horizontal
A) real GDP; downward sloping
B) real GDP; upward sloping
C) the interest rate; downward sloping
D) the interest rate; upward sloping
E) the interest rate; horizontal
Unlock Deck
Unlock for access to all 129 flashcards in this deck.
Unlock Deck
k this deck
56
Consider the governmentʹs budget deficit function. Other things being equal, an autonomous increase in government purchases causes the budget deficit function.
A) an upward movement along
B) a downward movement along
C) an upward shift of
D) a downward shift of
E) no change in
A) an upward movement along
B) a downward movement along
C) an upward shift of
D) a downward shift of
E) no change in
Unlock Deck
Unlock for access to all 129 flashcards in this deck.
Unlock Deck
k this deck
57
Consider the governmentʹs budget deficit function, graphed with dollars on the vertical axis and real GDP on the horizontal axis. This function is downward sloping because as real GDP
A) falls, the budget deficit function shifts down.
B) falls, tax revenues rise, decreasing the deficit or increasing the surplus.
C) rises, tax revenues rise, decreasing the deficit or increasing the surplus.
D) rises, tax revenues fall, decreasing the deficit or increasing the surplus.
E) rises, it leads to increasing debt-service payments.
Unlock Deck
Unlock for access to all 129 flashcards in this deck.
Unlock Deck
k this deck
58
Consider the budget deficit function. With an unchanged fiscal policy by government, an increase in national income causes the budget deficit function.
A) an upward movement along
B) a downward movement along
C) an upward shift of
D) a downward shift of
E) a downward rotation in
A) an upward movement along
B) a downward movement along
C) an upward shift of
D) a downward shift of
E) a downward rotation in
Unlock Deck
Unlock for access to all 129 flashcards in this deck.
Unlock Deck
k this deck
59
The table below shows government purchases G), net tax revenues T), and debt-service payments iD) over a 4-year period for a hypothetical economy. All figures are in billions of dollars. Assume the stock of debt at the end of 2012 is $500 billion. TABLE 31-1
The Canadian federal government had a budget surplus each year from until 2008.
A) 1945
B) 1967
C) 1987
D) 1998
E) 2000
TABLE 31-1The Canadian federal government had a budget surplus each year from until 2008.
A) 1945
B) 1967
C) 1987
D) 1998
E) 2000
Unlock Deck
Unlock for access to all 129 flashcards in this deck.
Unlock Deck
k this deck
60
The diagram below shows the budget deficit function for a government in a hypothetical economy.
FIGURE 31-1
Refer to Figure 31-1. Initially, suppose real GDP is $100 million and the budget deficit is $4 million, as shown by point A. If the government implements an expansionary fiscal policy by decreasing lump -sum taxes, then
A) the budget deficit function would shift up.
B) the budget deficit function would shift down.
C) the budget deficit function would become steeper.
D) the budget deficit function would become flatter.
E) the size of the budget deficit would decrease as we move from point A to point B.
FIGURE 31-1Refer to Figure 31-1. Initially, suppose real GDP is $100 million and the budget deficit is $4 million, as shown by point A. If the government implements an expansionary fiscal policy by decreasing lump -sum taxes, then
A) the budget deficit function would shift up.
B) the budget deficit function would shift down.
C) the budget deficit function would become steeper.
D) the budget deficit function would become flatter.
E) the size of the budget deficit would decrease as we move from point A to point B.
Unlock Deck
Unlock for access to all 129 flashcards in this deck.
Unlock Deck
k this deck
61
The data below provides the Actual and Structural Budget Deficits, as a percentage of real GDP, for Canada between 1999 and 2010. Note that a negative value in the table indicates a budget surplus.
TABLE 31-2
Refer to Table 31-2. Based on the data in the table, in which of the following years was output greater than potential?
A) 1999
B) 2004
C) 2000
D) 2008
E) 2010
TABLE 31-2Refer to Table 31-2. Based on the data in the table, in which of the following years was output greater than potential?
A) 1999
B) 2004
C) 2000
D) 2008
E) 2010
Unlock Deck
Unlock for access to all 129 flashcards in this deck.
Unlock Deck
k this deck
62
Consider a government with a positive stock of debt, and suppose the real interest rate on government bonds equals the rate of growth of real GDP. In this case, the governmentʹs debt-to-GDP ratio will rise only if
A) the debt-to-GDP ratio is already high.
B) the primary budget surplus exceeds the overall budget surplus.
C) the real interest rate is high.
D) there is an overall budget deficit.
E) there is a primary budget deficit.
A) the debt-to-GDP ratio is already high.
B) the primary budget surplus exceeds the overall budget surplus.
C) the real interest rate is high.
D) there is an overall budget deficit.
E) there is a primary budget deficit.
Unlock Deck
Unlock for access to all 129 flashcards in this deck.
Unlock Deck
k this deck
63
Consider changes in the governmentʹs debt-to-GDP ratio. Suppose that over a one year period the government has a primary budget surplus, and the real interest rate on government bonds is higher than the growth rate of real GDP. What is the effect on the debt-to-GDP ratio?
A) it will rise
B) it will fall
C) uncertain - it is necessary to know the relative size of the different effects
D) it will remain stable - the two effects cancel each other out
A) it will rise
B) it will fall
C) uncertain - it is necessary to know the relative size of the different effects
D) it will remain stable - the two effects cancel each other out
Unlock Deck
Unlock for access to all 129 flashcards in this deck.
Unlock Deck
k this deck
64
The diagram below shows two budget deficit functions for a hypothetical economy.
FIGURE 31-2
Refer to Figure 31-2. Initially, suppose the economy is at point A on budget deficit function B0. Real GDP Y) is
$100 million. If the level of potential output Y*) were $300 million, the structural budget deficit would be
A) $4 million.
B) $6.5 million.
C) $7.5 million.
D) $14 million.
E) Insufficient information to know.
FIGURE 31-2Refer to Figure 31-2. Initially, suppose the economy is at point A on budget deficit function B0. Real GDP Y) is
$100 million. If the level of potential output Y*) were $300 million, the structural budget deficit would be
A) $4 million.
B) $6.5 million.
C) $7.5 million.
D) $14 million.
E) Insufficient information to know.
Unlock Deck
Unlock for access to all 129 flashcards in this deck.
Unlock Deck
k this deck
65
The diagram below shows two budget deficit functions for a hypothetical economy.
FIGURE 31-2
Refer to Figure 31-2. Initially, suppose the economy is at point A on budget deficit function B0. Real GDP Y) is
$100 million. If the government implements a fiscal policy that causes the budget deficit function to shift to B1, we can conclude that the policy was and the structural deficit will be than previously.
A) expansionary; smaller
B) expansionary; larger
C) contractionary; larger
D) contractionary; smaller
FIGURE 31-2Refer to Figure 31-2. Initially, suppose the economy is at point A on budget deficit function B0. Real GDP Y) is
$100 million. If the government implements a fiscal policy that causes the budget deficit function to shift to B1, we can conclude that the policy was and the structural deficit will be than previously.
A) expansionary; smaller
B) expansionary; larger
C) contractionary; larger
D) contractionary; smaller
Unlock Deck
Unlock for access to all 129 flashcards in this deck.
Unlock Deck
k this deck
66
Consider the following variables, defined as follows: d = debt-to-GDP ratio
X = primary budget deficit as a percentage of GDP r = real interest rate on government bonds
G = growth rate of real GDP
Which of the following expressions correctly describes the change in the debt-to-GDP ratio?
A) Δd = x + r - g) + d
B) Δd = x + r - g) × d
C) Δd = xr - g) + d
D) Δd = xg - r) - d
E) Δd = x + g - r) × d
Unlock Deck
Unlock for access to all 129 flashcards in this deck.
Unlock Deck
k this deck
67
The diagram below shows two budget deficit functions for a hypothetical economy.
FIGURE 31-2
Refer to Figure 31-2. Initially, suppose the economy is at point A on budget deficit function B0. Real GDP Y) is
$100 million. If the level of potential output Y*) were $400 million, the structural budget deficit would be
A) $14 million.
B) $4 million.
C) negative.
D) -$10 million.
E) $0.
FIGURE 31-2Refer to Figure 31-2. Initially, suppose the economy is at point A on budget deficit function B0. Real GDP Y) is
$100 million. If the level of potential output Y*) were $400 million, the structural budget deficit would be
A) $14 million.
B) $4 million.
C) negative.
D) -$10 million.
E) $0.
Unlock Deck
Unlock for access to all 129 flashcards in this deck.
Unlock Deck
k this deck
68
The data below provides the Actual and Structural Budget Deficits, as a percentage of real GDP, for Canada between 1999 and 2010. Note that a negative value in the table indicates a budget surplus.
TABLE 31-2
Refer to Table 31-2. Based on the data in the table, over which of the following intervals was fiscal policy expansionary?
A) 1999-2003 because the structural budget deficit is falling
B) 1999-2003 because the structural budget deficit is rising
C) 2008-2010 because the actual deficit is greater than zero
D) 2004-2007 because the structural budget deficit is fairly stable
TABLE 31-2Refer to Table 31-2. Based on the data in the table, over which of the following intervals was fiscal policy expansionary?
A) 1999-2003 because the structural budget deficit is falling
B) 1999-2003 because the structural budget deficit is rising
C) 2008-2010 because the actual deficit is greater than zero
D) 2004-2007 because the structural budget deficit is fairly stable
Unlock Deck
Unlock for access to all 129 flashcards in this deck.
Unlock Deck
k this deck
69
Suppose the change in the governmentʹs debt-to-GDP ratio in a given year is 0.026. This figure tells us that the governmentʹs debt-to-GDP ratio has
A) fallen by 0.026%.
B) risen by 0.026%.
C) risen by 2.6 percentage points.
D) fallen by 2.6 percentage points.
E) risen by 0.026 percentage points.
A) fallen by 0.026%.
B) risen by 0.026%.
C) risen by 2.6 percentage points.
D) fallen by 2.6 percentage points.
E) risen by 0.026 percentage points.
Unlock Deck
Unlock for access to all 129 flashcards in this deck.
Unlock Deck
k this deck
70
The data below provides the Actual and Structural Budget Deficits, as a percentage of real GDP, for Canada between 1999 and 2010. Note that a negative value in the table indicates a budget surplus.
TABLE 31-2
Refer to Table 31-2. Consider the years 2008-2010. The fact that the actual budget deficit in each year was greater than the structural budget deficit reflects the fact that
A) output was equal to potential.
B) fiscal policy was contractionary over that time.
C) fiscal policy was expansionary over that time.
D) actual GDP was less than potential in each of those years.
E) actual GDP was greater than potential in each of those years.
TABLE 31-2Refer to Table 31-2. Consider the years 2008-2010. The fact that the actual budget deficit in each year was greater than the structural budget deficit reflects the fact that
A) output was equal to potential.
B) fiscal policy was contractionary over that time.
C) fiscal policy was expansionary over that time.
D) actual GDP was less than potential in each of those years.
E) actual GDP was greater than potential in each of those years.
Unlock Deck
Unlock for access to all 129 flashcards in this deck.
Unlock Deck
k this deck
71
Consider a government with a positive stock of debt. If the growth rate of real GDP exceeds the real rate of interest on government bonds, then to keep the debt-to-GDP ratio constant the
A) government must have a primary budget deficit.
B) government must have a primary budget surplus.
C) government must implement an expansionary fiscal policy.
D) money supply should be increased at a constant rate.
E) nominal interest rate must be constant.
A) government must have a primary budget deficit.
B) government must have a primary budget surplus.
C) government must implement an expansionary fiscal policy.
D) money supply should be increased at a constant rate.
E) nominal interest rate must be constant.
Unlock Deck
Unlock for access to all 129 flashcards in this deck.
Unlock Deck
k this deck
72
The diagram below shows two budget deficit functions for a hypothetical economy.
FIGURE 31-2
The governmentʹs structural budget deficit is the budget deficit that would exist
A) if real GDP were equal to potential GDP.
B) with taxes and expenditures measured at the equilibrium level of GDP.
C) if policy were changed to eliminate the business cycle.
D) if tax rates were set to maximize tax revenues.
E) if there were no discretionary fiscal interventions in the economy.
FIGURE 31-2The governmentʹs structural budget deficit is the budget deficit that would exist
A) if real GDP were equal to potential GDP.
B) with taxes and expenditures measured at the equilibrium level of GDP.
C) if policy were changed to eliminate the business cycle.
D) if tax rates were set to maximize tax revenues.
E) if there were no discretionary fiscal interventions in the economy.
Unlock Deck
Unlock for access to all 129 flashcards in this deck.
Unlock Deck
k this deck
73
The data below provides the Actual and Structural Budget Deficits, as a percentage of real GDP, for Canada between 1999 and 2010. Note that a negative value in the table indicates a budget surplus.
TABLE 31-2
Refer to Table 31-2. Consider the year 2004. Based on the data in the table we can conclude that
A) fiscal policy was expansionary in that year.
B) real output was less than potential in that year.
C) real output was equal to potential in that year.
D) real output was greater than potential in that year.
E) monetary policy was expansionary in that year.
TABLE 31-2Refer to Table 31-2. Consider the year 2004. Based on the data in the table we can conclude that
A) fiscal policy was expansionary in that year.
B) real output was less than potential in that year.
C) real output was equal to potential in that year.
D) real output was greater than potential in that year.
E) monetary policy was expansionary in that year.
Unlock Deck
Unlock for access to all 129 flashcards in this deck.
Unlock Deck
k this deck
74
The diagram below shows two budget deficit functions for a hypothetical economy.
FIGURE 31-2
Suppose the governmentʹs actual budget deficit is equal to the structural budget deficit. Then it must be the case that
A) the primary budget deficit is zero.
B) the overall government budget is balanced.
C) the debt-to-GDP ratio is stable.
D) real GDP is equal to potential GDP.
E) the government is not reporting all of its expenses.
FIGURE 31-2Suppose the governmentʹs actual budget deficit is equal to the structural budget deficit. Then it must be the case that
A) the primary budget deficit is zero.
B) the overall government budget is balanced.
C) the debt-to-GDP ratio is stable.
D) real GDP is equal to potential GDP.
E) the government is not reporting all of its expenses.
Unlock Deck
Unlock for access to all 129 flashcards in this deck.
Unlock Deck
k this deck
75
The diagram below shows two budget deficit functions for a hypothetical economy.
FIGURE 31-2
Refer to Figure 31-2. Initially, suppose the economy is at point A on budget deficit function B0. Real GDP Y) is
$100 million. If the level of potential output Y*) were $300 million, the cyclical component of the actual budget deficit would be
A) $4 million.
B) $6.5 million.
C) $7.5 million.
D) $14 million.
E) Insufficient information to know.
FIGURE 31-2Refer to Figure 31-2. Initially, suppose the economy is at point A on budget deficit function B0. Real GDP Y) is
$100 million. If the level of potential output Y*) were $300 million, the cyclical component of the actual budget deficit would be
A) $4 million.
B) $6.5 million.
C) $7.5 million.
D) $14 million.
E) Insufficient information to know.
Unlock Deck
Unlock for access to all 129 flashcards in this deck.
Unlock Deck
k this deck
76
Suppose the real interest rate on government bonds is 5% while the growth rate of real GDP is 4%, and that the governmentʹs current debt-to-GDP ratio is 30%. If the government has a primary budget balance of zero in the current year, the debt-to-GDP ratio will
A) rise by 3.0 percentage points.
B) rise by 0.3 percentage points.
C) remain unchanged.
D) fall by 3.0 percentage points.
E) fall by 0.3 percentage points.
A) rise by 3.0 percentage points.
B) rise by 0.3 percentage points.
C) remain unchanged.
D) fall by 3.0 percentage points.
E) fall by 0.3 percentage points.
Unlock Deck
Unlock for access to all 129 flashcards in this deck.
Unlock Deck
k this deck
77
The diagram below shows two budget deficit functions for a hypothetical economy.
FIGURE 31-2
If the economy goes into a recession, the structural budget deficit is most likely to
A) increase, because government expenditures and tax revenues will both rise.
B) increase, because government expenditures will rise and tax revenues will decline.
C) remain unchanged, although there will be a primary budget surplus.
D) remain unchanged, unless government actively changes its fiscal policy.
E) decrease, because government expenditures will decrease and tax revenues will rise.
FIGURE 31-2If the economy goes into a recession, the structural budget deficit is most likely to
A) increase, because government expenditures and tax revenues will both rise.
B) increase, because government expenditures will rise and tax revenues will decline.
C) remain unchanged, although there will be a primary budget surplus.
D) remain unchanged, unless government actively changes its fiscal policy.
E) decrease, because government expenditures will decrease and tax revenues will rise.
Unlock Deck
Unlock for access to all 129 flashcards in this deck.
Unlock Deck
k this deck
78
The diagram below shows two budget deficit functions for a hypothetical economy.
FIGURE 31-2
The best measure of the change in the stance of a governmentʹs fiscal policy is
A) the actual budget deficit.
B) the cyclically adjusted deficit.
C) the change in the structural budget deficit.
D) the change in the actual budget deficit.
E) the change in the primary budget deficit.
FIGURE 31-2The best measure of the change in the stance of a governmentʹs fiscal policy is
A) the actual budget deficit.
B) the cyclically adjusted deficit.
C) the change in the structural budget deficit.
D) the change in the actual budget deficit.
E) the change in the primary budget deficit.
Unlock Deck
Unlock for access to all 129 flashcards in this deck.
Unlock Deck
k this deck
79
The diagram below shows two budget deficit functions for a hypothetical economy.
FIGURE 31-2
The governmentʹs structural budget deficit adjusts for
A) any primary budget surplus or deficit incurred by the federal government.
B) changes in investment to smooth fluctuations in national income.
C) changes in spending or tax revenues caused by deviations in national income from potential output.
D) increases in the money supply in excess of the real growth in the economy.
E) interest rate changes that affect the absolute amount of debt-service payments.
FIGURE 31-2The governmentʹs structural budget deficit adjusts for
A) any primary budget surplus or deficit incurred by the federal government.
B) changes in investment to smooth fluctuations in national income.
C) changes in spending or tax revenues caused by deviations in national income from potential output.
D) increases in the money supply in excess of the real growth in the economy.
E) interest rate changes that affect the absolute amount of debt-service payments.
Unlock Deck
Unlock for access to all 129 flashcards in this deck.
Unlock Deck
k this deck
80
The diagram below shows two budget deficit functions for a hypothetical economy.
FIGURE 31-2
Refer to Figure 31-2. Initially, suppose the economy is at point A on budget deficit function B0. Real GDP Y) is
$100 million. If the level of potential output Y*) were $300 million, how much of the actual budget deficit is due to the underlying structure of fiscal policy and is therefore independent of the current level of GDP?
A) $4 million.
B) $6.5 million.
C) $7.5 million.
D) $14 million.
E) Insufficient information to know.
FIGURE 31-2Refer to Figure 31-2. Initially, suppose the economy is at point A on budget deficit function B0. Real GDP Y) is
$100 million. If the level of potential output Y*) were $300 million, how much of the actual budget deficit is due to the underlying structure of fiscal policy and is therefore independent of the current level of GDP?
A) $4 million.
B) $6.5 million.
C) $7.5 million.
D) $14 million.
E) Insufficient information to know.
Unlock Deck
Unlock for access to all 129 flashcards in this deck.
Unlock Deck
k this deck
Unlock Deck
Unlock for access to all 129 flashcards in this deck.


