Deck 2: Describing the Distribution of a Variable
Full screen (f)
Question
Question
Question
Question
Question
Question
Question
Question
Question
Question
Question
Question
Question
Question
Question
Question
Question
Question
Question
Question
Question
Question
Question
Question
Question
Question
Question
Question
Question
Question
Question
Question
Question
Question
Question
Question
Question
Question
Question
Question
Question
Question
Question
Question
Question
Question
Question
Question
Question
Question
Question
Question
Question
Question
Question
Question
Question
Question
Question
Question
Question
Question
Question
Researchers are conducting a review of the "war against poverty" in the latter half of the twentieth century.As part of their analysis,the proportion of Americans under the age of 18 who lived below the poverty line for each of the years 1959 through 2000 is used to generate the following time series plot.
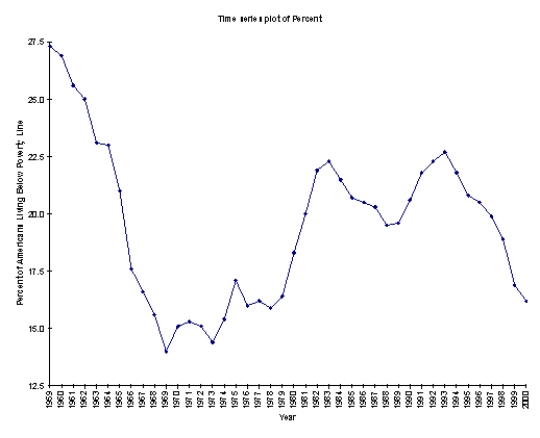 How successful was the United States in its efforts to win "the war against poverty" during the 90's?
How successful was the United States in its efforts to win "the war against poverty" during the 90's? Question
Question
Question
Question
Question
Question
Question
Question
Question
Question
An operations management professor is interested in how her students performed on her midterm exam.The histogram shown below represents the distribution of exam scores (where the maximum score is 100)for 50 students.
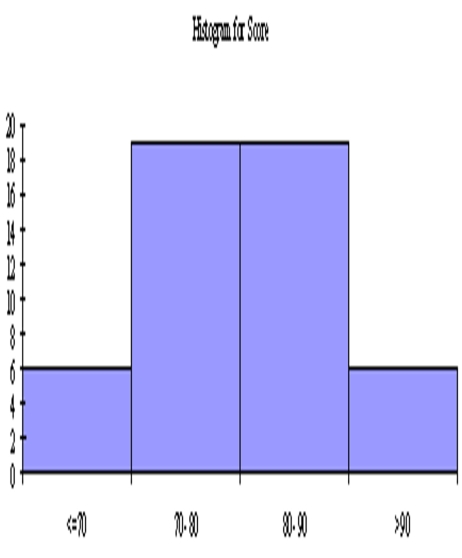
Based on this histogram,how would you characterize the students' performance on this exam?
Based on this histogram,how would you characterize the students' performance on this exam?

Unlock Deck
Sign up to unlock the cards in this deck!
Unlock Deck
Unlock Deck
1/73
Play
Full screen (f)
Deck 2: Describing the Distribution of a Variable
1
A histogram is used to display categorical data.
True
2
Using dummy variables is an efficient way of determining counts of categorical variables.
True
3
A distribution of a numerical variable with no skewness is said to be symmetric.
True
4
Categorical variables can be classified as either discrete or continuous.
Unlock Deck
Unlock for access to all 73 flashcards in this deck.
Unlock Deck
k this deck
5
A data set is typically a rectangular array of data,with observations in columns and variables in rows.
Unlock Deck
Unlock for access to all 73 flashcards in this deck.
Unlock Deck
k this deck
6
Age,height,and weight are examples of numerical data.
Unlock Deck
Unlock for access to all 73 flashcards in this deck.
Unlock Deck
k this deck
7
Cross-sectional data are data on a population at a distinct point in time,whereas time series data are data collected over time.
Unlock Deck
Unlock for access to all 73 flashcards in this deck.
Unlock Deck
k this deck
8
Phone numbers,Social Security numbers,and zip codes are typically treated as numerical variables.
Unlock Deck
Unlock for access to all 73 flashcards in this deck.
Unlock Deck
k this deck
9
Both ordinal and nominal variables are categorical.
Unlock Deck
Unlock for access to all 73 flashcards in this deck.
Unlock Deck
k this deck
10
The number of car insurance policy holders is an example of a discrete numerical variable.
Unlock Deck
Unlock for access to all 73 flashcards in this deck.
Unlock Deck
k this deck
11
A population includes all elements or objects of interest in a study,whereas a sample is a subset of the population used to gain insights into the characteristics of the population.
Unlock Deck
Unlock for access to all 73 flashcards in this deck.
Unlock Deck
k this deck
12
A variable (or field or attribute)is a characteristic of members of a population,whereas an observation (or case or record)is a list of all variable values for a single member of a population.
Unlock Deck
Unlock for access to all 73 flashcards in this deck.
Unlock Deck
k this deck
13
Two common ways of displaying categorical data is column charts and pie charts.
Unlock Deck
Unlock for access to all 73 flashcards in this deck.
Unlock Deck
k this deck
14
Suppose that a sample of 10 observations has a standard deviation of 3.Then the sum of the squared deviations from the sample mean is 30.
Unlock Deck
Unlock for access to all 73 flashcards in this deck.
Unlock Deck
k this deck
15
A distribution with a high kurtosis has almost all of its observations within three standard deviations of the mean.
Unlock Deck
Unlock for access to all 73 flashcards in this deck.
Unlock Deck
k this deck
16
All nominal data may be treated as ordinal data.
Unlock Deck
Unlock for access to all 73 flashcards in this deck.
Unlock Deck
k this deck
17
The median of a data set with 30 values would be the average of the 15th and the 16th values when the data values are arranged in ascending order.
Unlock Deck
Unlock for access to all 73 flashcards in this deck.
Unlock Deck
k this deck
18
Data can be categorized as cross-sectional or time series.
Unlock Deck
Unlock for access to all 73 flashcards in this deck.
Unlock Deck
k this deck
19
The only meaningful way to summarize categorical data is with counts of observations in the categories.
Unlock Deck
Unlock for access to all 73 flashcards in this deck.
Unlock Deck
k this deck
20
As a graphical tool,the histogram is ideal for showing whether the distribution of a numerical variable is symmetric or skewed.
Unlock Deck
Unlock for access to all 73 flashcards in this deck.
Unlock Deck
k this deck
21
In an extremely right-skewed distribution,the mean is less than the median.
Unlock Deck
Unlock for access to all 73 flashcards in this deck.
Unlock Deck
k this deck
22
Because they represent such extreme values,outliers should always be eliminated from statistical analyses.
Unlock Deck
Unlock for access to all 73 flashcards in this deck.
Unlock Deck
k this deck
23
The core purpose of time series graphs is to detect historical patterns in the data.
Unlock Deck
Unlock for access to all 73 flashcards in this deck.
Unlock Deck
k this deck
24
The value of the mean times the number of observations equals the sum of all of the data values.
Unlock Deck
Unlock for access to all 73 flashcards in this deck.
Unlock Deck
k this deck
25
If a histogram of a data set is symmetric and bell shaped,with a mean of 75 and standard deviation of 10.Then,approximately 95% of the data values will be between 55 and 95.
Unlock Deck
Unlock for access to all 73 flashcards in this deck.
Unlock Deck
k this deck
26
A histogram is based on binning the variable,which means putting the values of the numeric variable into discrete categories.
Unlock Deck
Unlock for access to all 73 flashcards in this deck.
Unlock Deck
k this deck
27
In order for the characteristics of a sample to be generalized to the entire population,the sample should be _____ the population.
A)symbolic of
B)opposite of
C)representative of
D)different from
A)symbolic of
B)opposite of
C)representative of
D)different from
Unlock Deck
Unlock for access to all 73 flashcards in this deck.
Unlock Deck
k this deck
28
A sample of 8 observations with a sample standard deviation of 2.50 has a sample variance of 17.50.
Unlock Deck
Unlock for access to all 73 flashcards in this deck.
Unlock Deck
k this deck
29
Coding males as 1 and females as 0 in a data set illustrates the use of _____ variables.
A)nominal
B)dummy
C)numerical
D)ordinal
A)nominal
B)dummy
C)numerical
D)ordinal
Unlock Deck
Unlock for access to all 73 flashcards in this deck.
Unlock Deck
k this deck
30
Researchers may try to gain insight into the characteristics of a population by examining a(n)_____ from the population.
A)model
B)sample
C)exemplar
D)replica
A)model
B)sample
C)exemplar
D)replica
Unlock Deck
Unlock for access to all 73 flashcards in this deck.
Unlock Deck
k this deck
31
Mean absolute deviation (MAD)is the average of the squared deviations.
Unlock Deck
Unlock for access to all 73 flashcards in this deck.
Unlock Deck
k this deck
32
The difference between the largest and smallest values in a data set is called the range.
Unlock Deck
Unlock for access to all 73 flashcards in this deck.
Unlock Deck
k this deck
33
Abby has been keeping track of what she spends to stream movies.The last seven week's expenditures,in dollars,were 6,4,8,9,6,12,and 4.The mean amount Abby spent streaming movies over these 7 weeks is $7.
Unlock Deck
Unlock for access to all 73 flashcards in this deck.
Unlock Deck
k this deck
34
The mean is a measure of central tendency.
Unlock Deck
Unlock for access to all 73 flashcards in this deck.
Unlock Deck
k this deck
35
Unlike histograms,box plots depict only one aspect of a variable.
Unlock Deck
Unlock for access to all 73 flashcards in this deck.
Unlock Deck
k this deck
36
A sample,selected from a population,taken at one particular point in time is categorized as
A)categorical.
B)discrete.
C)cross-sectional.
D)time-series.
A)categorical.
B)discrete.
C)cross-sectional.
D)time-series.
Unlock Deck
Unlock for access to all 73 flashcards in this deck.
Unlock Deck
k this deck
37
Gender and states of residence are examples of ____ data.
A)discrete
B)continuous
C)categorical
D)ordinal
A)discrete
B)continuous
C)categorical
D)ordinal
Unlock Deck
Unlock for access to all 73 flashcards in this deck.
Unlock Deck
k this deck
38
The median is one of the most frequently used measures of variability.
Unlock Deck
Unlock for access to all 73 flashcards in this deck.
Unlock Deck
k this deck
39
Time series graphs chart the values of one or more time series,using time on the vertical axis.
Unlock Deck
Unlock for access to all 73 flashcards in this deck.
Unlock Deck
k this deck
40
There are four quartiles that divide the values in a data set into four equal parts.
Unlock Deck
Unlock for access to all 73 flashcards in this deck.
Unlock Deck
k this deck
41
Which measure of variability is defined as the maximum value of a data set minus the minimum value of a data set?
A)Variance
B)Standard deviation
C)Interquartile range
D)Range
A)Variance
B)Standard deviation
C)Interquartile range
D)Range
Unlock Deck
Unlock for access to all 73 flashcards in this deck.
Unlock Deck
k this deck
42
The mean of a data set is 75 and one observation has the value of 65.What is the squared deviation of the observation,65,from the mean?
A)100
B)20
C)400
D)10
A)100
B)20
C)400
D)10
Unlock Deck
Unlock for access to all 73 flashcards in this deck.
Unlock Deck
k this deck
43
Which of the following characteristics can be used to describe the skewness of a distribution?
A)The mean
B)Kurtosis
C)The median
D)The standard deviation
A)The mean
B)Kurtosis
C)The median
D)The standard deviation
Unlock Deck
Unlock for access to all 73 flashcards in this deck.
Unlock Deck
k this deck
44
The length of the box in the box plot portrays the
A)mean.
B)median.
C)range.
D)interquartile range.
A)mean.
B)median.
C)range.
D)interquartile range.
Unlock Deck
Unlock for access to all 73 flashcards in this deck.
Unlock Deck
k this deck
45
Data that arise from counts are best described as _____ data.
A)continuous
B)nominal
C)counted
D)discrete
A)continuous
B)nominal
C)counted
D)discrete
Unlock Deck
Unlock for access to all 73 flashcards in this deck.
Unlock Deck
k this deck
46
The mode is best described as the
A)middle observation.
B)same as the average.
C)50th percentile.
D)most frequently occurring value.
A)middle observation.
B)same as the average.
C)50th percentile.
D)most frequently occurring value.
Unlock Deck
Unlock for access to all 73 flashcards in this deck.
Unlock Deck
k this deck
47
The median can also be described as the
A)middle observation when the data values are arranged in ascending order.
B)best estimate of the variability in a skewed distribution.
C)second percentile.
D)the average of all values.
A)middle observation when the data values are arranged in ascending order.
B)best estimate of the variability in a skewed distribution.
C)second percentile.
D)the average of all values.
Unlock Deck
Unlock for access to all 73 flashcards in this deck.
Unlock Deck
k this deck
48
The difference between the first and third quartile is called the
A)interquartile range.
B)range.
C)standard deviation.
D)variance.
A)interquartile range.
B)range.
C)standard deviation.
D)variance.
Unlock Deck
Unlock for access to all 73 flashcards in this deck.
Unlock Deck
k this deck
49
The daily closing values of the Dow Jones Industrial Average over a period of 30 days are best described as _____ data.
A)cross-sectional
B)discrete
C)time-series
D)nominal
A)cross-sectional
B)discrete
C)time-series
D)nominal
Unlock Deck
Unlock for access to all 73 flashcards in this deck.
Unlock Deck
k this deck
50
What are the three most common measures of central tendency?
A)Mean,median,and mode
B)Mean,variance,and standard deviation
C)Mean,median,and variance
D)Mean,median,and standard deviation
A)Mean,median,and mode
B)Mean,variance,and standard deviation
C)Mean,median,and variance
D)Mean,median,and standard deviation
Unlock Deck
Unlock for access to all 73 flashcards in this deck.
Unlock Deck
k this deck
51
Categorizing a numeric age variable as "young," "middle-aged," and "elderly" is an example of
A)counting.
B)ordering.
C)quantifying.
D)binning.
A)counting.
B)ordering.
C)quantifying.
D)binning.
Unlock Deck
Unlock for access to all 73 flashcards in this deck.
Unlock Deck
k this deck
52
What is the most common type of chart for showing the distribution of a numerical variable?
A)Column chart
B)Histogram
C)Two-way table
D)Pie chart
A)Column chart
B)Histogram
C)Two-way table
D)Pie chart
Unlock Deck
Unlock for access to all 73 flashcards in this deck.
Unlock Deck
k this deck
53
A variable is classified as ordinal if
A)there is a natural ordering of categories.
B)the data is randomly selected.
C)the data arise from continuous measurements.
D)we track the variable through a period of time.
A)there is a natural ordering of categories.
B)the data is randomly selected.
C)the data arise from continuous measurements.
D)we track the variable through a period of time.
Unlock Deck
Unlock for access to all 73 flashcards in this deck.
Unlock Deck
k this deck
54
Which statement is true for the following data values: 7,5,6,4,7,8,and 12?
A)The mean,median,and mode are all equal.
B)Only the mean and median are equal.
C)Only the mean and mode are equal.
D)Only the median and mode are equal.
A)The mean,median,and mode are all equal.
B)Only the mean and median are equal.
C)Only the mean and mode are equal.
D)Only the median and mode are equal.
Unlock Deck
Unlock for access to all 73 flashcards in this deck.
Unlock Deck
k this deck
55
If a value represents the 95th percentile,this means that 95% of all values in the data set are _____this value.
A)less than or equal to
B)greater than
C)less than
D)greater than or equal to
E)different than
A)less than or equal to
B)greater than
C)less than
D)greater than or equal to
E)different than
Unlock Deck
Unlock for access to all 73 flashcards in this deck.
Unlock Deck
k this deck
56
With symmetric,"bell-shaped" distributions,approximately what percent of the observations are within two standard deviations of the mean?
A)50%
B)68%
C)95%
D)99.7%
A)50%
B)68%
C)95%
D)99.7%
Unlock Deck
Unlock for access to all 73 flashcards in this deck.
Unlock Deck
k this deck
57
The average score for a class of 30 students was 75.The 20 male students in the class averaged 70.The average score of the 10 female students in the class is _____ the males.
A)the same as
B)greater than
C)significantly less than
D)little less than
A)the same as
B)greater than
C)significantly less than
D)little less than
Unlock Deck
Unlock for access to all 73 flashcards in this deck.
Unlock Deck
k this deck
58
If the number of observations in a single-variable data set is even,the median is the
A)average of the two middle observations.
B)difference between the two middle observations.
C)most frequent observation.
D)difference between the highest and smallest observation.
A)average of the two middle observations.
B)difference between the two middle observations.
C)most frequent observation.
D)difference between the highest and smallest observation.
Unlock Deck
Unlock for access to all 73 flashcards in this deck.
Unlock Deck
k this deck
59
A histogram that is positively skewed may also be described as
A)skewed to the right.
B)skewed to the left.
C)balanced.
D)symmetric.
A)skewed to the right.
B)skewed to the left.
C)balanced.
D)symmetric.
Unlock Deck
Unlock for access to all 73 flashcards in this deck.
Unlock Deck
k this deck
60
The interquartile range (IQR)encompasses what percent of the observations?
A)Lower 25%
B)Middle 50%
C)Upper 75%
D)Upper 90%
A)Lower 25%
B)Middle 50%
C)Upper 75%
D)Upper 90%
Unlock Deck
Unlock for access to all 73 flashcards in this deck.
Unlock Deck
k this deck
61
Where will you find "time" on a time series graph?
A)horizontal axis
B)first column
C)vertical axis
D)last column
A)horizontal axis
B)first column
C)vertical axis
D)last column
Unlock Deck
Unlock for access to all 73 flashcards in this deck.
Unlock Deck
k this deck
62
Which of the states listed paid their teachers average salaries that are below 75% of all average salaries?
Unlock Deck
Unlock for access to all 73 flashcards in this deck.
Unlock Deck
k this deck
63
Researchers are conducting a review of the "war against poverty" in the latter half of the twentieth century.As part of their analysis,the proportion of Americans under the age of 18 who lived below the poverty line for each of the years 1959 through 2000 is used to generate the following time series plot.
How successful was the United States in its efforts to win "the war against poverty" during the 90's?
How successful was the United States in its efforts to win "the war against poverty" during the 90's? Unlock Deck
Unlock for access to all 73 flashcards in this deck.
Unlock Deck
k this deck
64
Without performing any calculations,which of the following data sets has the greatest sample standard deviation?
A)1,2,3,4,5,6
B)1,1,3,5,5,6
C)3,3,3,3,3,3
D)1,1,1,5,5,5
E)1,1,3,3,6,6
A)1,2,3,4,5,6
B)1,1,3,5,5,6
C)3,3,3,3,3,3
D)1,1,1,5,5,5
E)1,1,3,3,6,6
Unlock Deck
Unlock for access to all 73 flashcards in this deck.
Unlock Deck
k this deck
65
Are the empirical rules applicable in this case? If so,apply them and interpret your results.If not,explain why the empirical rules are not applicable here.
Unlock Deck
Unlock for access to all 73 flashcards in this deck.
Unlock Deck
k this deck
66
Expressed in percentiles,the interquartile range is the difference between the _____ percentiles.
A)10th and 60th
B)15th and 65th
C)20th and 70th
D)25th and 75th
A)10th and 60th
B)15th and 65th
C)20th and 70th
D)25th and 75th
Unlock Deck
Unlock for access to all 73 flashcards in this deck.
Unlock Deck
k this deck
67
In a box plot,the asterisk inside the box indicates the location of the
A)mean.
B)median.
C)minimum value.
D)maximum value.
A)mean.
B)median.
C)minimum value.
D)maximum value.
Unlock Deck
Unlock for access to all 73 flashcards in this deck.
Unlock Deck
k this deck
68
A political figure running for re-election claimed that the country was better off in 2014 than in 2019,because the average income decreased.Do you agree?
Unlock Deck
Unlock for access to all 73 flashcards in this deck.
Unlock Deck
k this deck
69
In a box plot,the vertical line inside the box indicates the location of the
A)mean.
B)median.
C)mode.
D)standard deviation.
A)mean.
B)median.
C)mode.
D)standard deviation.
Unlock Deck
Unlock for access to all 73 flashcards in this deck.
Unlock Deck
k this deck
70
Approximately,how large must a male's salary be to qualify as an outlier on the high side? How many outliers are there in these data?
Unlock Deck
Unlock for access to all 73 flashcards in this deck.
Unlock Deck
k this deck
71
Generate parallel box plots to summarize the data.What do the box plots indicate?
Unlock Deck
Unlock for access to all 73 flashcards in this deck.
Unlock Deck
k this deck
72
Which of the states listed paid their teachers average salaries that exceed at least 75% of all average salaries?
Unlock Deck
Unlock for access to all 73 flashcards in this deck.
Unlock Deck
k this deck
73
An operations management professor is interested in how her students performed on her midterm exam.The histogram shown below represents the distribution of exam scores (where the maximum score is 100)for 50 students.
Based on this histogram,how would you characterize the students' performance on this exam?
Based on this histogram,how would you characterize the students' performance on this exam?
Unlock Deck
Unlock for access to all 73 flashcards in this deck.
Unlock Deck
k this deck
Unlock Deck
Unlock for access to all 73 flashcards in this deck.


