Deck 10: Estimation and Hypothesis Testing: Two Populations
Full screen (f)
Question
Question
Question
Question
Question
Question
Question
Question
Question
Question
Question
Question
Question
Question
Question
Question
Question
Question
Question
Question
Question
Question
Question
Question
Question
Question
Question
Question
Question
Question
Question
Question
Question
Question
Question
Question
Question
Question
Question
Question
Question
Question
Question
Question
Suppose the following information comes from random samples from normal populations with means and ,respectively.
n1 = 13 s1 = 3.3
n2 = 17 s2 = 3
Using the data given,obtain a 95% confidence interval for the difference in means.Round your answer to three decimal places.
n1 = 13
s1 = 3.3n2 = 17
s2 = 3Using the data given,obtain a 95% confidence interval for the difference in means.Round your answer to three decimal places.
Question
Consider the following statistics associated with a productivity index.
 Do these data strongly indicate that the mean index for group 1 is lower than that for group 2? Test at level
  .Answer "Reject null hypothesis" or "Not reject null hypothesis".
Do these data strongly indicate that the mean index for group 1 is lower than that for group 2? Test at level .Answer "Reject null hypothesis" or "Not reject null hypothesis".
Unlock Deck
Sign up to unlock the cards in this deck!
Unlock Deck
Unlock Deck
1/45
Play
Full screen (f)
Deck 10: Estimation and Hypothesis Testing: Two Populations
1
Use the following to answer questions :
A sample of 31 male students and another sample of 33 female students from the same college produced mean G.P.As of 2.66 for the males and 2.89 for the females.Suppose that the standard deviations of the G.P.As are 0.71 for the males and 0.63 for the females.The null hypothesis is that the mean G.P.A's are the same for males and females,while the alternative hypothesis is that the mean G.P.A for males is less than the mean G.P.A for females.
What is the p-value for this test,rounded to four decimal places?
0.0857
2
Use the following to answer questions :
The mean weekly earnings of all female workers in a state is $710 and the mean weekly earnings of all male workers in the same state is $760.The standard deviations of the weekly earnings are $86 for the females and $106 for the males.Suppose we take one sample of 316 female workers and another sample of 329 male workers from this state.
What is the mean of the sampling distribution of the difference between the mean weekly earnings for females and males?
$-50
3
Use the following to answer questions :
A sample of 76 female workers and another sample of 48 male workers from a state produced mean weekly earnings of $743.50 for the females and $777.63 for the males.Suppose that the standard deviations of the weekly earnings are $80.05 for the females and $88.68 for the males.The null hypothesis is that the mean weekly earnings are the same for females and males,while the alternative hypothesis is that the mean weekly earnings for females is less than the mean weekly earnings for males.
What is the p-value for this test,rounded to four decimal places?
0.0151
4
Use the following to answer questions :
The mean job-related stress score for all corporate managers is 8.40 and the mean job-related stress score for all college professors is 5.95.The standard deviations of the job-related stress scores are 0.66 for the corporate managers and 0.82 for the college professors.Suppose we take one sample of 225 corporate managers and another sample of 167 college professors.
What is the standard deviation of the sampling distribution of the difference between the mean stress scores for corporate managers and college professors,rounded to four decimal places?
Unlock Deck
Unlock for access to all 45 flashcards in this deck.
Unlock Deck
k this deck
5
Use the following to answer questions :
A sample of 31 male students and another sample of 33 female students from the same college produced mean G.P.As of 2.66 for the males and 2.89 for the females.Suppose that the standard deviations of the G.P.As are 0.71 for the males and 0.63 for the females.The null hypothesis is that the mean G.P.A's are the same for males and females,while the alternative hypothesis is that the mean G.P.A for males is less than the mean G.P.A for females.
Do you reject or fail to reject the null hypothesis at the 2.5% significance level? State your answer as "reject" or "fail to reject",but don't include the quotation marks.
Unlock Deck
Unlock for access to all 45 flashcards in this deck.
Unlock Deck
k this deck
6
Use the following to answer questions :
A sample of 31 male students and another sample of 33 female students from the same college produced mean G.P.As of 2.66 for the males and 2.89 for the females.Suppose that the standard deviations of the G.P.As are 0.71 for the males and 0.63 for the females.The null hypothesis is that the mean G.P.A's are the same for males and females,while the alternative hypothesis is that the mean G.P.A for males is less than the mean G.P.A for females.
The significance level for the test is 2.5%.What is the critical value of z?
A)-2.58
B)-1.96
C)-2.33
D)-1.65
Unlock Deck
Unlock for access to all 45 flashcards in this deck.
Unlock Deck
k this deck
7
Use the following to answer questions :
A sample of 76 female workers and another sample of 48 male workers from a state produced mean weekly earnings of $743.50 for the females and $777.63 for the males.Suppose that the standard deviations of the weekly earnings are $80.05 for the females and $88.68 for the males.The null hypothesis is that the mean weekly earnings are the same for females and males,while the alternative hypothesis is that the mean weekly earnings for females is less than the mean weekly earnings for males.
What is the value of the test statistic,rounded to three decimal places?
Unlock Deck
Unlock for access to all 45 flashcards in this deck.
Unlock Deck
k this deck
8
Use the following to answer questions :
A sample of 76 female workers and another sample of 48 male workers from a state produced mean weekly earnings of $743.50 for the females and $777.63 for the males.Suppose that the standard deviations of the weekly earnings are $80.05 for the females and $88.68 for the males.The null hypothesis is that the mean weekly earnings are the same for females and males,while the alternative hypothesis is that the mean weekly earnings for females is less than the mean weekly earnings for males.
Derive the corresponding 95% confidence interval,rounded to two decimal places,for the difference between the mean weekly earnings for all female and male workers in this state.
Unlock Deck
Unlock for access to all 45 flashcards in this deck.
Unlock Deck
k this deck
9
Two samples drawn from two populations are independent if:
A)the selection of one sample from a population is not related to the selection of the second sample from the same population
B)the selection of one sample from one population does not affect the selection of the second sample from the second population
C)the selection of one sample from a population is related to the selection of the second sample from the same population
D)two samples selected from the same population have no relation
Unlock Deck
Unlock for access to all 45 flashcards in this deck.
Unlock Deck
k this deck
10
Use the following to answer questions :
A sample of 31 male students and another sample of 33 female students from the same college produced mean G.P.As of 2.66 for the males and 2.89 for the females.Suppose that the standard deviations of the G.P.As are 0.71 for the males and 0.63 for the females.The null hypothesis is that the mean G.P.A's are the same for males and females,while the alternative hypothesis is that the mean G.P.A for males is less than the mean G.P.A for females.
What is the value of the test statistic,rounded to three decimal places?
Unlock Deck
Unlock for access to all 45 flashcards in this deck.
Unlock Deck
k this deck
11
Use the following to answer questions :
A sample of 76 female workers and another sample of 48 male workers from a state produced mean weekly earnings of $743.50 for the females and $777.63 for the males.Suppose that the standard deviations of the weekly earnings are $80.05 for the females and $88.68 for the males.The null hypothesis is that the mean weekly earnings are the same for females and males,while the alternative hypothesis is that the mean weekly earnings for females is less than the mean weekly earnings for males.
Do you reject or fail to reject the null hypothesis at the 1% significance level? State your answer as "reject" or "fail to reject",but don't include the quotation marks.
Unlock Deck
Unlock for access to all 45 flashcards in this deck.
Unlock Deck
k this deck
12
Two samples drawn from two populations are dependent if:
A)the selection of one sample from a population is not related to the selection of the second sample from the same population
B)the selection of one sample from one population is not related to the selection of the second sample from the second population
C)for each data value collected from one sample there corresponds another data value collected from the second sample and both data values are collected from the same source
D)two samples selected from the same population have no relation
Unlock Deck
Unlock for access to all 45 flashcards in this deck.
Unlock Deck
k this deck
13
Use the following to answer questions :
A sample of 126 corporate managers and another sample of 168 college professors produced mean job-related stress scores of 7.35 for the managers and 6.86 for the professors.Suppose that the standard deviations of the stress scores are 1.12 for the managers and 1.82 for the professors.The null hypothesis is that the mean stress scores are the same for corporate managers and college professors,while the alternative hypothesis is that the mean stress score for managers is different from the mean stress score for professors.
Derive the corresponding 90% confidence interval for the difference between the mean stress scores for all corporate managers and college professors,rounded to three decimal places.
Unlock Deck
Unlock for access to all 45 flashcards in this deck.
Unlock Deck
k this deck
14
Use the following to answer questions :
A sample of 126 corporate managers and another sample of 168 college professors produced mean job-related stress scores of 7.35 for the managers and 6.86 for the professors.Suppose that the standard deviations of the stress scores are 1.12 for the managers and 1.82 for the professors.The null hypothesis is that the mean stress scores are the same for corporate managers and college professors,while the alternative hypothesis is that the mean stress score for managers is different from the mean stress score for professors.
The significance level for the test is 1%.What are the critical values of z?
A)-2.58 and 2.58
B)-1.96 and 1.96
C)-2.33 and 2.33
D)-3.09 and 3.09
Unlock Deck
Unlock for access to all 45 flashcards in this deck.
Unlock Deck
k this deck
15
Use the following to answer questions :
The mean weekly earnings of all female workers in a state is $710 and the mean weekly earnings of all male workers in the same state is $760.The standard deviations of the weekly earnings are $86 for the females and $106 for the males.Suppose we take one sample of 316 female workers and another sample of 329 male workers from this state.
What is the standard deviation of the sampling distribution of the difference between the mean weekly earnings for females and males,rounded to two decimal places?
Unlock Deck
Unlock for access to all 45 flashcards in this deck.
Unlock Deck
k this deck
16
Use the following to answer questions :
The mean job-related stress score for all corporate managers is 8.40 and the mean job-related stress score for all college professors is 5.95.The standard deviations of the job-related stress scores are 0.66 for the corporate managers and 0.82 for the college professors.Suppose we take one sample of 225 corporate managers and another sample of 167 college professors.
What is the mean,rounded to two decimal places,of the sampling distribution of the difference between the mean stress scores for corporate managers and college professors?
Unlock Deck
Unlock for access to all 45 flashcards in this deck.
Unlock Deck
k this deck
17
Use the following to answer questions :
The mean G.P.A (grade point average)of all male students at a college is 2.75 and the mean G.P.A of all female students at the same college is 2.98.The standard deviations of the G.P.As are 0.36 for the males and 0.30 for the females.Suppose we take one sample of 48 male students and another sample of 41 female students from this college.Assume the populations are normally distributed.
What is the standard deviation of the sampling distribution of the difference between the mean G.P.As for males and females,rounded to four decimal places?
Unlock Deck
Unlock for access to all 45 flashcards in this deck.
Unlock Deck
k this deck
18
Use the following to answer questions :
A sample of 76 female workers and another sample of 48 male workers from a state produced mean weekly earnings of $743.50 for the females and $777.63 for the males.Suppose that the standard deviations of the weekly earnings are $80.05 for the females and $88.68 for the males.The null hypothesis is that the mean weekly earnings are the same for females and males,while the alternative hypothesis is that the mean weekly earnings for females is less than the mean weekly earnings for males.
The significance level for the test is 1%.What is the critical value of z?
A)-2.58
B)-1.96
C)-2.33
D)-2.17
Unlock Deck
Unlock for access to all 45 flashcards in this deck.
Unlock Deck
k this deck
19
Use the following to answer questions :
The mean G.P.A (grade point average)of all male students at a college is 2.75 and the mean G.P.A of all female students at the same college is 2.98.The standard deviations of the G.P.As are 0.36 for the males and 0.30 for the females.Suppose we take one sample of 48 male students and another sample of 41 female students from this college.Assume the populations are normally distributed.
What is the mean,rounded to two decimal places,of the sampling distribution of the difference between the mean G.P.As for males and females?
Unlock Deck
Unlock for access to all 45 flashcards in this deck.
Unlock Deck
k this deck
20
Use the following to answer questions :
A sample of 31 male students and another sample of 33 female students from the same college produced mean G.P.As of 2.66 for the males and 2.89 for the females.Suppose that the standard deviations of the G.P.As are 0.71 for the males and 0.63 for the females.The null hypothesis is that the mean G.P.A's are the same for males and females,while the alternative hypothesis is that the mean G.P.A for males is less than the mean G.P.A for females.
Derive the corresponding 99% confidence interval for the difference between the mean G.P.As for all male and female students at this college,rounded to three decimal places.
Unlock Deck
Unlock for access to all 45 flashcards in this deck.
Unlock Deck
k this deck
21
Use the following to answer questions :
A sample of 20 from a population produced a mean of 66.0 and a standard deviation of 10.0.A sample of 25 from another population produced a mean of 58.6 and a standard deviation of 13.0.Assume that the two populations are normally distributed and the standard deviations of the two populations are equal.
The null hypothesis is that the two population means are equal,while the alternative hypothesis is that the two population means are different.The significance level is 5%.
What is the standard deviation of the sampling distribution of the difference between the means of these two samples,rounded to three decimal places?
Unlock Deck
Unlock for access to all 45 flashcards in this deck.
Unlock Deck
k this deck
22
Use the following to answer questions :
A sample of 16 from a population produced a mean of 86.9 and a standard deviation of 14.3.A sample of 18 from another population produced a mean of 75.4 and a standard deviation of 15.9.Assume that the two populations are normally distributed and the standard deviations of the two populations are equal.
The null hypothesis is that the two population means are equal,while the alternative hypothesis is that the mean of the first population is greater than the mean of the second population.The significance level is 1%.
What is the pooled standard deviation of the two samples,rounded to three decimal places?
Unlock Deck
Unlock for access to all 45 flashcards in this deck.
Unlock Deck
k this deck
23
Use the following to answer questions :
A sample of 16 from a population produced a mean of 86.9 and a standard deviation of 14.3.A sample of 18 from another population produced a mean of 75.4 and a standard deviation of 15.9.Assume that the two populations are normally distributed and the standard deviations of the two populations are equal.
The null hypothesis is that the two population means are equal,while the alternative hypothesis is that the mean of the first population is greater than the mean of the second population.The significance level is 1%.
Derive the corresponding 99% confidence interval for the difference between the means of these two populations,rounded to three decimal places.
Unlock Deck
Unlock for access to all 45 flashcards in this deck.
Unlock Deck
k this deck
24
Use the following to answer questions :
A sample of 16 from a population produced a mean of 86.9 and a standard deviation of 14.3.A sample of 18 from another population produced a mean of 75.4 and a standard deviation of 15.9.Assume that the two populations are normally distributed and the standard deviations of the two populations are equal.
The null hypothesis is that the two population means are equal,while the alternative hypothesis is that the mean of the first population is greater than the mean of the second population.The significance level is 1%.
What is the value of the test statistic,t,rounded to three decimal places?
Unlock Deck
Unlock for access to all 45 flashcards in this deck.
Unlock Deck
k this deck
25
Use the following to answer questions :
A sample of 16 from a population produced a mean of 86.9 and a standard deviation of 14.3.A sample of 18 from another population produced a mean of 75.4 and a standard deviation of 15.9.Assume that the two populations are normally distributed and the standard deviations of the two populations are equal.
The null hypothesis is that the two population means are equal,while the alternative hypothesis is that the mean of the first population is greater than the mean of the second population.The significance level is 1%.
What is the standard deviation of the sampling distribution of the difference between the means of these two samples,rounded to three decimal places?
Unlock Deck
Unlock for access to all 45 flashcards in this deck.
Unlock Deck
k this deck
26
Use the following to answer questions :
A sample of 20 from a population produced a mean of 66.0 and a standard deviation of 10.0.A sample of 25 from another population produced a mean of 58.6 and a standard deviation of 13.0.Assume that the two populations are normally distributed and the standard deviations of the two populations are equal.
The null hypothesis is that the two population means are equal,while the alternative hypothesis is that the two population means are different.The significance level is 5%.
Derive the corresponding 95% confidence interval for the difference between the means of these two populations,rounded to three decimal places.
Unlock Deck
Unlock for access to all 45 flashcards in this deck.
Unlock Deck
k this deck
27
Use the following to answer questions :
A sample of 20 from a population produced a mean of 66.0 and a standard deviation of 10.0.A sample of 25 from another population produced a mean of 58.6 and a standard deviation of 13.0.Assume that the two populations are normally distributed and the standard deviations of the two populations are equal.
The null hypothesis is that the two population means are equal,while the alternative hypothesis is that the two population means are different.The significance level is 5%.
What is the value of the test statistic,t,rounded to three decimal places?
Unlock Deck
Unlock for access to all 45 flashcards in this deck.
Unlock Deck
k this deck
28
Use the following to answer questions : In a survey regarding job satisfaction, 574 in a sample of 934 female job-holders stated that they are satisfied with their jobs, while 500 in a sample of 755 male job-holders stated that they are satisfied with their jobs. The null hypothesis is that the proportions of all female and male job-holders who are satisfied with their jobs are the same. The alternative hypothesis is that the proportion of female job-holders who are satisfied with their jobs is lower than the proportion of male job-holders stated who are satisfied with their jobs. The significance level is 2.5%.
What is the critical value of z for the hypothesis test?
A)-1.96
B)-2.17
C)-2.33
D)-2.05
What is the critical value of z for the hypothesis test?
A)-1.96
B)-2.17
C)-2.33
D)-2.05
Unlock Deck
Unlock for access to all 45 flashcards in this deck.
Unlock Deck
k this deck
29
Use the following to answer questions :
A sample of 126 corporate managers and another sample of 168 college professors produced mean job-related stress scores of 7.35 for the managers and 6.86 for the professors.Suppose that the standard deviations of the stress scores are 1.12 for the managers and 1.82 for the professors.The null hypothesis is that the mean stress scores are the same for corporate managers and college professors,while the alternative hypothesis is that the mean stress score for managers is different from the mean stress score for professors.
What is the value of the test statistic,rounded to three decimal places?
Unlock Deck
Unlock for access to all 45 flashcards in this deck.
Unlock Deck
k this deck
30
Use the following to answer questions : In a survey regarding job satisfaction, 574 in a sample of 934 female job-holders stated that they are satisfied with their jobs, while 500 in a sample of 755 male job-holders stated that they are satisfied with their jobs. The null hypothesis is that the proportions of all female and male job-holders who are satisfied with their jobs are the same. The alternative hypothesis is that the proportion of female job-holders who are satisfied with their jobs is lower than the proportion of male job-holders stated who are satisfied with their jobs. The significance level is 2.5%.
What is the value of the test statistic,z,rounded to three decimal places?
What is the value of the test statistic,z,rounded to three decimal places?
Unlock Deck
Unlock for access to all 45 flashcards in this deck.
Unlock Deck
k this deck
31
Use the following to answer questions : In a survey regarding job satisfaction, 574 in a sample of 934 female job-holders stated that they are satisfied with their jobs, while 500 in a sample of 755 male job-holders stated that they are satisfied with their jobs. The null hypothesis is that the proportions of all female and male job-holders who are satisfied with their jobs are the same. The alternative hypothesis is that the proportion of female job-holders who are satisfied with their jobs is lower than the proportion of male job-holders stated who are satisfied with their jobs. The significance level is 2.5%.
What is the value of the pooled sample proportion,rounded to four decimal places?
What is the value of the pooled sample proportion,rounded to four decimal places?
Unlock Deck
Unlock for access to all 45 flashcards in this deck.
Unlock Deck
k this deck
32
Use the following to answer questions :
A sample of 20 from a population produced a mean of 66.0 and a standard deviation of 10.0.A sample of 25 from another population produced a mean of 58.6 and a standard deviation of 13.0.Assume that the two populations are normally distributed and the standard deviations of the two populations are equal.
The null hypothesis is that the two population means are equal,while the alternative hypothesis is that the two population means are different.The significance level is 5%.
Do you reject or fail to reject the null hypothesis at the 5% significance level? State your answer as "reject" or "fail to reject",but don't include the quotation marks.
Unlock Deck
Unlock for access to all 45 flashcards in this deck.
Unlock Deck
k this deck
33
Use the following to answer questions :
A sample of 16 from a population produced a mean of 86.9 and a standard deviation of 14.3.A sample of 18 from another population produced a mean of 75.4 and a standard deviation of 15.9.Assume that the two populations are normally distributed and the standard deviations of the two populations are equal.
The null hypothesis is that the two population means are equal,while the alternative hypothesis is that the mean of the first population is greater than the mean of the second population.The significance level is 1%.
What is the critical value of t for the hypothesis test?
A)2.738
B)2.449
C)2.441
D)2.733
Unlock Deck
Unlock for access to all 45 flashcards in this deck.
Unlock Deck
k this deck
34
Use the following to answer questions :
A sample of 20 from a population produced a mean of 66.0 and a standard deviation of 10.0.A sample of 25 from another population produced a mean of 58.6 and a standard deviation of 13.0.Assume that the two populations are normally distributed and the standard deviations of the two populations are equal.
The null hypothesis is that the two population means are equal,while the alternative hypothesis is that the two population means are different.The significance level is 5%.
What is the pooled standard deviation of the two samples,rounded to three decimal places?
Unlock Deck
Unlock for access to all 45 flashcards in this deck.
Unlock Deck
k this deck
35
Use the following to answer questions :
A sample of 20 from a population produced a mean of 66.0 and a standard deviation of 10.0.A sample of 25 from another population produced a mean of 58.6 and a standard deviation of 13.0.Assume that the two populations are normally distributed and the standard deviations of the two populations are equal.
The null hypothesis is that the two population means are equal,while the alternative hypothesis is that the two population means are different.The significance level is 5%.
What are the critical values of t for the hypothesis test?
A)-2.014 and 2.014
B)-2.017 and 2.017
C)-1.681 and 1.681
D)-1.679 and 1.679
Unlock Deck
Unlock for access to all 45 flashcards in this deck.
Unlock Deck
k this deck
36
Use the following to answer questions :
A sample of 16 from a population produced a mean of 86.9 and a standard deviation of 14.3.A sample of 18 from another population produced a mean of 75.4 and a standard deviation of 15.9.Assume that the two populations are normally distributed and the standard deviations of the two populations are equal.
The null hypothesis is that the two population means are equal,while the alternative hypothesis is that the mean of the first population is greater than the mean of the second population.The significance level is 1%.
What is the p-value for this test,rounded to four decimal places?
Unlock Deck
Unlock for access to all 45 flashcards in this deck.
Unlock Deck
k this deck
37
Use the following to answer questions :
A sample of 20 from a population produced a mean of 66.0 and a standard deviation of 10.0.A sample of 25 from another population produced a mean of 58.6 and a standard deviation of 13.0.Assume that the two populations are normally distributed and the standard deviations of the two populations are equal.
The null hypothesis is that the two population means are equal,while the alternative hypothesis is that the two population means are different.The significance level is 5%.
What is the p-value for this test,rounded to four decimal places?
Unlock Deck
Unlock for access to all 45 flashcards in this deck.
Unlock Deck
k this deck
38
Use the following to answer questions :
A sample of 16 from a population produced a mean of 86.9 and a standard deviation of 14.3.A sample of 18 from another population produced a mean of 75.4 and a standard deviation of 15.9.Assume that the two populations are normally distributed and the standard deviations of the two populations are equal.
The null hypothesis is that the two population means are equal,while the alternative hypothesis is that the mean of the first population is greater than the mean of the second population.The significance level is 1%.
Do you reject or fail to reject the null hypothesis at the 1% significance level? State your answer as "reject" or "fail to reject",but don't include the quotation marks.
Unlock Deck
Unlock for access to all 45 flashcards in this deck.
Unlock Deck
k this deck
39
Use the following to answer questions :
A sample of 126 corporate managers and another sample of 168 college professors produced mean job-related stress scores of 7.35 for the managers and 6.86 for the professors.Suppose that the standard deviations of the stress scores are 1.12 for the managers and 1.82 for the professors.The null hypothesis is that the mean stress scores are the same for corporate managers and college professors,while the alternative hypothesis is that the mean stress score for managers is different from the mean stress score for professors.
Do you reject or fail to reject the null hypothesis at the 1% significance level? State your answer as "reject" or "fail to reject",but don't include the quotation marks.
Unlock Deck
Unlock for access to all 45 flashcards in this deck.
Unlock Deck
k this deck
40
Use the following to answer questions :
A sample of 126 corporate managers and another sample of 168 college professors produced mean job-related stress scores of 7.35 for the managers and 6.86 for the professors.Suppose that the standard deviations of the stress scores are 1.12 for the managers and 1.82 for the professors.The null hypothesis is that the mean stress scores are the same for corporate managers and college professors,while the alternative hypothesis is that the mean stress score for managers is different from the mean stress score for professors.
What is the p-value for this test,rounded to four decimal places?
Unlock Deck
Unlock for access to all 45 flashcards in this deck.
Unlock Deck
k this deck
41
Use the following to answer questions : In a survey regarding job satisfaction, 574 in a sample of 934 female job-holders stated that they are satisfied with their jobs, while 500 in a sample of 755 male job-holders stated that they are satisfied with their jobs. The null hypothesis is that the proportions of all female and male job-holders who are satisfied with their jobs are the same. The alternative hypothesis is that the proportion of female job-holders who are satisfied with their jobs is lower than the proportion of male job-holders stated who are satisfied with their jobs. The significance level is 2.5%.
Do you reject or fail to reject the null hypothesis? State your answer as "reject" or "fail to reject",but don't include the quotation marks.
Do you reject or fail to reject the null hypothesis? State your answer as "reject" or "fail to reject",but don't include the quotation marks.
Unlock Deck
Unlock for access to all 45 flashcards in this deck.
Unlock Deck
k this deck
42
Calculate the observed value from these two samples.Round your answer to the nearest tenth.
Sample from population 1: 2 2 3 4 2 2 8
Sample from population 2: 8 4 2 3 8 1
Sample from population 1: 2 2 3 4 2 2 8
Sample from population 2: 8 4 2 3 8 1
Unlock Deck
Unlock for access to all 45 flashcards in this deck.
Unlock Deck
k this deck
43
Use the following to answer questions : In a survey regarding job satisfaction, 574 in a sample of 934 female job-holders stated that they are satisfied with their jobs, while 500 in a sample of 755 male job-holders stated that they are satisfied with their jobs. The null hypothesis is that the proportions of all female and male job-holders who are satisfied with their jobs are the same. The alternative hypothesis is that the proportion of female job-holders who are satisfied with their jobs is lower than the proportion of male job-holders stated who are satisfied with their jobs. The significance level is 2.5%.
What is the p-value for this test,rounded to four decimal places?
What is the p-value for this test,rounded to four decimal places?
Unlock Deck
Unlock for access to all 45 flashcards in this deck.
Unlock Deck
k this deck
44
Suppose the following information comes from random samples from normal populations with means and ,respectively.
n1 = 13 s1 = 3.3
n2 = 17 s2 = 3
Using the data given,obtain a 95% confidence interval for the difference in means.Round your answer to three decimal places.
n1 = 13
s1 = 3.3n2 = 17
s2 = 3Using the data given,obtain a 95% confidence interval for the difference in means.Round your answer to three decimal places.
Unlock Deck
Unlock for access to all 45 flashcards in this deck.
Unlock Deck
k this deck
45
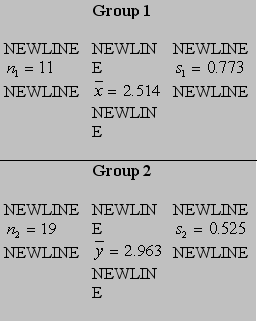
Consider the following statistics associated with a productivity index.
Do these data strongly indicate that the mean index for group 1 is lower than that for group 2? Test at level .Answer "Reject null hypothesis" or "Not reject null hypothesis".
Do these data strongly indicate that the mean index for group 1 is lower than that for group 2? Test at level .Answer "Reject null hypothesis" or "Not reject null hypothesis". Unlock Deck
Unlock for access to all 45 flashcards in this deck.
Unlock Deck
k this deck
Unlock Deck
Unlock for access to all 45 flashcards in this deck.


