Deck 14: Inference for Regression
Full screen (f)
Question
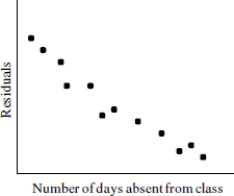
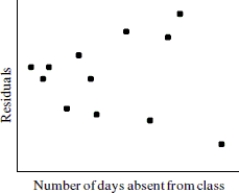
Suppose that you were presented with data showing the association between days absent from class and final class average. Which of the following residual plots below suggests that the association between number of days absent from class and final class average is linear?
A)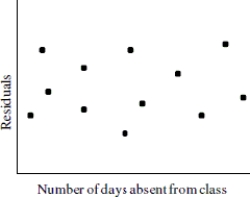
B)

C)
D)
A)
B)
C)
D)
Question
Use the following information to answer the question. A random sample of 30 couples who were also new home owners were asked to report the cost of their first house and their combined age when they married. The output of a regression analysis for predicting home cost from combined age is shown. Assume that the conditions of the linear regression model are satisfied.

Test the hypothesis that the slope is zero (significance level is 0.05), then choose the correct decision regarding the null hypothesis and the statement that correctly summarizes the conclusion.
A)Reject H0. We don't have enough evidence to reject a slope of zero which is an indication that no linear association exists between combined age of the couple and home cost.
B)Reject H0. There is enough evidence to reject a slope of zero which is an indication that a linear association exists between combined age of the couple and home cost.
C)Fail to reject H0. There is enough evidence to reject a slope of zero which is an indication that a linear association exists between combined age of the couple and home cost.
D)Fail to reject H0. We don't have enough evidence to reject a slope of zero which is an indication that no linear association exists between combined age of the couple and home cost.
Question
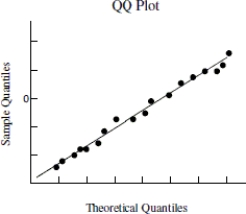
Use the following information to answer the question. Below is the scatterplot showing the association between miles driven in a semi truck (x), and the amount of tread wear on the tires (y). The residual plot of the data is also shown along with a QQ plot of the residuals.

Based on the plots provided, choose the statement that best describes whether the condition for linearity does or does not hold for the linear regression model.
A)The residual plot does not display a fan shape-- the residual plot is consistent with the claim of linearity.
B)The residual plot shows no trend-- the residual plot is consistent with the claim of linearity.
C)The residual plot shows a horizontal trend-- the residual plot is not consistent with the claim of linearity.
D)The QQ plot mostly follows a straight line trend-- the QQ plot is consistent with the claim of linearity.
Question
Use the following information to answer the question. A high school girls cross country coach performs a regression to predict the finish times of runners in the 10k event from the number of minutes of training in the previous week. The output is shown below. Assume that the conditions of the linear regression model hold.

Suppose the coach's top runner trained for 145 minutes the previous week. If this runner participates in the 10k event, what is the coach's expected finish time for this runner? Can he be reasonably confident that this runner will beat the time she had at the last meet of 51 minutes?
A)Expected finish time is 50.86 minutes. The coach can be confident that this runner will beat the previous meet's time of 51 minutes because the interval contains the value of 51 minutes.
B)Expected finish time is 88.56minutes. The coach cannot be confident that this runner will beat the previous meet's time because the interval contains the value of 51 minutes. To be confident the interval would have to lie completely below 51 minutes.
C)Expected finish time is 88.56 minutes. The coach can be confident that this runner will beat the previous meet's time of 51 minutes because the interval contains the value of 51 minutes.
D)Expected finish time is 50.86 minutes. The coach cannot be confident that this runner will beat the previous meet's time because the interval contains the value of 51 minutes. To be confident the interval would have to lie completely below 51 minutes.
Question
The regression output below is the result of testing whether there is an association between the number of hours of sleep a student had the night before an exam and the number of questions answered correctly on the exam. Assume that the conditions of the linear regression model are satisfied. What is the 95% confidence interval for the intercept (rounded to the nearest hundredth)? Does this interval support the theory that the intercept is zero? Choose the statement that summarizes your answer in context. 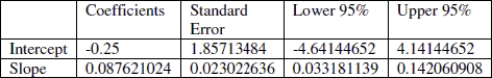
A)(- 4.64, 4.14). This interval supports the theory that the intercept could be zero. In this context this would mean that a student who had zero hours of sleep could reasonably expect to get a zero on the test.
B)(- 4.64, 4.14). This interval does not support the theory that the intercept could be zero. In this context this would mean that for approximately every 0.08 hours of sleep, the student could expect to get approximately one test question correct.
C)(0.03, 0.14). This interval does not support the theory that the intercept could be zero. In this context the intercept is greater than zero so a student could expect to get a positive score on the test even if they did not get any hours of sleep.
D)None of these
Question
Question
Question
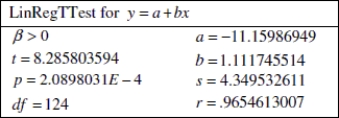
Use the following information to answer the question. A humanities professor is interesting in learning whether there is a positive association between average online homework scores and the final class average in an online humanities course. The computer output below shows the results from a regression model in which the final class average was predicted by the average online homework score. Assume that the conditions of the linear regression model are satisfied.
Choose the correct observed value of the test statistic and the p- value. Round to the nearest thousandth.
A)t = 4.345, p = 0.005
B)t = 1.112, p = 0.000
C)t = 8.286, p = 0.000
D)t = 8.286, p = 2.090
Choose the correct observed value of the test statistic and the p- value. Round to the nearest thousandth.
A)t = 4.345, p = 0.005
B)t = 1.112, p = 0.000
C)t = 8.286, p = 0.000
D)t = 8.286, p = 2.090
Question
Question
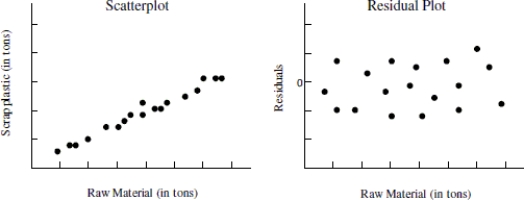
Use the following information to answer the question. Below is the scatterplot showing the association between raw material (in tons)put into an injection molding machine each day (x), and the amount of scrap plastic (in tons)that is collected from the machine every 4 weeks (y). The residual plot of the data is also shown along with a QQ plot of the residuals.


Choose the statement that best describes whether the condition for constant standard deviation does or does not hold for the linear regression model.
A)The scatter plot shows a linear trend-- the scatter plot is not consistent with the claim of constant standard deviation.
B)The QQ plot mostly follows a straight line-- the QQ plot is consistent with the claim of constant standard deviation.
C)The residual plot shows no trend-- the residual plot is not consistent with the claim of constant standard deviation.
D)The residual plot does not display a fan shape-- the residual plot is consistent with the claim of constant standard deviation.
Question
Question
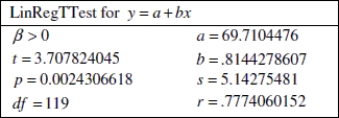
Use the following information to answer the question. A statistics professor is interested in learning whether there is a positive association between number of posts by online students on a message board and the final class average in an online statistics course. The computer output below shows the results from a regression model in which the final class average was predicted by the number of message board posts. Assume that the conditions of the linear regression model are satisfied.

Choose the correct observed value of the test statistic and the p- value. Round to the nearest thousandth.
A)t = 0.777, p = 0.002
B)t = 3.708, p = 0.002
C)t = 0.002, p = 3.707
D)t = 3.708, p = 0.005
Choose the correct observed value of the test statistic and the p- value. Round to the nearest thousandth.
A)t = 0.777, p = 0.002
B)t = 3.708, p = 0.002
C)t = 0.002, p = 3.707
D)t = 3.708, p = 0.005
Question
Use the following information to answer the question. A statistics professor is interested in learning whether there is a positive association between number of posts by online students on a message board and the final class average in an online statistics course. The computer output below shows the results from a regression model in which the final class average was predicted by the number of message board posts. Assume that the conditions of the linear regression model are satisfied.
Choose the correct null and alternative hypothesis to test whether there is an association between final class average and number of message board posts.
A)H0: There is a linear association between the number of message board posts and the final class average. Ha: There is no linear association between the number of message board posts and the final class average.
B)H0: The correlation is positive. Ha: The correlation is zero.
C)H0: There is no linear association between the number of message board posts and the final class average. Ha: There is a positive linear association between the number of message board posts and the final class average.
D)None of these.
Question
Use the following information to answer the question. A random sample of 30 couples who were also new home owners were asked to report the cost of their first house and their combined age when they married. The output of a regression analysis for predicting home cost from combined age is shown. Assume that the conditions of the linear regression model are satisfied.

What is the slope of the regression line? Choose the statement that is the correct interpretation of the slope in context.
A)The slope is 2122.75. On average, for each additional year in combined age, home cost is about $2,122.75 higher, in the sample.
B)The slope is 73.74. On average, for couples with a combined age over 73.74, the home cost is an additional $2,122.75 per year over 73.74.
C)The slope is 2122.75. On average, for each additional $2,122.75 in home cost, the combined age is about 1 year higher, in the sample.
D)The slope is 73.74. On average, for each additional year in combined age, the home cost is about $2,122.75 higher, in the sample.
Question
Use the following information to answer the question. A random sample of 30 couples who were also new home owners were asked to report the cost of their first house and their combined age when they married. The output of a regression analysis for predicting home cost from combined age is shown. Assume that the conditions of the linear regression model are satisfied.
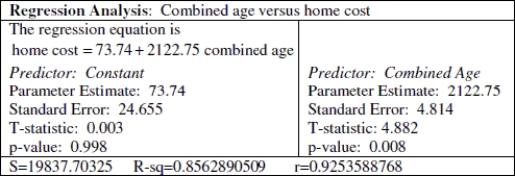
If the slope were 1, what would that say about the association?
A)If the slope were 1, it would mean that on average, for every additional year in combined age, the home cost would be $2,122.75 lower.
B)If the slope were 1, it would mean that on average, for every additional year in combined age, the home cost would be 1 dollar more.
C)If the slope were 1, it would mean that on average, for every additional year in combined age, the home cost would be $2,122.75 higher.
D)None of these.
Question
Use the following information to answer the question. A high school girls cross country coach performs a regression to predict the finish times of runners in the 10k event from the number of minutes of training in the previous week. The output is shown below. Assume that the conditions of the linear regression model hold.
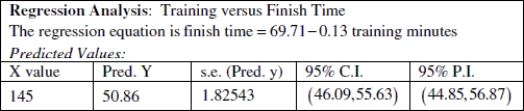
The coach wants to predict the finish time of his top runner who trained for 145 minutes the previous week. Should the coach use a confidence interval or a prediction interval?
A)Prediction Interval
B)Confidence Interval
The coach wants to predict the finish time of his top runner who trained for 145 minutes the previous week. Should the coach use a confidence interval or a prediction interval?
A)Prediction Interval
B)Confidence Interval
Question
The regression output below is the result of testing whether there is an association between the number of practice test problems a student completed and the number of questions answered correctly on the test. Assume that the conditions of the linear regression model are satisfied. What is the 95% confidence interval for the intercept (rounded to the nearest hundredth)? Does this interval support the theory that the intercept is zero? Choose the statement that summarizes your answer in context. 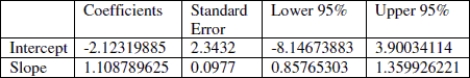
A)(0.86, 1.36). This interval does not support the theory that the intercept could be zero. In this context the intercept is greater than zero so a student could expect to get a positive score on the test even if they did none of the practice problems.
B)(- 8.15, 3.90). This interval does not support the theory that the intercept could be zero. In this context this would mean that for approximately every two practice problems completed, the student could expect to get approximately one test question correct.
C)(- 8.15, 3.90). This interval supports the theory that the intercept could be zero. In this context this would mean that a student who completed zero practice test problems could reasonably expect to get a zero on the test.
D)None of these
Question
Use the following information to answer the question. Below is the scatterplot showing the association between raw material (in tons)put into an injection molding machine each day (x), and the amount of scrap plastic (in tons)that is collected from the machine every 4 weeks (y). The residual plot of the data is also shown along with a QQ plot of the residuals.
Choose the statement that is true about the estimators for slope and intercept of a regression line when the conditions of the linear model hold.
A)The sampling distributions of the estimators follow the chi- square model.
B)The standard errors for the estimators must come from a population that is Normally distributed.
C)The estimators for the slope and intercept of a regression line are unbiased.
D)None of these
Question
Use the following information to answer the question. A random sample of 30 married couples were asked to report the height of their spouse and the height of their biological parent of the same gender as their spouse. The output of a regression analysis for predicting spouse height from parent height is shown. Assume that the conditions of the linear regression model are satisfied.

Test the hypothesis that the slope is zero (significance level is 0.05), then choose the correct decision regarding the null hypothesis and the statement that correctly summarizes the conclusion.
A)Fail to reject H0. There is enough evidence to reject a slope of zero which is an indication that a linear association exists between parent height and spouse height.
B)Reject H0. We don't have enough evidence to reject a slope of zero which is an indication that no linear association exists between parent height and spouse height.
C)Reject H0. There is enough evidence to reject a slope of zero which is an indication that a linear association exists between parent height and spouse height.
D)Fail to reject H0. We don't have enough evidence to reject a slope of zero which is an indication that no linear association exists between parent height and spouse height.
Question
Use the following information to answer the question. A high school boys cross country coach performs a regression to predict the finish times of runners in the 10k event from the number of minutes of training in the previous week. The output is shown below. Assume that the conditions of the linear regression model hold.
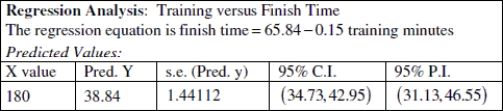
Suppose the coach's top runner trained for 180 minutes the previous week. If this runner participates in the 10k event, what is the coach's expected finish time for this runner? Can he be reasonably confident that this runner will beat the previous season's record of 43 minutes?
A)Expected finish time is 38.84 minutes. The coach can be confident that this runner will beat the previous season's record of 43 minutes because the interval contains the value of 43 minutes.
B)Expected finish time is 38.84 minutes. The coach cannot be confident that this runner will beat the previous season's record because the interval contains the value of 43 minutes. To be confident the interval would have to lie completely below 43 minutes.
C)Expected finish time is 65.84 minutes. The coach can be confident that this runner will beat the previous season's record of 43 minutes because the interval contains the value of 43 minutes.
D)Expected finish time is 65.84 minutes. The coach cannot be confident that this runner will beat the previous season's record because the interval contains the value of 43 minutes. To be confident the interval would have to lie completely below 43 minutes.
Question
Question
Use the following information to answer the question. Below is the scatterplot showing the association between raw material (in tons)put into an injection molding machine each day (x), and the amount of scrap plastic (in tons)that is collected from the machine every 4 weeks (y). The residual plot of the data is also shown along with a QQ plot of the residuals.

Choose the statement that best describes whether the condition for linearity does or does not hold for the linear regression model.
A)The residual plot shows no trend-- the residual plot is consistent with the claim of linearity.
B)The residual plot shows a horizontal trend-- the residual plot is not consistent with the claim of linearity.
C)The residual plot does not display a fan shape-- the residual plot is consistent with the claim of linearity.
D)The QQ plot mostly follows a straight line trend-- the QQ plot is consistent with the claim of linearity.
Question
Use the following information to answer the question. A humanities professor is interesting in learning whether there is a positive association between average online homework scores and the final class average in an online humanities course. The computer output below shows the results from a regression model in which the final class average was predicted by the average online homework score. Assume that the conditions of the linear regression model are satisfied.

Choose the correct decision regarding the null hypothesis and the correct conclusion. State your conclusion using a significance level of 5%.
A)Reject H0. There is not enough evidence to conclude that the final class average is positively associated with the average online homework score.
B)Fail to reject H0. There is enough evidence to conclude that the final class average is positively associated with the average online homework score.
C)Fail to reject H0. There is not enough evidence to conclude that the final class average is positively associated with the average online homework score.
D)Reject H0. There is enough evidence to conclude that the final class average is positively associated with the average online homework score.
Question
Use the following information to answer the question. Below is the scatterplot showing the association between raw material (in tons)put into an injection molding machine each day (x), and the amount of scrap plastic (in tons)that is collected from the machine every 4 weeks (y). The residual plot of the data is also shown along with a QQ plot of the residuals.

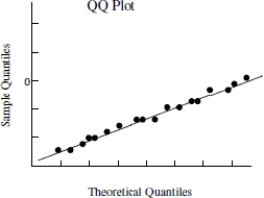
Choose the statement that best describes whether the condition for normality of errors does or does not hold for the linear regression model.
A)The residual plot shows no trend, therefore the normality condition is not satisfied.
B)The residual plot does not display a fan shape, therefore the normality condition is satisfied.
C)The QQ plot mostly follows a straight line, therefore the normality condition is satisfied.
D)The residual plot shows no trend, therefore the normality condition is satisfied.
Question
Use the following information to answer the question. A statistics professor is interested in learning whether there is a positive association between number of posts by online students on a message board and the final class average in an online statistics course. The computer output below shows the results from a regression model in which the final class average was predicted by the number of message board posts. Assume that the conditions of the linear regression model are satisfied.

Choose the correct decision regarding the null hypothesis and the correct conclusion. State your conclusion using a significance level of 5%.
A)Fail to reject H0. There is enough evidence to conclude that the final class average is positively associated with the number of message board posts.
B)Fail to reject H0. There is not enough evidence to conclude that the final class average is positively associated with the number of message board posts.
C)Reject H0. There is enough evidence to conclude that the final class average is positively associated with the number of message board posts.
D)Reject H0. There is not enough evidence to conclude that the final class average is positively associated with the number of message board posts.
Question
Use the following information to answer the question. Below is the scatterplot showing the association between miles driven in a semi truck (x), and the amount of tread wear on the tires (y). The residual plot of the data is also shown along with a QQ plot of the residuals.


Choose the statement that best describes whether the condition for normality of errors does or does not hold for the linear regression model.
A)The residual plot shows no trend, therefore the normality condition is satisfied.
B)The QQ plot mostly follows a straight line, therefore the normality condition is satisfied.
C)The residual plot does not display a fan shape, therefore the normality condition is satisfied.
D)The residual mostly follows a horizontal line which would have a slope of zero, therefore the normality condition is not satisfied.
Question
Use the following information to answer the question. A high school boys cross country coach performs a regression to predict the finish times of runners in the 10k event from the number of minutes of training in the previous week. The output is shown below. Assume that the conditions of the linear regression model hold.

The coach wants to predict the finish time of his top runner who trained for 180 minutes the previous week. Should the coach use a confidence interval or a prediction interval?
A)Confidence Interval
B)Prediction Interval
The coach wants to predict the finish time of his top runner who trained for 180 minutes the previous week. Should the coach use a confidence interval or a prediction interval?
A)Confidence Interval
B)Prediction Interval
Question
Question
Question
Use the following information to answer the question. A random sample of 30 married couples were asked to report the height of their spouse and the height of their biological parent of the same gender as their spouse. The output of a regression analysis for predicting spouse height from parent height is shown. Assume that the conditions of the linear regression model are satisfied.
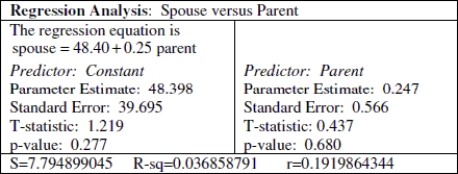
What is the slope of the regression line? Choose the statement that is the correct interpretation of the slope in context.
A)The slope is 0.25. On average, for each inch taller a parent is, the spouse is about 0.25 inches taller, in the sample.
B)The slope is 48.40. On average, for each inch taller a parent is, the spouse is about 48.40 inches taller, in the sample.
C)The slope is 0.25. On average, for each 0.25 inches taller a parent is, the spouse is about 1 inch taller, in the sample.
D)The slope is 48.40. On average, for each inch taller a parent is, the spouse is about 0.25 inches taller, in the sample.
Question
Question
Use the following information to answer the question. A humanities professor is interesting in learning whether there is a positive association between average online homework scores and the final class average in an online humanities course. The computer output below shows the results from a regression model in which the final class average was predicted by the average online homework score. Assume that the conditions of the linear regression model are satisfied.
Choose the correct null and alternative hypothesis to test whether there is an association between final class average and average online homework scores.
A)H0: The correlation is positive. Ha: The correlation is zero.
B)H0: There is no linear association between the final class average and the average online homework score. Ha: There is a positive linear association between the final class average and the average online homework score.
C)H0: There is a linear association between the final class average and the average online homework score. Ha: There is no linear association between the final class average and the average online homework score.
D)None of these.
Question
Question
Question
Question
Suppose that you were presented with data showing the association between days absent from class and final class average. Which of the following residual plots below suggests that the association between number of days absent from class and final class average is linear?
A)
B)
C)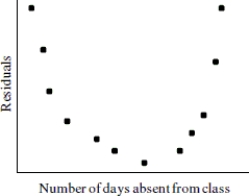
D)

A)
B)
C)
D)
Question
Question
Use the following information to answer the question. A random sample of 30 married couples were asked to report the height of their spouse and the height of their biological parent of the same gender as their spouse. The output of a regression analysis for predicting spouse height from parent height is shown. Assume that the conditions of the linear regression model are satisfied.

If the intercept was 0 and the slope was 1, what would that say about the association?
A)It would mean that on average, the spouse is 1 inch taller than the parent.
B)It would mean that the spouse height should not be predicting using parent height.
C)It would mean that on average, the spouse and the parent are the same height.
D)None of these.
Question
Question
Use the following information to answer the question. Below is the scatterplot showing the association between miles driven in a semi truck (x), and the amount of tread wear on the tires (y). The residual plot of the data is also shown along with a QQ plot of the residuals.
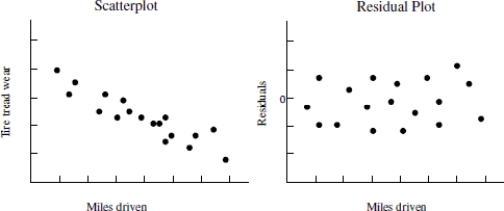

Based on the plots provided, choose the statement that best describes whether the condition for constant standard deviation does or does not hold for the linear regression model.
A)The residual plot does not display a fan shape-- the residual plot is consistent with the claim of constant standard deviation.
B)The scatterplot shows a linear trend-- the scatterplot is not consistent with the claim of constant standard deviation.
C)The QQ plot mostly follows a straight line-- the QQ plot is consistent with the claim of constant standard deviation.
D)The residual plot shows no trend-- the residual plot is not consistent with the claim of constant standard deviation.
Question
Suppose that you were presented with data showing the association between days absent from class and final class average. Use the following residual plots, based on the data, to answer the question.
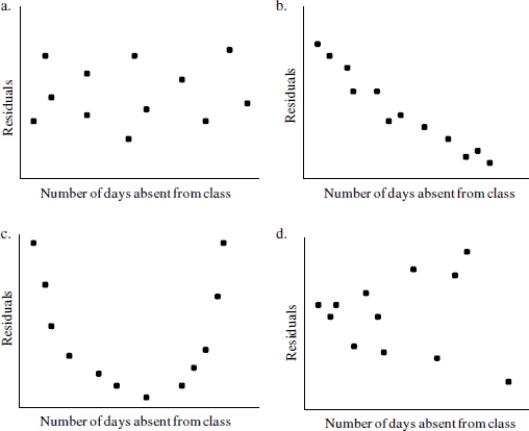
Which of the residual plots above would suggests that the condition for constant standard deviation might not be satisfied? Explain.
Which of the residual plots above would suggests that the condition for constant standard deviation might not be satisfied? Explain.
Question
Use the following information to answer the question. The pulse rate of a random sample of 30 second graders was recorded before and after a fifteen minute recess. The output of a regression analysis for predicting pulse rate after recess from pulse rate before recess is shown. Assume that the conditions of the linear regression model are satisfied.
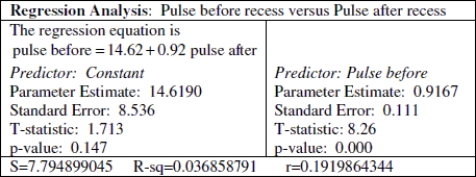
If the intercept was 0 and the slope was 1, explain how the linear model would be interpreted in context.
If the intercept was 0 and the slope was 1, explain how the linear model would be interpreted in context.
Question
Question
Question
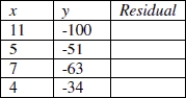
Explain what residuals are. Where do residuals come from? How are residuals calculated? Complete the table below by calculating the residuals for the following small data set. The linear model relating x and y is y = 5 - 10x.
Question
Suppose that you were presented with data showing the association between days absent from class and final class average. Use the following residual plots, based on the data, to answer the question.

Which of the residual plots above would suggest that the association between number of days absent from class and final class average is linear? Explain.
Which of the residual plots above would suggest that the association between number of days absent from class and final class average is linear? Explain.
Question
Use the following information to answer the question. Below is the scatterplot showing the association between the number of workers on an assembly team (x), and the number of parts assembled in an 8- hour shift (y). The residual plot of the data is also shown along with a QQ plot of the residuals.
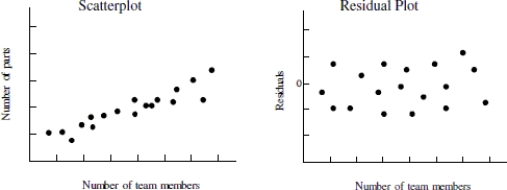

Use the plot(s)above to explain whether the condition for linearity is satisfied.
Use the plot(s)above to explain whether the condition for linearity is satisfied.
Question
Use the following information to answer the question. Below is the scatterplot showing the association between the number of workers on an assembly team (x), and the number of parts assembled in an 8- hour shift (y). The residual plot of the data is also shown along with a QQ plot of the residuals.


Use the plot(s)above to explain whether the condition for constant standard deviation is satisfied.
Use the plot(s)above to explain whether the condition for constant standard deviation is satisfied.
Question
Question
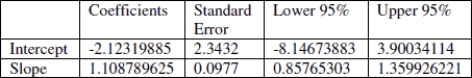
Use the following information to answer the question. A high school boys track and field coach performs a regression to predict the vault height (in feet)of a pole vault from the number of minutes of training in the previous week. The output is shown below. Assume that the conditions of the linear regression model hold.
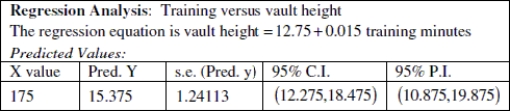
The coach wants to project what the jump height of his top pole vaulter will be who trained for 175 minutes the previous week. Should the coach use a confidence interval or a prediction interval?
The coach wants to project what the jump height of his top pole vaulter will be who trained for 175 minutes the previous week. Should the coach use a confidence interval or a prediction interval?
Question
Use the following information to answer the question. An engineer is interested in learning whether there is an association between temperature (°F)and the strength of an automotive plastic cup holder which is measured by finding the pounds per square inch (psi)it takes to break the cup holder. The computer output below shows the results from a regression model in which the breaking point in psi was predicted by the temperature. Assume that the conditions of the linear regression model are satisfied.

State the null and alternative hypothesis to test whether there is an association between temperature and break strength two different ways.
State the null and alternative hypothesis to test whether there is an association between temperature and break strength two different ways.
Question
The regression output below is the result of testing whether there is an association between the number of practice test problems a student completed and the number of questions answered correctly on the test. Assume that the conditions of the linear regression model are satisfied. What is the 95% confidence interval for the slope (rounded to the nearest hundredth)? Does this interval support the theory that the slope is zero? Write a statement that summarizes your answer in context.
Question
Use the following information to answer the question. An engineer is interested in learning whether there is an association between temperature (°F)and the strength of an automotive plastic cup holder which is measured by finding the pounds per square inch (psi)it takes to break the cup holder. The computer output below shows the results from a regression model in which the breaking point in psi was predicted by the temperature. Assume that the conditions of the linear regression model are satisfied.
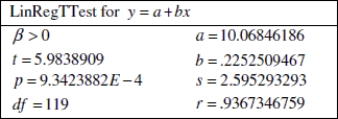
What is the observed value of the test statistic and the p- value? Round to the nearest thousandth.
What is the observed value of the test statistic and the p- value? Round to the nearest thousandth.
Question
Question
Use the following information to answer the question. The pulse rate of a random sample of 30 second graders was recorded before and after a fifteen minute recess. The output of a regression analysis for predicting pulse rate after recess from pulse rate before recess is shown. Assume that the conditions of the linear regression model are satisfied.

State the slope of the regression line. Write a sentence explaining what this slope means in this context.
State the slope of the regression line. Write a sentence explaining what this slope means in this context.
Question
Use the following information to answer the question. A high school boys track and field coach performs a regression to predict the vault height (in feet)of a pole vault from the number of minutes of training in the previous week. The output is shown below. Assume that the conditions of the linear regression model hold.

Suppose the coach's top pole vaulter trained for 175 minutes the previous week. If this athlete participates in the pole vault event, what is the coach's expected jump height for this athlete? Can he be reasonably confident that this athlete will beat the previous season's record of 19.8 feet? Explain.
Suppose the coach's top pole vaulter trained for 175 minutes the previous week. If this athlete participates in the pole vault event, what is the coach's expected jump height for this athlete? Can he be reasonably confident that this athlete will beat the previous season's record of 19.8 feet? Explain.
Question
Question
Use the following information to answer the question. Below is the scatterplot showing the association between the number of workers on an assembly team (x), and the number of parts assembled in an 8- hour shift (y). The residual plot of the data is also shown along with a QQ plot of the residuals.

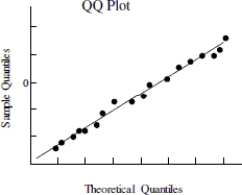
Use the plot(s)above to explain whether the condition for normality of errors is satisfied.
Use the plot(s)above to explain whether the condition for normality of errors is satisfied.
Question
Use the following information to answer the question. An engineer is interested in learning whether there is an association between temperature (°F)and the strength of an automotive plastic cup holder which is measured by finding the pounds per square inch (psi)it takes to break the cup holder. The computer output below shows the results from a regression model in which the breaking point in psi was predicted by the temperature. Assume that the conditions of the linear regression model are satisfied.
State the two conditions that must be satisfied, without exception, to make inferences using a linear model.
State the two conditions that must be satisfied, without exception, to make inferences using a linear model.
Question
Use the following information to answer the question. An engineer is interested in learning whether there is an association between temperature (°F)and the strength of an automotive plastic cup holder which is measured by finding the pounds per square inch (psi)it takes to break the cup holder. The computer output below shows the results from a regression model in which the breaking point in psi was predicted by the temperature. Assume that the conditions of the linear regression model are satisfied.

State the decision regarding the null hypothesis and the correct conclusion. State your conclusion using a significance level of 5%.
State the decision regarding the null hypothesis and the correct conclusion. State your conclusion using a significance level of 5%.

Unlock Deck
Sign up to unlock the cards in this deck!
Unlock Deck
Unlock Deck
1/60
Play
Full screen (f)
Deck 14: Inference for Regression
1
Suppose that you were presented with data showing the association between days absent from class and final class average. Which of the following residual plots below suggests that the association between number of days absent from class and final class average is linear?
A)
B)
C)
D)
A)
B)
C)
D)
2
Use the following information to answer the question. A random sample of 30 couples who were also new home owners were asked to report the cost of their first house and their combined age when they married. The output of a regression analysis for predicting home cost from combined age is shown. Assume that the conditions of the linear regression model are satisfied.
Test the hypothesis that the slope is zero (significance level is 0.05), then choose the correct decision regarding the null hypothesis and the statement that correctly summarizes the conclusion.
A)Reject H0. We don't have enough evidence to reject a slope of zero which is an indication that no linear association exists between combined age of the couple and home cost.
B)Reject H0. There is enough evidence to reject a slope of zero which is an indication that a linear association exists between combined age of the couple and home cost.
C)Fail to reject H0. There is enough evidence to reject a slope of zero which is an indication that a linear association exists between combined age of the couple and home cost.
D)Fail to reject H0. We don't have enough evidence to reject a slope of zero which is an indication that no linear association exists between combined age of the couple and home cost.
Reject H0. We don't have enough evidence to reject a slope of zero which is an indication that no linear association exists between combined age of the couple and home cost.
3
Use the following information to answer the question. Below is the scatterplot showing the association between miles driven in a semi truck (x), and the amount of tread wear on the tires (y). The residual plot of the data is also shown along with a QQ plot of the residuals.
Based on the plots provided, choose the statement that best describes whether the condition for linearity does or does not hold for the linear regression model.
A)The residual plot does not display a fan shape-- the residual plot is consistent with the claim of linearity.
B)The residual plot shows no trend-- the residual plot is consistent with the claim of linearity.
C)The residual plot shows a horizontal trend-- the residual plot is not consistent with the claim of linearity.
D)The QQ plot mostly follows a straight line trend-- the QQ plot is consistent with the claim of linearity.
The residual plot shows no trend-- the residual plot is consistent with the claim of linearity.
4
Use the following information to answer the question. A high school girls cross country coach performs a regression to predict the finish times of runners in the 10k event from the number of minutes of training in the previous week. The output is shown below. Assume that the conditions of the linear regression model hold.
Suppose the coach's top runner trained for 145 minutes the previous week. If this runner participates in the 10k event, what is the coach's expected finish time for this runner? Can he be reasonably confident that this runner will beat the time she had at the last meet of 51 minutes?
A)Expected finish time is 50.86 minutes. The coach can be confident that this runner will beat the previous meet's time of 51 minutes because the interval contains the value of 51 minutes.
B)Expected finish time is 88.56minutes. The coach cannot be confident that this runner will beat the previous meet's time because the interval contains the value of 51 minutes. To be confident the interval would have to lie completely below 51 minutes.
C)Expected finish time is 88.56 minutes. The coach can be confident that this runner will beat the previous meet's time of 51 minutes because the interval contains the value of 51 minutes.
D)Expected finish time is 50.86 minutes. The coach cannot be confident that this runner will beat the previous meet's time because the interval contains the value of 51 minutes. To be confident the interval would have to lie completely below 51 minutes.
Unlock Deck
Unlock for access to all 60 flashcards in this deck.
Unlock Deck
k this deck
5
The regression output below is the result of testing whether there is an association between the number of hours of sleep a student had the night before an exam and the number of questions answered correctly on the exam. Assume that the conditions of the linear regression model are satisfied. What is the 95% confidence interval for the intercept (rounded to the nearest hundredth)? Does this interval support the theory that the intercept is zero? Choose the statement that summarizes your answer in context.
A)(- 4.64, 4.14). This interval supports the theory that the intercept could be zero. In this context this would mean that a student who had zero hours of sleep could reasonably expect to get a zero on the test.
B)(- 4.64, 4.14). This interval does not support the theory that the intercept could be zero. In this context this would mean that for approximately every 0.08 hours of sleep, the student could expect to get approximately one test question correct.
C)(0.03, 0.14). This interval does not support the theory that the intercept could be zero. In this context the intercept is greater than zero so a student could expect to get a positive score on the test even if they did not get any hours of sleep.
D)None of these
Unlock Deck
Unlock for access to all 60 flashcards in this deck.
Unlock Deck
k this deck
6
Biologists studying the relationship between the number of Round Goby (an invasive prey fish)and the number of salmon eggs in streams believe that the deterministic component of the relationship is a straight line. A scatterplot shows that even though the general trend is linear, the points do not fall exactly on a straight line. Which of the following factors might account for the random component of this regression model?
A)Variation in the size of the Goby might cause variation in the amount of salmon eggs consumed.
B)Variability might appear in the instrument used to count salmon eggs.
C)Different size salmon might affect the number of eggs laid.
D)All of these are possible factors that could account for the random component of the regression model.
Unlock Deck
Unlock for access to all 60 flashcards in this deck.
Unlock Deck
k this deck
7
Choose the condition of the linear regression model that cannot by verified by examining the residuals. Choose (d)if all the conditions given can be verified by examining the residuals.
A)Constant Standard Deviation
B)Normality of errors
C)Linearity
D)All of these can be verified by examining the residuals
A)Constant Standard Deviation
B)Normality of errors
C)Linearity
D)All of these can be verified by examining the residuals
Unlock Deck
Unlock for access to all 60 flashcards in this deck.
Unlock Deck
k this deck
8
Use the following information to answer the question. A humanities professor is interesting in learning whether there is a positive association between average online homework scores and the final class average in an online humanities course. The computer output below shows the results from a regression model in which the final class average was predicted by the average online homework score. Assume that the conditions of the linear regression model are satisfied.
Choose the correct observed value of the test statistic and the p- value. Round to the nearest thousandth.
A)t = 4.345, p = 0.005
B)t = 1.112, p = 0.000
C)t = 8.286, p = 0.000
D)t = 8.286, p = 2.090
Choose the correct observed value of the test statistic and the p- value. Round to the nearest thousandth.
A)t = 4.345, p = 0.005
B)t = 1.112, p = 0.000
C)t = 8.286, p = 0.000
D)t = 8.286, p = 2.090
Unlock Deck
Unlock for access to all 60 flashcards in this deck.
Unlock Deck
k this deck
9
Which of the following statements is not true about the constant standard deviation condition of the linear regression model?
A)A residual plot can highlight the existence of a nonconstant standard deviation even when it is hard to see in the original scatterplot.
B)A QQ plot can help you determine whether the constant standard deviation condition holds.
C)A fan shape in a residual plot indicates that the constant standard deviation condition does not hold.
D)A constant standard deviation means that the vertical spread of the y- values about the line is the same across the entire line.
Unlock Deck
Unlock for access to all 60 flashcards in this deck.
Unlock Deck
k this deck
10
Use the following information to answer the question. Below is the scatterplot showing the association between raw material (in tons)put into an injection molding machine each day (x), and the amount of scrap plastic (in tons)that is collected from the machine every 4 weeks (y). The residual plot of the data is also shown along with a QQ plot of the residuals.
Choose the statement that best describes whether the condition for constant standard deviation does or does not hold for the linear regression model.
A)The scatter plot shows a linear trend-- the scatter plot is not consistent with the claim of constant standard deviation.
B)The QQ plot mostly follows a straight line-- the QQ plot is consistent with the claim of constant standard deviation.
C)The residual plot shows no trend-- the residual plot is not consistent with the claim of constant standard deviation.
D)The residual plot does not display a fan shape-- the residual plot is consistent with the claim of constant standard deviation.
Unlock Deck
Unlock for access to all 60 flashcards in this deck.
Unlock Deck
k this deck
11
Choose the statement(s)that are not true about the estimators for slope and intercept of a regression line when the conditions of the linear model hold. If each statement is true choose (d).
A)The sampling distributions of the estimators follow the chi- square model.
B)The estimators for the slope and intercept of a regression line are unbiased.
C)The sampling distribution of the estimators will follow the Normal model.
D)All of these are true.
A)The sampling distributions of the estimators follow the chi- square model.
B)The estimators for the slope and intercept of a regression line are unbiased.
C)The sampling distribution of the estimators will follow the Normal model.
D)All of these are true.
Unlock Deck
Unlock for access to all 60 flashcards in this deck.
Unlock Deck
k this deck
12
Use the following information to answer the question. A statistics professor is interested in learning whether there is a positive association between number of posts by online students on a message board and the final class average in an online statistics course. The computer output below shows the results from a regression model in which the final class average was predicted by the number of message board posts. Assume that the conditions of the linear regression model are satisfied.
Choose the correct observed value of the test statistic and the p- value. Round to the nearest thousandth.
A)t = 0.777, p = 0.002
B)t = 3.708, p = 0.002
C)t = 0.002, p = 3.707
D)t = 3.708, p = 0.005
Choose the correct observed value of the test statistic and the p- value. Round to the nearest thousandth.
A)t = 0.777, p = 0.002
B)t = 3.708, p = 0.002
C)t = 0.002, p = 3.707
D)t = 3.708, p = 0.005
Unlock Deck
Unlock for access to all 60 flashcards in this deck.
Unlock Deck
k this deck
13
Use the following information to answer the question. A statistics professor is interested in learning whether there is a positive association between number of posts by online students on a message board and the final class average in an online statistics course. The computer output below shows the results from a regression model in which the final class average was predicted by the number of message board posts. Assume that the conditions of the linear regression model are satisfied.
Choose the correct null and alternative hypothesis to test whether there is an association between final class average and number of message board posts.
A)H0: There is a linear association between the number of message board posts and the final class average. Ha: There is no linear association between the number of message board posts and the final class average.
B)H0: The correlation is positive. Ha: The correlation is zero.
C)H0: There is no linear association between the number of message board posts and the final class average. Ha: There is a positive linear association between the number of message board posts and the final class average.
D)None of these.
Unlock Deck
Unlock for access to all 60 flashcards in this deck.
Unlock Deck
k this deck
14
Use the following information to answer the question. A random sample of 30 couples who were also new home owners were asked to report the cost of their first house and their combined age when they married. The output of a regression analysis for predicting home cost from combined age is shown. Assume that the conditions of the linear regression model are satisfied.
What is the slope of the regression line? Choose the statement that is the correct interpretation of the slope in context.
A)The slope is 2122.75. On average, for each additional year in combined age, home cost is about $2,122.75 higher, in the sample.
B)The slope is 73.74. On average, for couples with a combined age over 73.74, the home cost is an additional $2,122.75 per year over 73.74.
C)The slope is 2122.75. On average, for each additional $2,122.75 in home cost, the combined age is about 1 year higher, in the sample.
D)The slope is 73.74. On average, for each additional year in combined age, the home cost is about $2,122.75 higher, in the sample.
Unlock Deck
Unlock for access to all 60 flashcards in this deck.
Unlock Deck
k this deck
15
Use the following information to answer the question. A random sample of 30 couples who were also new home owners were asked to report the cost of their first house and their combined age when they married. The output of a regression analysis for predicting home cost from combined age is shown. Assume that the conditions of the linear regression model are satisfied.
If the slope were 1, what would that say about the association?
A)If the slope were 1, it would mean that on average, for every additional year in combined age, the home cost would be $2,122.75 lower.
B)If the slope were 1, it would mean that on average, for every additional year in combined age, the home cost would be 1 dollar more.
C)If the slope were 1, it would mean that on average, for every additional year in combined age, the home cost would be $2,122.75 higher.
D)None of these.
Unlock Deck
Unlock for access to all 60 flashcards in this deck.
Unlock Deck
k this deck
16
Use the following information to answer the question. A high school girls cross country coach performs a regression to predict the finish times of runners in the 10k event from the number of minutes of training in the previous week. The output is shown below. Assume that the conditions of the linear regression model hold.
The coach wants to predict the finish time of his top runner who trained for 145 minutes the previous week. Should the coach use a confidence interval or a prediction interval?
A)Prediction Interval
B)Confidence Interval
The coach wants to predict the finish time of his top runner who trained for 145 minutes the previous week. Should the coach use a confidence interval or a prediction interval?
A)Prediction Interval
B)Confidence Interval
Unlock Deck
Unlock for access to all 60 flashcards in this deck.
Unlock Deck
k this deck
17
The regression output below is the result of testing whether there is an association between the number of practice test problems a student completed and the number of questions answered correctly on the test. Assume that the conditions of the linear regression model are satisfied. What is the 95% confidence interval for the intercept (rounded to the nearest hundredth)? Does this interval support the theory that the intercept is zero? Choose the statement that summarizes your answer in context.
A)(0.86, 1.36). This interval does not support the theory that the intercept could be zero. In this context the intercept is greater than zero so a student could expect to get a positive score on the test even if they did none of the practice problems.
B)(- 8.15, 3.90). This interval does not support the theory that the intercept could be zero. In this context this would mean that for approximately every two practice problems completed, the student could expect to get approximately one test question correct.
C)(- 8.15, 3.90). This interval supports the theory that the intercept could be zero. In this context this would mean that a student who completed zero practice test problems could reasonably expect to get a zero on the test.
D)None of these
Unlock Deck
Unlock for access to all 60 flashcards in this deck.
Unlock Deck
k this deck
18
Use the following information to answer the question. Below is the scatterplot showing the association between raw material (in tons)put into an injection molding machine each day (x), and the amount of scrap plastic (in tons)that is collected from the machine every 4 weeks (y). The residual plot of the data is also shown along with a QQ plot of the residuals.
Choose the statement that is true about the estimators for slope and intercept of a regression line when the conditions of the linear model hold.
A)The sampling distributions of the estimators follow the chi- square model.
B)The standard errors for the estimators must come from a population that is Normally distributed.
C)The estimators for the slope and intercept of a regression line are unbiased.
D)None of these
Unlock Deck
Unlock for access to all 60 flashcards in this deck.
Unlock Deck
k this deck
19
Use the following information to answer the question. A random sample of 30 married couples were asked to report the height of their spouse and the height of their biological parent of the same gender as their spouse. The output of a regression analysis for predicting spouse height from parent height is shown. Assume that the conditions of the linear regression model are satisfied.
Test the hypothesis that the slope is zero (significance level is 0.05), then choose the correct decision regarding the null hypothesis and the statement that correctly summarizes the conclusion.
A)Fail to reject H0. There is enough evidence to reject a slope of zero which is an indication that a linear association exists between parent height and spouse height.
B)Reject H0. We don't have enough evidence to reject a slope of zero which is an indication that no linear association exists between parent height and spouse height.
C)Reject H0. There is enough evidence to reject a slope of zero which is an indication that a linear association exists between parent height and spouse height.
D)Fail to reject H0. We don't have enough evidence to reject a slope of zero which is an indication that no linear association exists between parent height and spouse height.
Unlock Deck
Unlock for access to all 60 flashcards in this deck.
Unlock Deck
k this deck
20
Use the following information to answer the question. A high school boys cross country coach performs a regression to predict the finish times of runners in the 10k event from the number of minutes of training in the previous week. The output is shown below. Assume that the conditions of the linear regression model hold.
Suppose the coach's top runner trained for 180 minutes the previous week. If this runner participates in the 10k event, what is the coach's expected finish time for this runner? Can he be reasonably confident that this runner will beat the previous season's record of 43 minutes?
A)Expected finish time is 38.84 minutes. The coach can be confident that this runner will beat the previous season's record of 43 minutes because the interval contains the value of 43 minutes.
B)Expected finish time is 38.84 minutes. The coach cannot be confident that this runner will beat the previous season's record because the interval contains the value of 43 minutes. To be confident the interval would have to lie completely below 43 minutes.
C)Expected finish time is 65.84 minutes. The coach can be confident that this runner will beat the previous season's record of 43 minutes because the interval contains the value of 43 minutes.
D)Expected finish time is 65.84 minutes. The coach cannot be confident that this runner will beat the previous season's record because the interval contains the value of 43 minutes. To be confident the interval would have to lie completely below 43 minutes.
Unlock Deck
Unlock for access to all 60 flashcards in this deck.
Unlock Deck
k this deck
21
Which of the following is not true about residuals? If all the statements are true choose (d).
A)The residuals are the result of natural variation in the dependent variable.
B)The residuals can be described as the excess, due to randomness, that doesn't fit on the line.
C)The residuals can be determined by finding the difference between the actual observed value and the predicted dependent variable.
D)All of these are true.
Unlock Deck
Unlock for access to all 60 flashcards in this deck.
Unlock Deck
k this deck
22
Use the following information to answer the question. Below is the scatterplot showing the association between raw material (in tons)put into an injection molding machine each day (x), and the amount of scrap plastic (in tons)that is collected from the machine every 4 weeks (y). The residual plot of the data is also shown along with a QQ plot of the residuals.
Choose the statement that best describes whether the condition for linearity does or does not hold for the linear regression model.
A)The residual plot shows no trend-- the residual plot is consistent with the claim of linearity.
B)The residual plot shows a horizontal trend-- the residual plot is not consistent with the claim of linearity.
C)The residual plot does not display a fan shape-- the residual plot is consistent with the claim of linearity.
D)The QQ plot mostly follows a straight line trend-- the QQ plot is consistent with the claim of linearity.
Unlock Deck
Unlock for access to all 60 flashcards in this deck.
Unlock Deck
k this deck
23
Use the following information to answer the question. A humanities professor is interesting in learning whether there is a positive association between average online homework scores and the final class average in an online humanities course. The computer output below shows the results from a regression model in which the final class average was predicted by the average online homework score. Assume that the conditions of the linear regression model are satisfied.
Choose the correct decision regarding the null hypothesis and the correct conclusion. State your conclusion using a significance level of 5%.
A)Reject H0. There is not enough evidence to conclude that the final class average is positively associated with the average online homework score.
B)Fail to reject H0. There is enough evidence to conclude that the final class average is positively associated with the average online homework score.
C)Fail to reject H0. There is not enough evidence to conclude that the final class average is positively associated with the average online homework score.
D)Reject H0. There is enough evidence to conclude that the final class average is positively associated with the average online homework score.
Unlock Deck
Unlock for access to all 60 flashcards in this deck.
Unlock Deck
k this deck
24
Use the following information to answer the question. Below is the scatterplot showing the association between raw material (in tons)put into an injection molding machine each day (x), and the amount of scrap plastic (in tons)that is collected from the machine every 4 weeks (y). The residual plot of the data is also shown along with a QQ plot of the residuals.
Choose the statement that best describes whether the condition for normality of errors does or does not hold for the linear regression model.
A)The residual plot shows no trend, therefore the normality condition is not satisfied.
B)The residual plot does not display a fan shape, therefore the normality condition is satisfied.
C)The QQ plot mostly follows a straight line, therefore the normality condition is satisfied.
D)The residual plot shows no trend, therefore the normality condition is satisfied.
Unlock Deck
Unlock for access to all 60 flashcards in this deck.
Unlock Deck
k this deck
25
Use the following information to answer the question. A statistics professor is interested in learning whether there is a positive association between number of posts by online students on a message board and the final class average in an online statistics course. The computer output below shows the results from a regression model in which the final class average was predicted by the number of message board posts. Assume that the conditions of the linear regression model are satisfied.
Choose the correct decision regarding the null hypothesis and the correct conclusion. State your conclusion using a significance level of 5%.
A)Fail to reject H0. There is enough evidence to conclude that the final class average is positively associated with the number of message board posts.
B)Fail to reject H0. There is not enough evidence to conclude that the final class average is positively associated with the number of message board posts.
C)Reject H0. There is enough evidence to conclude that the final class average is positively associated with the number of message board posts.
D)Reject H0. There is not enough evidence to conclude that the final class average is positively associated with the number of message board posts.
Unlock Deck
Unlock for access to all 60 flashcards in this deck.
Unlock Deck
k this deck
26
Use the following information to answer the question. Below is the scatterplot showing the association between miles driven in a semi truck (x), and the amount of tread wear on the tires (y). The residual plot of the data is also shown along with a QQ plot of the residuals.
Choose the statement that best describes whether the condition for normality of errors does or does not hold for the linear regression model.
A)The residual plot shows no trend, therefore the normality condition is satisfied.
B)The QQ plot mostly follows a straight line, therefore the normality condition is satisfied.
C)The residual plot does not display a fan shape, therefore the normality condition is satisfied.
D)The residual mostly follows a horizontal line which would have a slope of zero, therefore the normality condition is not satisfied.
Unlock Deck
Unlock for access to all 60 flashcards in this deck.
Unlock Deck
k this deck
27
Use the following information to answer the question. A high school boys cross country coach performs a regression to predict the finish times of runners in the 10k event from the number of minutes of training in the previous week. The output is shown below. Assume that the conditions of the linear regression model hold.
The coach wants to predict the finish time of his top runner who trained for 180 minutes the previous week. Should the coach use a confidence interval or a prediction interval?
A)Confidence Interval
B)Prediction Interval
The coach wants to predict the finish time of his top runner who trained for 180 minutes the previous week. Should the coach use a confidence interval or a prediction interval?
A)Confidence Interval
B)Prediction Interval
Unlock Deck
Unlock for access to all 60 flashcards in this deck.
Unlock Deck
k this deck
28
Environmental biologists studying the relationship between the number of owls in a forested region and the number of field mice in the region believe that the deterministic component of the relationship is a straight line. A scatterplot shows that even though the general trend is linear, the points do not fall exactly on a straight line. Which of the following factors might account for the random component of this regression model?
A)Variation in the size of the mice might cause variation in the amount of mice consumed by owls.
B)Different size owls might affect the number of mice eaten.
C)Variability might appear in the instrument used to count mice.
D)All of these are possible factors that could account for the random component of the regression model.
Unlock Deck
Unlock for access to all 60 flashcards in this deck.
Unlock Deck
k this deck
29
Of the following conditions, which one can fail yet produce a regression model that is reasonably good, in many cases, if the sample size is large?
A)Normality of errors
B)Independence of errors
C)Linearity
D)None of these
A)Normality of errors
B)Independence of errors
C)Linearity
D)None of these
Unlock Deck
Unlock for access to all 60 flashcards in this deck.
Unlock Deck
k this deck
30
Use the following information to answer the question. A random sample of 30 married couples were asked to report the height of their spouse and the height of their biological parent of the same gender as their spouse. The output of a regression analysis for predicting spouse height from parent height is shown. Assume that the conditions of the linear regression model are satisfied.
What is the slope of the regression line? Choose the statement that is the correct interpretation of the slope in context.
A)The slope is 0.25. On average, for each inch taller a parent is, the spouse is about 0.25 inches taller, in the sample.
B)The slope is 48.40. On average, for each inch taller a parent is, the spouse is about 48.40 inches taller, in the sample.
C)The slope is 0.25. On average, for each 0.25 inches taller a parent is, the spouse is about 1 inch taller, in the sample.
D)The slope is 48.40. On average, for each inch taller a parent is, the spouse is about 0.25 inches taller, in the sample.
Unlock Deck
Unlock for access to all 60 flashcards in this deck.
Unlock Deck
k this deck
31
Which of the following statements is true about prediction intervals?
A)The width of the prediction interval is affected by the size of the standard deviation of the population distribution.
B)A prediction interval is concerned with predicting values for individuals.
C)Prediction intervals are wider than confidence intervals because there is more uncertainty in predicting an individual's value.
D)All of these statements are true.
Unlock Deck
Unlock for access to all 60 flashcards in this deck.
Unlock Deck
k this deck
32
Use the following information to answer the question. A humanities professor is interesting in learning whether there is a positive association between average online homework scores and the final class average in an online humanities course. The computer output below shows the results from a regression model in which the final class average was predicted by the average online homework score. Assume that the conditions of the linear regression model are satisfied.
Choose the correct null and alternative hypothesis to test whether there is an association between final class average and average online homework scores.
A)H0: The correlation is positive. Ha: The correlation is zero.
B)H0: There is no linear association between the final class average and the average online homework score. Ha: There is a positive linear association between the final class average and the average online homework score.
C)H0: There is a linear association between the final class average and the average online homework score. Ha: There is no linear association between the final class average and the average online homework score.
D)None of these.
Unlock Deck
Unlock for access to all 60 flashcards in this deck.
Unlock Deck
k this deck
33
Which of the following statements is not true about the constant standard deviation condition of the linear regression model?
A)A constant standard deviation means that the vertical spread of the y- values about the line is the same across the entire line.
B)A residual plot can highlight the existence of a nonconstant standard deviation even when it is hard to see in the original scatterplot.
C)A fan shape in a residual plot indicates that the constant standard deviation condition does not hold.
D)All of these are true about the constant standard condition.
Unlock Deck
Unlock for access to all 60 flashcards in this deck.
Unlock Deck
k this deck
34
Which of the following is not true about residuals? If all the statements are true choose (d).
A)The residuals can be determined by finding the difference between the actual observed value and the predicted dependent variable.
B)The residuals are the result of natural variation in the independent variable.
C)The residuals can be described as the excess, due to randomness, that doesn't fit on the line.
D)All of these are true.
Unlock Deck
Unlock for access to all 60 flashcards in this deck.
Unlock Deck
k this deck
35
Which of the following is not a condition of the linear regression model?
A)Normality of errors
B)Linearity
C)Residuals must be normally distributed
D)Constant Standard Deviation
A)Normality of errors
B)Linearity
C)Residuals must be normally distributed
D)Constant Standard Deviation
Unlock Deck
Unlock for access to all 60 flashcards in this deck.
Unlock Deck
k this deck
36
Suppose that you were presented with data showing the association between days absent from class and final class average. Which of the following residual plots below suggests that the association between number of days absent from class and final class average is linear?
A)
B)
C)
D)
A)
B)
C)
D)
Unlock Deck
Unlock for access to all 60 flashcards in this deck.
Unlock Deck
k this deck
37
Which of the following statements is not true about prediction intervals?
A)Prediction intervals are wider than confidence intervals because there is more uncertainty in predicting an individual's value.
B)The width of the prediction interval is affected by the size of the standard deviation of the population distribution.
C)A prediction interval is concerned with estimating a population parameter.
D)All of these statements are true.
Unlock Deck
Unlock for access to all 60 flashcards in this deck.
Unlock Deck
k this deck
38
Use the following information to answer the question. A random sample of 30 married couples were asked to report the height of their spouse and the height of their biological parent of the same gender as their spouse. The output of a regression analysis for predicting spouse height from parent height is shown. Assume that the conditions of the linear regression model are satisfied.
If the intercept was 0 and the slope was 1, what would that say about the association?
A)It would mean that on average, the spouse is 1 inch taller than the parent.
B)It would mean that the spouse height should not be predicting using parent height.
C)It would mean that on average, the spouse and the parent are the same height.
D)None of these.
Unlock Deck
Unlock for access to all 60 flashcards in this deck.
Unlock Deck
k this deck
39
Which of the following is not true about the coefficient of determination, r2?
A)In order to interpret r2 the linearity condition of the linear regression model must be satisfied.
B)The coefficient of determination, r2, is a statistic that will give some information about how well the data fits the model, but it should not be the only piece of information taken into consideration when determining how useful a linear model might be.
C)A hypothesis test should be conducted verify that r2 is large enough to conclude a linear relationship exists.
D)The coefficient of determination, r2, ranges from 0% to 100% and represents the amount of variability in the response variable (y)explained by the regression line.
Unlock Deck
Unlock for access to all 60 flashcards in this deck.
Unlock Deck
k this deck
40
Use the following information to answer the question. Below is the scatterplot showing the association between miles driven in a semi truck (x), and the amount of tread wear on the tires (y). The residual plot of the data is also shown along with a QQ plot of the residuals.
Based on the plots provided, choose the statement that best describes whether the condition for constant standard deviation does or does not hold for the linear regression model.
A)The residual plot does not display a fan shape-- the residual plot is consistent with the claim of constant standard deviation.
B)The scatterplot shows a linear trend-- the scatterplot is not consistent with the claim of constant standard deviation.
C)The QQ plot mostly follows a straight line-- the QQ plot is consistent with the claim of constant standard deviation.
D)The residual plot shows no trend-- the residual plot is not consistent with the claim of constant standard deviation.
Unlock Deck
Unlock for access to all 60 flashcards in this deck.
Unlock Deck
k this deck
41
Suppose that you were presented with data showing the association between days absent from class and final class average. Use the following residual plots, based on the data, to answer the question.
Which of the residual plots above would suggests that the condition for constant standard deviation might not be satisfied? Explain.
Which of the residual plots above would suggests that the condition for constant standard deviation might not be satisfied? Explain.
Unlock Deck
Unlock for access to all 60 flashcards in this deck.
Unlock Deck
k this deck
42
Use the following information to answer the question. The pulse rate of a random sample of 30 second graders was recorded before and after a fifteen minute recess. The output of a regression analysis for predicting pulse rate after recess from pulse rate before recess is shown. Assume that the conditions of the linear regression model are satisfied.
If the intercept was 0 and the slope was 1, explain how the linear model would be interpreted in context.
If the intercept was 0 and the slope was 1, explain how the linear model would be interpreted in context.
Unlock Deck
Unlock for access to all 60 flashcards in this deck.
Unlock Deck
k this deck
43
Test the hypothesis that the slope is zero (significance level is 0.05), then state the correct decision regarding the null hypothesis and write a statement that correctly summarizes the conclusion in context.
Unlock Deck
Unlock for access to all 60 flashcards in this deck.
Unlock Deck
k this deck
44
Explain how a residual plot can be useful in determining whether the condition for linearity and the condition for a constant standard deviation have been satisfied.
Unlock Deck
Unlock for access to all 60 flashcards in this deck.
Unlock Deck
k this deck
45
Explain what residuals are. Where do residuals come from? How are residuals calculated? Complete the table below by calculating the residuals for the following small data set. The linear model relating x and y is y = 5 - 10x.
Unlock Deck
Unlock for access to all 60 flashcards in this deck.
Unlock Deck
k this deck
46
Suppose that you were presented with data showing the association between days absent from class and final class average. Use the following residual plots, based on the data, to answer the question.
Which of the residual plots above would suggest that the association between number of days absent from class and final class average is linear? Explain.
Which of the residual plots above would suggest that the association between number of days absent from class and final class average is linear? Explain.
Unlock Deck
Unlock for access to all 60 flashcards in this deck.
Unlock Deck
k this deck
47
Use the following information to answer the question. Below is the scatterplot showing the association between the number of workers on an assembly team (x), and the number of parts assembled in an 8- hour shift (y). The residual plot of the data is also shown along with a QQ plot of the residuals.
Use the plot(s)above to explain whether the condition for linearity is satisfied.
Use the plot(s)above to explain whether the condition for linearity is satisfied.
Unlock Deck
Unlock for access to all 60 flashcards in this deck.
Unlock Deck
k this deck
48
Use the following information to answer the question. Below is the scatterplot showing the association between the number of workers on an assembly team (x), and the number of parts assembled in an 8- hour shift (y). The residual plot of the data is also shown along with a QQ plot of the residuals.
Use the plot(s)above to explain whether the condition for constant standard deviation is satisfied.
Use the plot(s)above to explain whether the condition for constant standard deviation is satisfied.
Unlock Deck
Unlock for access to all 60 flashcards in this deck.
Unlock Deck
k this deck
49
Researchers studying the relationship between the number of fat grams and the net weight in ounces of a fun size package of peanut M & M's believe that the deterministic component of the relationship is a straight line. A scatterplot shows that even though the general trend is linear, the points do not fall exactly on a straight line. Describe two factors that might account for the random component of this regression model.
Unlock Deck
Unlock for access to all 60 flashcards in this deck.
Unlock Deck
k this deck
50
Use the following information to answer the question. A high school boys track and field coach performs a regression to predict the vault height (in feet)of a pole vault from the number of minutes of training in the previous week. The output is shown below. Assume that the conditions of the linear regression model hold.
The coach wants to project what the jump height of his top pole vaulter will be who trained for 175 minutes the previous week. Should the coach use a confidence interval or a prediction interval?
The coach wants to project what the jump height of his top pole vaulter will be who trained for 175 minutes the previous week. Should the coach use a confidence interval or a prediction interval?
Unlock Deck
Unlock for access to all 60 flashcards in this deck.
Unlock Deck
k this deck
51
Use the following information to answer the question. An engineer is interested in learning whether there is an association between temperature (°F)and the strength of an automotive plastic cup holder which is measured by finding the pounds per square inch (psi)it takes to break the cup holder. The computer output below shows the results from a regression model in which the breaking point in psi was predicted by the temperature. Assume that the conditions of the linear regression model are satisfied.
State the null and alternative hypothesis to test whether there is an association between temperature and break strength two different ways.
State the null and alternative hypothesis to test whether there is an association between temperature and break strength two different ways.
Unlock Deck
Unlock for access to all 60 flashcards in this deck.
Unlock Deck
k this deck
52
The regression output below is the result of testing whether there is an association between the number of practice test problems a student completed and the number of questions answered correctly on the test. Assume that the conditions of the linear regression model are satisfied. What is the 95% confidence interval for the slope (rounded to the nearest hundredth)? Does this interval support the theory that the slope is zero? Write a statement that summarizes your answer in context.
Unlock Deck
Unlock for access to all 60 flashcards in this deck.
Unlock Deck
k this deck
53
Use the following information to answer the question. An engineer is interested in learning whether there is an association between temperature (°F)and the strength of an automotive plastic cup holder which is measured by finding the pounds per square inch (psi)it takes to break the cup holder. The computer output below shows the results from a regression model in which the breaking point in psi was predicted by the temperature. Assume that the conditions of the linear regression model are satisfied.
What is the observed value of the test statistic and the p- value? Round to the nearest thousandth.
What is the observed value of the test statistic and the p- value? Round to the nearest thousandth.
Unlock Deck
Unlock for access to all 60 flashcards in this deck.
Unlock Deck
k this deck
54
Consider the following statement: "When the conditions of the linear model hold, the estimators for slope and intercept are unbiased." What is meant by the word unbiased in this context?
Unlock Deck
Unlock for access to all 60 flashcards in this deck.
Unlock Deck
k this deck
55
Use the following information to answer the question. The pulse rate of a random sample of 30 second graders was recorded before and after a fifteen minute recess. The output of a regression analysis for predicting pulse rate after recess from pulse rate before recess is shown. Assume that the conditions of the linear regression model are satisfied.
State the slope of the regression line. Write a sentence explaining what this slope means in this context.
State the slope of the regression line. Write a sentence explaining what this slope means in this context.
Unlock Deck
Unlock for access to all 60 flashcards in this deck.
Unlock Deck
k this deck
56
Use the following information to answer the question. A high school boys track and field coach performs a regression to predict the vault height (in feet)of a pole vault from the number of minutes of training in the previous week. The output is shown below. Assume that the conditions of the linear regression model hold.
Suppose the coach's top pole vaulter trained for 175 minutes the previous week. If this athlete participates in the pole vault event, what is the coach's expected jump height for this athlete? Can he be reasonably confident that this athlete will beat the previous season's record of 19.8 feet? Explain.
Suppose the coach's top pole vaulter trained for 175 minutes the previous week. If this athlete participates in the pole vault event, what is the coach's expected jump height for this athlete? Can he be reasonably confident that this athlete will beat the previous season's record of 19.8 feet? Explain.
Unlock Deck
Unlock for access to all 60 flashcards in this deck.
Unlock Deck
k this deck
57
Explain the difference between confidence intervals and prediction intervals. Be sure to include the type of situation in which each type of interval would be used. Which interval is likely to be wider and why?
Unlock Deck
Unlock for access to all 60 flashcards in this deck.
Unlock Deck
k this deck
58
Use the following information to answer the question. Below is the scatterplot showing the association between the number of workers on an assembly team (x), and the number of parts assembled in an 8- hour shift (y). The residual plot of the data is also shown along with a QQ plot of the residuals.
Use the plot(s)above to explain whether the condition for normality of errors is satisfied.
Use the plot(s)above to explain whether the condition for normality of errors is satisfied.
Unlock Deck
Unlock for access to all 60 flashcards in this deck.
Unlock Deck
k this deck
59
Use the following information to answer the question. An engineer is interested in learning whether there is an association between temperature (°F)and the strength of an automotive plastic cup holder which is measured by finding the pounds per square inch (psi)it takes to break the cup holder. The computer output below shows the results from a regression model in which the breaking point in psi was predicted by the temperature. Assume that the conditions of the linear regression model are satisfied.
State the two conditions that must be satisfied, without exception, to make inferences using a linear model.
State the two conditions that must be satisfied, without exception, to make inferences using a linear model.
Unlock Deck
Unlock for access to all 60 flashcards in this deck.
Unlock Deck
k this deck
60
Use the following information to answer the question. An engineer is interested in learning whether there is an association between temperature (°F)and the strength of an automotive plastic cup holder which is measured by finding the pounds per square inch (psi)it takes to break the cup holder. The computer output below shows the results from a regression model in which the breaking point in psi was predicted by the temperature. Assume that the conditions of the linear regression model are satisfied.
State the decision regarding the null hypothesis and the correct conclusion. State your conclusion using a significance level of 5%.
State the decision regarding the null hypothesis and the correct conclusion. State your conclusion using a significance level of 5%.
Unlock Deck
Unlock for access to all 60 flashcards in this deck.
Unlock Deck
k this deck
Unlock Deck
Unlock for access to all 60 flashcards in this deck.


