Deck 1: An Introduction to Business Statistics
Full screen (f)
Question
Question
Question
Question
Question
Question
Question
Question
Question
Question
Question
Question
Question
Question
Question
Question
Question
Question
Question
Question
Question
Question
Question
Question
Question
Question
Question
Question
Question
Question
Question
Question
Question
Question
Question
Question
Question
Question
Question
Question
Question
Question
Question
Question
Question
Question
Question
Question
Question
Question
Question
Question
Question
Question
Question
Question
Question
Question
Question
Question
Question
Using the following data table of the average hours per week spent on Internet activities by 15- to 18-year-olds for the years 1999-2008,construct the runs plot and interpret. 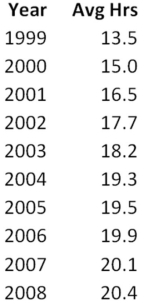
Question
Looking at the runs plot of gasoline prices over the past 30 months,describe what it tells us about the price of gas during these 30 months. 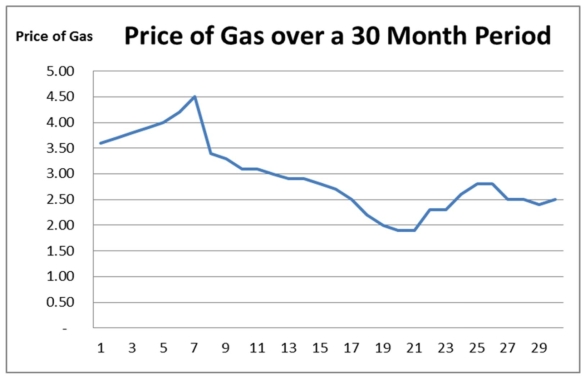
Question

Unlock Deck
Sign up to unlock the cards in this deck!
Unlock Deck
Unlock Deck
1/63
Play
Full screen (f)
Deck 1: An Introduction to Business Statistics
1
A population is a set of existing units.
True
2
In a data set of information on college business students,an example of an element is their cumulative GPA.
False
3
Selecting many different samples and running many different tests can eventually produce a result that makes a desired conclusion be true.
False
4
An example of a quantitative variable is the manufacturer of a car.
Unlock Deck
Unlock for access to all 63 flashcards in this deck.
Unlock Deck
k this deck
5
Cross-sectional data are data collected at the same point in time.
Unlock Deck
Unlock for access to all 63 flashcards in this deck.
Unlock Deck
k this deck
6
Using a nonrandom sample procedure in order to support a desired conclusion is an example of an unethical statistical procedure.
Unlock Deck
Unlock for access to all 63 flashcards in this deck.
Unlock Deck
k this deck
7
The number of sick days per month taken by employees for the last 10 years at Apex Co.is an example of time series data.
Unlock Deck
Unlock for access to all 63 flashcards in this deck.
Unlock Deck
k this deck
8
It is possible to use a random sample from one population to make statistical inferences about another related population.
Unlock Deck
Unlock for access to all 63 flashcards in this deck.
Unlock Deck
k this deck
9
If we examine some of the population measurements,we are conducting a census of the population.
Unlock Deck
Unlock for access to all 63 flashcards in this deck.
Unlock Deck
k this deck
10
In an experimental study,the aim is to manipulate or set the value of the response variable.
Unlock Deck
Unlock for access to all 63 flashcards in this deck.
Unlock Deck
k this deck
11
A quantitative variable can also be referred to as a categorical variable.
Unlock Deck
Unlock for access to all 63 flashcards in this deck.
Unlock Deck
k this deck
12
Statistical inference is the science of using a sample of measurements to make generalizations about the important aspects of a population of measurements.
Unlock Deck
Unlock for access to all 63 flashcards in this deck.
Unlock Deck
k this deck
13
The number of sick days taken by employees in 2008 for the top 10 technology companies is an example of time series data.
Unlock Deck
Unlock for access to all 63 flashcards in this deck.
Unlock Deck
k this deck
14
The science of describing the important aspects of a set of measures is called statistical inference.
Unlock Deck
Unlock for access to all 63 flashcards in this deck.
Unlock Deck
k this deck
15
Daily temperature in a local community collected over a 30-day time period is an example of cross-sectional data.
Unlock Deck
Unlock for access to all 63 flashcards in this deck.
Unlock Deck
k this deck
16
A random sample is selected so that every element in the population has the same chance of being included in the sample.
Unlock Deck
Unlock for access to all 63 flashcards in this deck.
Unlock Deck
k this deck
17
In an observational study,the variable of interest is called a response variable.
Unlock Deck
Unlock for access to all 63 flashcards in this deck.
Unlock Deck
k this deck
18
An example of a qualitative variable is the mileage of a car.
Unlock Deck
Unlock for access to all 63 flashcards in this deck.
Unlock Deck
k this deck
19
Time series data are data collected at the same time period.
Unlock Deck
Unlock for access to all 63 flashcards in this deck.
Unlock Deck
k this deck
20
Processes produce outputs over time.
Unlock Deck
Unlock for access to all 63 flashcards in this deck.
Unlock Deck
k this deck
21
Primary data are data collected by an individual.
Unlock Deck
Unlock for access to all 63 flashcards in this deck.
Unlock Deck
k this deck
22
An identification of police officers by rank would represent a(n)____________ level of measurement.
A)Nominative
B)Ordinal
C)Interval
D)Ratio
A)Nominative
B)Ordinal
C)Interval
D)Ratio
Unlock Deck
Unlock for access to all 63 flashcards in this deck.
Unlock Deck
k this deck
23
Data that are collected by an individual through personally planned experimentation or observation are _____________.
A)Secondary data
B)Quantitative data
C)Primary data
D)Variables
A)Secondary data
B)Quantitative data
C)Primary data
D)Variables
Unlock Deck
Unlock for access to all 63 flashcards in this deck.
Unlock Deck
k this deck
24
The two types of quantitative variables are:
A)Ordinal and ratio
B)Interval and ordinal
C)Nominative and ordinal
D)Interval and ratio
E)Nominative and interval
A)Ordinal and ratio
B)Interval and ordinal
C)Nominative and ordinal
D)Interval and ratio
E)Nominative and interval
Unlock Deck
Unlock for access to all 63 flashcards in this deck.
Unlock Deck
k this deck
25
__________ is a necessary component of a runs plot.
A)Observation over time
B)Qualitative variable
C)Random sampling of the data
D)Cross-sectional data
A)Observation over time
B)Qualitative variable
C)Random sampling of the data
D)Cross-sectional data
Unlock Deck
Unlock for access to all 63 flashcards in this deck.
Unlock Deck
k this deck
26
Which of the following is a categorical variable?
A)Air temperature
B)Bank account balance
C)Daily sales in a store
D)Whether a person has a traffic violation
E)Value of company stock
A)Air temperature
B)Bank account balance
C)Daily sales in a store
D)Whether a person has a traffic violation
E)Value of company stock
Unlock Deck
Unlock for access to all 63 flashcards in this deck.
Unlock Deck
k this deck
27
Measurements from a population are called:
A)Elements.
B)Observations.
C)Variables.
D)Processes.
A)Elements.
B)Observations.
C)Variables.
D)Processes.
Unlock Deck
Unlock for access to all 63 flashcards in this deck.
Unlock Deck
k this deck
28
Jersey numbers of soccer players is an example of a(n)___________ variable.
A)Nominative
B)Ordinal
C)Interval
D)Ratio
A)Nominative
B)Ordinal
C)Interval
D)Ratio
Unlock Deck
Unlock for access to all 63 flashcards in this deck.
Unlock Deck
k this deck
29
Which of the following is a quantitative variable?
A)The manufacturer of a cell phone
B)A person's gender
C)Mileage of a car
D)Whether a person is a college graduate
E)Whether a person has a charge account
A)The manufacturer of a cell phone
B)A person's gender
C)Mileage of a car
D)Whether a person is a college graduate
E)Whether a person has a charge account
Unlock Deck
Unlock for access to all 63 flashcards in this deck.
Unlock Deck
k this deck
30
A ratio variable has the following characteristic:
A)Meaningful order
B)Inherently defined zero value
C)Categorical in nature
D)Predictable
A)Meaningful order
B)Inherently defined zero value
C)Categorical in nature
D)Predictable
Unlock Deck
Unlock for access to all 63 flashcards in this deck.
Unlock Deck
k this deck
31
The weight of a chemical compound used in an experiment that is obtained using a well-adjusted scale represents a(n)_____________ level of measurement.
A)Nominative
B)Ordinal
C)Interval
D)Ratio
A)Nominative
B)Ordinal
C)Interval
D)Ratio
Unlock Deck
Unlock for access to all 63 flashcards in this deck.
Unlock Deck
k this deck
32
______________ is the science of using a sample to make generalizations about the important aspects of a population.
A)Time series analysis
B)Descriptive statistics
C)Random sample
D)Statistical inference
A)Time series analysis
B)Descriptive statistics
C)Random sample
D)Statistical inference
Unlock Deck
Unlock for access to all 63 flashcards in this deck.
Unlock Deck
k this deck
33
Examining all population measurements is called a _____________.
A)Census
B)Frame
C)Sample
D)Variable
A)Census
B)Frame
C)Sample
D)Variable
Unlock Deck
Unlock for access to all 63 flashcards in this deck.
Unlock Deck
k this deck
34
A(n)_____________ variable is a qualitative variable such that there is no meaningful ordering or ranking of the categories.
A)Ratio
B)Ordinal
C)Nominative
D)Interval
A)Ratio
B)Ordinal
C)Nominative
D)Interval
Unlock Deck
Unlock for access to all 63 flashcards in this deck.
Unlock Deck
k this deck
35
Secondary data are data taken from an existing source.
Unlock Deck
Unlock for access to all 63 flashcards in this deck.
Unlock Deck
k this deck
36
A person's telephone area code is an example of a(n)_____________ variable.
A)Nominative
B)Ordinal
C)Interval
D)Ratio
A)Nominative
B)Ordinal
C)Interval
D)Ratio
Unlock Deck
Unlock for access to all 63 flashcards in this deck.
Unlock Deck
k this deck
37
College entrance exam scores,such as SAT scores,are an example of a(n)_____________ variable.
A)Ordinal
B)Ratio
C)Nominative
D)Interval
A)Ordinal
B)Ratio
C)Nominative
D)Interval
Unlock Deck
Unlock for access to all 63 flashcards in this deck.
Unlock Deck
k this deck
38
Temperature (in degrees Fahrenheit)is an example of a(n)__________ variable.
A)Nominative
B)Ordinal
C)Interval
D)Ratio
A)Nominative
B)Ordinal
C)Interval
D)Ratio
Unlock Deck
Unlock for access to all 63 flashcards in this deck.
Unlock Deck
k this deck
39
The number of miles a truck is driven before it is overhauled is an example of a(n)_____________ variable.
A)Nominative
B)Ordinal
C)Interval
D)Ratio
A)Nominative
B)Ordinal
C)Interval
D)Ratio
Unlock Deck
Unlock for access to all 63 flashcards in this deck.
Unlock Deck
k this deck
40
Any characteristic of a population unit is a(n):
A)Measurement
B)Sample
C)Observation
D)Variable
A)Measurement
B)Sample
C)Observation
D)Variable
Unlock Deck
Unlock for access to all 63 flashcards in this deck.
Unlock Deck
k this deck
41
A ____________ variable can have values that are numbers on the real number line.
A)Qualitative
B)Quantitative
C)Categorical
D)Nominative
A)Qualitative
B)Quantitative
C)Categorical
D)Nominative
Unlock Deck
Unlock for access to all 63 flashcards in this deck.
Unlock Deck
k this deck
42
A ___________ is a display of individual measurements versus time.
A)Runs plot
B)Statistical analysis
C)Random sample
D)Measurement
A)Runs plot
B)Statistical analysis
C)Random sample
D)Measurement
Unlock Deck
Unlock for access to all 63 flashcards in this deck.
Unlock Deck
k this deck
43
A(n)____________ variable can have values that indicate into which of several categories of a population it belongs.
A)Qualitative
B)Quantitative
C)Ratio
D)Interval
A)Qualitative
B)Quantitative
C)Ratio
D)Interval
Unlock Deck
Unlock for access to all 63 flashcards in this deck.
Unlock Deck
k this deck
44
A study is being conducted on the effect of gas price on the number of miles driven in a given month.Residents in two cities,one on the East Coast and one on the West Coast are randomly selected and asked to complete a questionnaire on the type of car they drive,the number of miles they live from work,the number of children under 18 in their household,their monthly income,and the number of miles they have driven over the past 30 days.List the response variable(s).
Unlock Deck
Unlock for access to all 63 flashcards in this deck.
Unlock Deck
k this deck
45
If we collect data on the number of wins each team in the NFL had during the 2011-12 season,we have _____________ data.
A)Cross-sectional
B)Time series
A)Cross-sectional
B)Time series
Unlock Deck
Unlock for access to all 63 flashcards in this deck.
Unlock Deck
k this deck
46
Any characteristic of an element is called a ____________.
A)Set
B)Process
C)Variable
D)Census
A)Set
B)Process
C)Variable
D)Census
Unlock Deck
Unlock for access to all 63 flashcards in this deck.
Unlock Deck
k this deck
47
The change in the daily price of a stock is what type of variable?
A)Qualitative
B)Ordinal
C)Random
D)Quantitative
A)Qualitative
B)Ordinal
C)Random
D)Quantitative
Unlock Deck
Unlock for access to all 63 flashcards in this deck.
Unlock Deck
k this deck
48
Data collected for a particular study are referred to as a data ____________.
A)Variable
B)Measurement
C)Set
D)Element
A)Variable
B)Measurement
C)Set
D)Element
Unlock Deck
Unlock for access to all 63 flashcards in this deck.
Unlock Deck
k this deck
49
The process of assigning a value of a variable to each element in a data set is called ___________.
A)Sampling
B)Measurement
C)Experimental analysis
D)Observational analysis
A)Sampling
B)Measurement
C)Experimental analysis
D)Observational analysis
Unlock Deck
Unlock for access to all 63 flashcards in this deck.
Unlock Deck
k this deck
50
___________ refers to describing the important aspects of a set of measurements.
A)Cross-sectional analysis
B)Runs plot
C)Descriptive statistics
D)Time series analysis
A)Cross-sectional analysis
B)Runs plot
C)Descriptive statistics
D)Time series analysis
Unlock Deck
Unlock for access to all 63 flashcards in this deck.
Unlock Deck
k this deck
51
A set of all elements we wish to study is called a ____________.
A)Sample
B)Process
C)Census
D)Population
A)Sample
B)Process
C)Census
D)Population
Unlock Deck
Unlock for access to all 63 flashcards in this deck.
Unlock Deck
k this deck
52
A ____________ is a subset of the units in a population.
A)Census
B)Process
C)Sample
D)Variable
A)Census
B)Process
C)Sample
D)Variable
Unlock Deck
Unlock for access to all 63 flashcards in this deck.
Unlock Deck
k this deck
53
A sequence of operations that takes inputs and turns them into outputs is a ____________.
A)Process
B)Statistical inference
C)Runs plot
D)Random sampling
A)Process
B)Statistical inference
C)Runs plot
D)Random sampling
Unlock Deck
Unlock for access to all 63 flashcards in this deck.
Unlock Deck
k this deck
54
Which of the following is NOT an example of unethical statistical practices?
A)Inappropriate interpretation of statistical results
B)Using graphs to make statistical inferences
C)Improper sampling
D)Descriptive measures that mislead the user
E)None of these
A)Inappropriate interpretation of statistical results
B)Using graphs to make statistical inferences
C)Improper sampling
D)Descriptive measures that mislead the user
E)None of these
Unlock Deck
Unlock for access to all 63 flashcards in this deck.
Unlock Deck
k this deck
55
One method of determining whether a sample being studied can be used to make statistical inferences about the population is to:
A)Run a descriptive statistical analysis
B)Calculate a proportion
C)Create a cross-sectional data analysis
D)Produce a runs plot
A)Run a descriptive statistical analysis
B)Calculate a proportion
C)Create a cross-sectional data analysis
D)Produce a runs plot
Unlock Deck
Unlock for access to all 63 flashcards in this deck.
Unlock Deck
k this deck
56
If we collect data on the number of wins the Dallas Cowboys earned each of the past 10 years,we have _____________ data.
A)Cross-sectional
B)Time series
A)Cross-sectional
B)Time series
Unlock Deck
Unlock for access to all 63 flashcards in this deck.
Unlock Deck
k this deck
57
When the data being studied are gathered from a published source,this is referred to as a(n)_______________.
A)Existing data source
B)Observational data source
C)Experimental data source
D)Cross-sectional data source
A)Existing data source
B)Observational data source
C)Experimental data source
D)Cross-sectional data source
Unlock Deck
Unlock for access to all 63 flashcards in this deck.
Unlock Deck
k this deck
58
A data set provides information about some group of individual _____________.
A)Variables
B)Elements
C)Statistics
D)Measurements
A)Variables
B)Elements
C)Statistics
D)Measurements
Unlock Deck
Unlock for access to all 63 flashcards in this deck.
Unlock Deck
k this deck
59
A study is being conducted on the effect of gas price on the number of miles driven in a given month.Residents in two cities,one on the East Coast and one on the West Coast are randomly selected and asked to complete a questionnaire on the type of car they drive,the number of miles they live from work,the number of children under 18 in their household,their monthly income,and the number of miles they have driven over the past 30 days.Is this an experimental or observational study?
Unlock Deck
Unlock for access to all 63 flashcards in this deck.
Unlock Deck
k this deck
60
Statistical ____________ refers to using a sample of measurements and making generalizations about the important aspects of a population.
A)Sampling
B)Process
C)Analysis
D)Inference
A)Sampling
B)Process
C)Analysis
D)Inference
Unlock Deck
Unlock for access to all 63 flashcards in this deck.
Unlock Deck
k this deck
61
Using the following data table of the average hours per week spent on Internet activities by 15- to 18-year-olds for the years 1999-2008,construct the runs plot and interpret.
Unlock Deck
Unlock for access to all 63 flashcards in this deck.
Unlock Deck
k this deck
62
Looking at the runs plot of gasoline prices over the past 30 months,describe what it tells us about the price of gas during these 30 months.
Unlock Deck
Unlock for access to all 63 flashcards in this deck.
Unlock Deck
k this deck
63
A study is being conducted on the effect of gas price on the number of miles driven in a given month.Residents in two cities,one on the East Coast and one on the West Coast are randomly selected and asked to complete a questionnaire on the type of car they drive,the number of miles they live from work,the number of children under 18 in their household,their monthly income,and the number of miles they have driven over the past 30 days.List the factor(s).
Unlock Deck
Unlock for access to all 63 flashcards in this deck.
Unlock Deck
k this deck
Unlock Deck
Unlock for access to all 63 flashcards in this deck.


