Deck 5: Joint Probability Distributions and Random Samples
Full screen (f)
Question
Question
Abby and Bianca have agreed to meet for lunch between noon and 1:00 P.M. Denote Abby's arrival time by X, Bianca's by Y, and suppose X and Y are independent with pdf's. ![Abby and Bianca have agreed to meet for lunch between noon and 1:00 P.M. Denote Abby's arrival time by X, Bianca's by Y, and suppose X and Y are independent with pdf's. What is the expected amount of time that the one who arrives first must wait for the other person? [Hint: h(X, Y ) = |X - Y|.]<div style=padding-top: 35px>](https://d2lvgg3v3hfg70.cloudfront.net/TB3498/11eb0e05_3e2e_29d2_9431_d5133f0150a6_TB3498_11.jpg)
![Abby and Bianca have agreed to meet for lunch between noon and 1:00 P.M. Denote Abby's arrival time by X, Bianca's by Y, and suppose X and Y are independent with pdf's. What is the expected amount of time that the one who arrives first must wait for the other person? [Hint: h(X, Y ) = |X - Y|.]<div style=padding-top: 35px>](https://d2lvgg3v3hfg70.cloudfront.net/TB3498/11eb0e05_3e2e_50e3_9431_4da7b91d5cef_TB3498_11.jpg)
![Abby and Bianca have agreed to meet for lunch between noon and 1:00 P.M. Denote Abby's arrival time by X, Bianca's by Y, and suppose X and Y are independent with pdf's. What is the expected amount of time that the one who arrives first must wait for the other person? [Hint: h(X, Y ) = |X - Y|.]<div style=padding-top: 35px>](https://d2lvgg3v3hfg70.cloudfront.net/TB3498/11eb0e05_3e2e_50e4_9431_97d69e93ffff_TB3498_11.jpg) What is the expected amount of time that the one who arrives first must wait for the other person? [Hint: h(X, Y ) = |X - Y|.]
What is the expected amount of time that the one who arrives first must wait for the other person? [Hint: h(X, Y ) = |X - Y|.]
What is the expected amount of time that the one who arrives first must wait for the other person? [Hint: h(X, Y ) = |X - Y|.] Question
Show that if  Under what conditions will
Under what conditions will Question
Each front tire on a particular type of vehicle is supposed to be filled to a pressure of 26 psi. Suppose the actual air pressure in each tire is a random variable-X for the right tire and Y for the left tire, with joint pdf 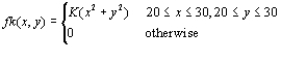
a. What is the value of K?
b. What is the probability that both tires are underfilled?
c. What is the probability that the difference in air pressure between the two tires is at most 2 psi?
d. Determine the (marginal) distribution of air pressure in the right tire alone.
e. Are X and Y independent random variables?
Question
Let X denote the number of brand X VCRs sold during a particular week by a certain store. The pmf of X is ![Let X denote the number of brand X VCRs sold during a particular week by a certain store. The pmf of X is Seventy percent of all customers who purchase brand X VCRs also buy an extended warranty. Let Y denote the number of purchasers during this week who buy an extended warranty. a. What is P(X = 4, Y = 2)? [Hint: This probability equals P(Y = 2/X = 4) P(X = 4); now think of the four purchases as four trials of a binomial experiment, with success on a trial corresponding to buying an extended warranty.] b. Calculate P(X =Y). c. Determine the joint pmf of X and Y and then the marginal pmf of Y.<div style=padding-top: 35px>](https://d2lvgg3v3hfg70.cloudfront.net/TB3498/11eb0e05_3e2c_54ef_9431_75cb8f3cb31b_TB3498_00.jpg) Seventy percent of all customers who purchase brand X VCRs also buy an extended warranty. Let Y denote the number of purchasers during this week who buy an extended warranty.
Seventy percent of all customers who purchase brand X VCRs also buy an extended warranty. Let Y denote the number of purchasers during this week who buy an extended warranty.
a. What is P(X = 4, Y = 2)? [Hint: This probability equals P(Y = 2/X = 4)![Let X denote the number of brand X VCRs sold during a particular week by a certain store. The pmf of X is Seventy percent of all customers who purchase brand X VCRs also buy an extended warranty. Let Y denote the number of purchasers during this week who buy an extended warranty. a. What is P(X = 4, Y = 2)? [Hint: This probability equals P(Y = 2/X = 4) P(X = 4); now think of the four purchases as four trials of a binomial experiment, with success on a trial corresponding to buying an extended warranty.] b. Calculate P(X =Y). c. Determine the joint pmf of X and Y and then the marginal pmf of Y.<div style=padding-top: 35px>](https://d2lvgg3v3hfg70.cloudfront.net/TB3498/11eb0e05_3e2c_54f0_9431_7976942a2a44_TB3498_11.jpg)
P(X = 4); now think of the four purchases as four trials of a binomial experiment, with success on a trial corresponding to buying an extended warranty.]
b. Calculate P(X =Y).
c. Determine the joint pmf of X and Y and then the marginal pmf of Y.
Seventy percent of all customers who purchase brand X VCRs also buy an extended warranty. Let Y denote the number of purchasers during this week who buy an extended warranty. a. What is P(X = 4, Y = 2)? [Hint: This probability equals P(Y = 2/X = 4)
P(X = 4); now think of the four purchases as four trials of a binomial experiment, with success on a trial corresponding to buying an extended warranty.]
b. Calculate P(X =Y).
c. Determine the joint pmf of X and Y and then the marginal pmf of Y.
Question
An instructor has given a short test consisting of two parts. For a randomly selected student, let X = the number of points earned on the first part and Y = the number of points earned on the second part. Suppose that the joint pmf of X and Y is given in the accompanying table. 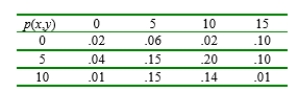
a. If the score recorded in the grade book is the total number of points earned on the two parts, what is the expected recorded score E(X + Y)?
b. If the maximum of the two scores is recorded, what is the expected recorded score?
a. If the score recorded in the grade book is the total number of points earned on the two parts, what is the expected recorded score E(X + Y)?
b. If the maximum of the two scores is recorded, what is the expected recorded score?
Question
In an area having sandy soil, 50 small trees of a certain type were planted, and another 50 trees were planted in an area having clay soil. Let X = the number of trees planted in sandy soil that survive 1 year and Y = the number of trees planted in clay soil that survive 1 year. If the probability that a tree planted in sandy soil will survive 1 year is .7 and the probability of 1-year survival in clay soil is .6, compute an approximation to  (do not bother with the continuity correction).
(do not bother with the continuity correction). Question
Let  represent the times necessary to perform three successive repair tasks at a certain service facility. Suppose they are independent normal random variables with expected values
  respectively.
a. If
Calculate
What is
b. Using the
given in part (a), calculate
c. Using the
given in part (a), calculate
d. If
calculate
represent the times necessary to perform three successive repair tasks at a certain service facility. Suppose they are independent normal random variables with expected values respectively. a. If
Calculate
What is
b. Using the
given in part (a), calculate
c. Using the
given in part (a), calculate
d. If
calculate
Question
Question
Show that if X and Y are independent random variables, then 
Question
Two components of a minicomputer have the following joint pdf for their useful lifetimes X and Y: 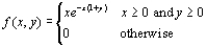
a. What is the probability that the lifetime X of the first component exceeds 3?
b. What are the marginal pdf"s of X and Y? Are the two lifetimes independent? Explain.
c. What is the probability that the lifetime of at least one component exceeds 3?
a. What is the probability that the lifetime X of the first component exceeds 3?
b. What are the marginal pdf"s of X and Y? Are the two lifetimes independent? Explain.
c. What is the probability that the lifetime of at least one component exceeds 3?
Question
A company maintains three offices in a certain region, each staffed by two employees. Information concerning yearly salaries (1000's of dollars) is as follows: 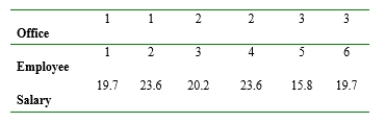
a. Suppose two of these employees are randomly selected from among the six (without replacement). Determine the sampling distribution of the sample mean salary
b. Suppose one of the three offices is randomly selected. Let
denote the salaries of the two employees. Determine the sampling distribution of
c. How does
from parts (a) and (b) compare to the population mean salary
Question
Suppose your waiting time for a bus in the morning is uniformly distributed on [0,5], whereas waiting time in the evening is uniformly distributed on [0,10] independent of morning waiting time.
a. If you take the bus each morning and evening for a week, what is your total expected waiting time? [Hint: Define random variables![Suppose your waiting time for a bus in the morning is uniformly distributed on [0,5], whereas waiting time in the evening is uniformly distributed on [0,10] independent of morning waiting time. a. If you take the bus each morning and evening for a week, what is your total expected waiting time? [Hint: Define random variables and use a rule of expected value.) b. What is the variance of your total waiting time? c. What are the expected value and variance of the difference between morning and evening waiting times on a given day? d. What are the expected value and variance of the difference between morning waiting time and total evening waiting time for a particular week?<div style=padding-top: 35px>](https://d2lvgg3v3hfg70.cloudfront.net/TB3498/11eb0e05_3e32_bd05_9431_457cc537f3ad_TB3498_11.jpg)
and use a rule of expected value.)
b. What is the variance of your total waiting time?
c. What are the expected value and variance of the difference between morning and evening waiting times on a given day?
d. What are the expected value and variance of the difference between morning waiting time and total evening waiting time for a particular week?
a. If you take the bus each morning and evening for a week, what is your total expected waiting time? [Hint: Define random variables
and use a rule of expected value.)
b. What is the variance of your total waiting time?
c. What are the expected value and variance of the difference between morning and evening waiting times on a given day?
d. What are the expected value and variance of the difference between morning waiting time and total evening waiting time for a particular week?
Question
A particular brand of dishwasher soap is sold in three sizes: 25oz, 40oz, and 65 oz. Twenty percent of all purchasers select a 25 oz box, fifty percent select a 40 oz box, and the remaining thirty percent choose a 65 oz box. Let  denote the package sizes selected by two independently selected purchasers.
a. Determine the sampling distribution of
, calculate
, and compare to
b. Determine the sampling distribution of the sample variance
denote the package sizes selected by two independently selected purchasers. a. Determine the sampling distribution of
, calculate
, and compare to
b. Determine the sampling distribution of the sample variance
Question
The number of parking tickets issued in Grand Rapids on any given weekday has a Poisson distribution with parameter  What is the approximate probability that
a. Between 40 and 70 tickets are given out on a particular day? (Hint: When
is large, a Poisson random variable has approximately a normal distribution.)
b. The total number of tickets given out during a 5-day week is between 215 and 265?
What is the approximate probability that a. Between 40 and 70 tickets are given out on a particular day? (Hint: When
is large, a Poisson random variable has approximately a normal distribution.)
b. The total number of tickets given out during a 5-day week is between 215 and 265?
Question
Question
The joint pdf of pressures for right (X) and left (Y) front tires is given by 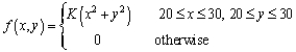 .
.
a. Determine the conditional pdf of Y given that X = x and the conditional pdf of X given that Y = y if you are given
b. If the pressure in the right tire is found to be 22 psi, what is the probability that the left tire has a pressure of at least 25 psi? Compare this to
c. If the pressure in the right tire is found to be 22 psi, what is the expected pressure in the left tire, and what is the standard deviation of pressure in this tire?
. a. Determine the conditional pdf of Y given that X = x and the conditional pdf of X given that Y = y if you are given
b. If the pressure in the right tire is found to be 22 psi, what is the probability that the left tire has a pressure of at least 25 psi? Compare this to
c. If the pressure in the right tire is found to be 22 psi, what is the expected pressure in the left tire, and what is the standard deviation of pressure in this tire?
Question
Let X be the number of packages being mailed by a randomly selected customer at a certain shipping facility. Suppose the distribution of X is as follows: ![Let X be the number of packages being mailed by a randomly selected customer at a certain shipping facility. Suppose the distribution of X is as follows: a. Consider a random sample of size n = 2 (two customers), and let be the sample mean number of packages shipped. Obtain the probability distribution of . b. Refer to part (a) and calculate c. Again consider a random sample of size n = 2, but now focus on the statistic R = the sample range (difference between the largest and smallest values in the sample). Obtain the distribution of R. [Hint: Calculate the value of R for each outcome and use the probabilities from part (a).] d. If a random sample of size n = 4 is selected, what is ? (Hint: You should not have to list all possible outcomes, only those for which <div style=padding-top: 35px>](https://d2lvgg3v3hfg70.cloudfront.net/TB3498/11eb0e05_3e2f_6268_9431_dbbb0a4ab2f9_TB3498_00.jpg)
a. Consider a random sample of size n = 2 (two customers), and let![Let X be the number of packages being mailed by a randomly selected customer at a certain shipping facility. Suppose the distribution of X is as follows: a. Consider a random sample of size n = 2 (two customers), and let be the sample mean number of packages shipped. Obtain the probability distribution of . b. Refer to part (a) and calculate c. Again consider a random sample of size n = 2, but now focus on the statistic R = the sample range (difference between the largest and smallest values in the sample). Obtain the distribution of R. [Hint: Calculate the value of R for each outcome and use the probabilities from part (a).] d. If a random sample of size n = 4 is selected, what is ? (Hint: You should not have to list all possible outcomes, only those for which <div style=padding-top: 35px>](https://d2lvgg3v3hfg70.cloudfront.net/TB3498/11eb0e05_3e2f_8979_9431_79e0e9c744ac_TB3498_11.jpg)
be the sample mean number of packages shipped. Obtain the probability distribution of![Let X be the number of packages being mailed by a randomly selected customer at a certain shipping facility. Suppose the distribution of X is as follows: a. Consider a random sample of size n = 2 (two customers), and let be the sample mean number of packages shipped. Obtain the probability distribution of . b. Refer to part (a) and calculate c. Again consider a random sample of size n = 2, but now focus on the statistic R = the sample range (difference between the largest and smallest values in the sample). Obtain the distribution of R. [Hint: Calculate the value of R for each outcome and use the probabilities from part (a).] d. If a random sample of size n = 4 is selected, what is ? (Hint: You should not have to list all possible outcomes, only those for which <div style=padding-top: 35px>](https://d2lvgg3v3hfg70.cloudfront.net/TB3498/11eb0e05_3e2f_897a_9431_357de420f8fa_TB3498_11.jpg)
.
b. Refer to part (a) and calculate![Let X be the number of packages being mailed by a randomly selected customer at a certain shipping facility. Suppose the distribution of X is as follows: a. Consider a random sample of size n = 2 (two customers), and let be the sample mean number of packages shipped. Obtain the probability distribution of . b. Refer to part (a) and calculate c. Again consider a random sample of size n = 2, but now focus on the statistic R = the sample range (difference between the largest and smallest values in the sample). Obtain the distribution of R. [Hint: Calculate the value of R for each outcome and use the probabilities from part (a).] d. If a random sample of size n = 4 is selected, what is ? (Hint: You should not have to list all possible outcomes, only those for which <div style=padding-top: 35px>](https://d2lvgg3v3hfg70.cloudfront.net/TB3498/11eb0e05_3e2f_897b_9431_77069bf976e4_TB3498_11.jpg)
c. Again consider a random sample of size n = 2, but now focus on the statistic R = the sample range (difference between the largest and smallest values in the sample). Obtain the distribution of R. [Hint: Calculate the value of R for each outcome and use the probabilities from part (a).]
d. If a random sample of size n = 4 is selected, what is![Let X be the number of packages being mailed by a randomly selected customer at a certain shipping facility. Suppose the distribution of X is as follows: a. Consider a random sample of size n = 2 (two customers), and let be the sample mean number of packages shipped. Obtain the probability distribution of . b. Refer to part (a) and calculate c. Again consider a random sample of size n = 2, but now focus on the statistic R = the sample range (difference between the largest and smallest values in the sample). Obtain the distribution of R. [Hint: Calculate the value of R for each outcome and use the probabilities from part (a).] d. If a random sample of size n = 4 is selected, what is ? (Hint: You should not have to list all possible outcomes, only those for which <div style=padding-top: 35px>](https://d2lvgg3v3hfg70.cloudfront.net/TB3498/11eb0e05_3e2f_b08c_9431_49002d1a93fc_TB3498_11.jpg)
? (Hint: You should not have to list all possible outcomes, only those for which![Let X be the number of packages being mailed by a randomly selected customer at a certain shipping facility. Suppose the distribution of X is as follows: a. Consider a random sample of size n = 2 (two customers), and let be the sample mean number of packages shipped. Obtain the probability distribution of . b. Refer to part (a) and calculate c. Again consider a random sample of size n = 2, but now focus on the statistic R = the sample range (difference between the largest and smallest values in the sample). Obtain the distribution of R. [Hint: Calculate the value of R for each outcome and use the probabilities from part (a).] d. If a random sample of size n = 4 is selected, what is ? (Hint: You should not have to list all possible outcomes, only those for which <div style=padding-top: 35px>](https://d2lvgg3v3hfg70.cloudfront.net/TB3498/11eb0e05_3e2f_b08d_9431_ed54d4af93f4_TB3498_11.jpg)
a. Consider a random sample of size n = 2 (two customers), and let
be the sample mean number of packages shipped. Obtain the probability distribution of
.
b. Refer to part (a) and calculate
c. Again consider a random sample of size n = 2, but now focus on the statistic R = the sample range (difference between the largest and smallest values in the sample). Obtain the distribution of R. [Hint: Calculate the value of R for each outcome and use the probabilities from part (a).]
d. If a random sample of size n = 4 is selected, what is
? (Hint: You should not have to list all possible outcomes, only those for which
Question
Three different roads feed into a particular freeway entrance. Suppose that during a fixed time period, the number of cars coming from each road onto the freeway is a random variable, with expected value and standard deviation as given in the table. 
a. What is the expected total number of cars entering the freeway at this point during the period? (Hint: Let
b. What is the variance of the total number of entering cars? Have you made any assumptions about the relationship between the numbers of cars on the different roads?
c. With
denoting the number of cars entering from road I during the period, suppose that
(so that the three streams of traffic are not independent). Compute the expected total number of entering cars and the standard deviation of the total.

Unlock Deck
Sign up to unlock the cards in this deck!
Unlock Deck
Unlock Deck
1/19
Play
Full screen (f)
Deck 5: Joint Probability Distributions and Random Samples
1
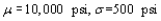
The breaking strength of a rivet has a mean value of 10,000 psi and a standard deviation of 500 psi.
a. What is the probability that the sample mean breaking strength for a random sample of 40 rivets is between 9950 and 10,250?
b. If the sample size had been 15 rather than 40, could the probability requested in part (a) be calculated from the given information?
a. What is the probability that the sample mean breaking strength for a random sample of 40 rivets is between 9950 and 10,250?
b. If the sample size had been 15 rather than 40, could the probability requested in part (a) be calculated from the given information?
 a. n = 40
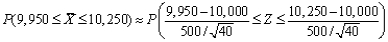
 =.9992 - .2643 =.7349
b. According to the Rule of Thumb given in your text, n should be greater than 30 in order to
apply the C.L.T., thus using the same procedure for n = 15 as was used for n = 40 would not appropriate.
2
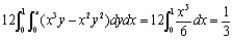
Abby and Bianca have agreed to meet for lunch between noon and 1:00 P.M. Denote Abby's arrival time by X, Bianca's by Y, and suppose X and Y are independent with pdf's. What is the expected amount of time that the one who arrives first must wait for the other person? [Hint: h(X, Y ) = |X - Y|.]
What is the expected amount of time that the one who arrives first must wait for the other person? [Hint: h(X, Y ) = |X - Y|.] =
= 
3
Show that if Under what conditions will
Under what conditions will  therefore
Corr

4
Each front tire on a particular type of vehicle is supposed to be filled to a pressure of 26 psi. Suppose the actual air pressure in each tire is a random variable-X for the right tire and Y for the left tire, with joint pdf
a. What is the value of K?
b. What is the probability that both tires are underfilled?
c. What is the probability that the difference in air pressure between the two tires is at most 2 psi?
d. Determine the (marginal) distribution of air pressure in the right tire alone.
e. Are X and Y independent random variables?
Unlock Deck
Unlock for access to all 19 flashcards in this deck.
Unlock Deck
k this deck
5
Let X denote the number of brand X VCRs sold during a particular week by a certain store. The pmf of X is Seventy percent of all customers who purchase brand X VCRs also buy an extended warranty. Let Y denote the number of purchasers during this week who buy an extended warranty.
a. What is P(X = 4, Y = 2)? [Hint: This probability equals P(Y = 2/X = 4)
P(X = 4); now think of the four purchases as four trials of a binomial experiment, with success on a trial corresponding to buying an extended warranty.]
b. Calculate P(X =Y).
c. Determine the joint pmf of X and Y and then the marginal pmf of Y.
Seventy percent of all customers who purchase brand X VCRs also buy an extended warranty. Let Y denote the number of purchasers during this week who buy an extended warranty. a. What is P(X = 4, Y = 2)? [Hint: This probability equals P(Y = 2/X = 4)
P(X = 4); now think of the four purchases as four trials of a binomial experiment, with success on a trial corresponding to buying an extended warranty.]
b. Calculate P(X =Y).
c. Determine the joint pmf of X and Y and then the marginal pmf of Y.
Unlock Deck
Unlock for access to all 19 flashcards in this deck.
Unlock Deck
k this deck
6
An instructor has given a short test consisting of two parts. For a randomly selected student, let X = the number of points earned on the first part and Y = the number of points earned on the second part. Suppose that the joint pmf of X and Y is given in the accompanying table.
a. If the score recorded in the grade book is the total number of points earned on the two parts, what is the expected recorded score E(X + Y)?
b. If the maximum of the two scores is recorded, what is the expected recorded score?
a. If the score recorded in the grade book is the total number of points earned on the two parts, what is the expected recorded score E(X + Y)?
b. If the maximum of the two scores is recorded, what is the expected recorded score?
Unlock Deck
Unlock for access to all 19 flashcards in this deck.
Unlock Deck
k this deck
7
In an area having sandy soil, 50 small trees of a certain type were planted, and another 50 trees were planted in an area having clay soil. Let X = the number of trees planted in sandy soil that survive 1 year and Y = the number of trees planted in clay soil that survive 1 year. If the probability that a tree planted in sandy soil will survive 1 year is .7 and the probability of 1-year survival in clay soil is .6, compute an approximation to (do not bother with the continuity correction).
(do not bother with the continuity correction). Unlock Deck
Unlock for access to all 19 flashcards in this deck.
Unlock Deck
k this deck
8
Let represent the times necessary to perform three successive repair tasks at a certain service facility. Suppose they are independent normal random variables with expected values respectively.
a. If
Calculate
What is
b. Using the
given in part (a), calculate
c. Using the
given in part (a), calculate
d. If
calculate
represent the times necessary to perform three successive repair tasks at a certain service facility. Suppose they are independent normal random variables with expected values respectively. a. If
Calculate
What is
b. Using the
given in part (a), calculate
c. Using the
given in part (a), calculate
d. If
calculate
Unlock Deck
Unlock for access to all 19 flashcards in this deck.
Unlock Deck
k this deck
9
The lifetime of a certain type of battery is normally distributed with mean value 12 hours and standard deviation 1 hour. There are four batteries in a package. What lifetime value is such that the total lifetime of all batteries in a package exceeds that value for only 5% of all packages?
Unlock Deck
Unlock for access to all 19 flashcards in this deck.
Unlock Deck
k this deck
10
Show that if X and Y are independent random variables, then
Unlock Deck
Unlock for access to all 19 flashcards in this deck.
Unlock Deck
k this deck
11
Two components of a minicomputer have the following joint pdf for their useful lifetimes X and Y:
a. What is the probability that the lifetime X of the first component exceeds 3?
b. What are the marginal pdf"s of X and Y? Are the two lifetimes independent? Explain.
c. What is the probability that the lifetime of at least one component exceeds 3?
a. What is the probability that the lifetime X of the first component exceeds 3?
b. What are the marginal pdf"s of X and Y? Are the two lifetimes independent? Explain.
c. What is the probability that the lifetime of at least one component exceeds 3?
Unlock Deck
Unlock for access to all 19 flashcards in this deck.
Unlock Deck
k this deck
12
A company maintains three offices in a certain region, each staffed by two employees. Information concerning yearly salaries (1000's of dollars) is as follows:
a. Suppose two of these employees are randomly selected from among the six (without replacement). Determine the sampling distribution of the sample mean salary
b. Suppose one of the three offices is randomly selected. Let
denote the salaries of the two employees. Determine the sampling distribution of
c. How does
from parts (a) and (b) compare to the population mean salary
Unlock Deck
Unlock for access to all 19 flashcards in this deck.
Unlock Deck
k this deck
13
Suppose your waiting time for a bus in the morning is uniformly distributed on [0,5], whereas waiting time in the evening is uniformly distributed on [0,10] independent of morning waiting time.
a. If you take the bus each morning and evening for a week, what is your total expected waiting time? [Hint: Define random variables
and use a rule of expected value.)
b. What is the variance of your total waiting time?
c. What are the expected value and variance of the difference between morning and evening waiting times on a given day?
d. What are the expected value and variance of the difference between morning waiting time and total evening waiting time for a particular week?
Unlock Deck
Unlock for access to all 19 flashcards in this deck.
Unlock Deck
k this deck
14
A particular brand of dishwasher soap is sold in three sizes: 25oz, 40oz, and 65 oz. Twenty percent of all purchasers select a 25 oz box, fifty percent select a 40 oz box, and the remaining thirty percent choose a 65 oz box. Let denote the package sizes selected by two independently selected purchasers.
a. Determine the sampling distribution of
, calculate
, and compare to
b. Determine the sampling distribution of the sample variance
denote the package sizes selected by two independently selected purchasers. a. Determine the sampling distribution of
, calculate
, and compare to
b. Determine the sampling distribution of the sample variance
Unlock Deck
Unlock for access to all 19 flashcards in this deck.
Unlock Deck
k this deck
15
The number of parking tickets issued in Grand Rapids on any given weekday has a Poisson distribution with parameter What is the approximate probability that
a. Between 40 and 70 tickets are given out on a particular day? (Hint: When
is large, a Poisson random variable has approximately a normal distribution.)
b. The total number of tickets given out during a 5-day week is between 215 and 265?
What is the approximate probability that a. Between 40 and 70 tickets are given out on a particular day? (Hint: When
is large, a Poisson random variable has approximately a normal distribution.)
b. The total number of tickets given out during a 5-day week is between 215 and 265?
Unlock Deck
Unlock for access to all 19 flashcards in this deck.
Unlock Deck
k this deck
16
It is known that 80% of all brand A zip drives work in a satisfactory manner throughout the warranty period (are "success"). Suppose that n = 10 drives are randomly selected. Let X = the number of successes in the sample. The statistic X/n is the sample proportion (fraction) of successes. Obtain the sampling distribution of this statistic. [Hint: One possible value of X/n is .3, corresponding to X = 3. What is the probability of this value (what kind of random variable is X)?]
Unlock Deck
Unlock for access to all 19 flashcards in this deck.
Unlock Deck
k this deck
17
The joint pdf of pressures for right (X) and left (Y) front tires is given by .
a. Determine the conditional pdf of Y given that X = x and the conditional pdf of X given that Y = y if you are given
b. If the pressure in the right tire is found to be 22 psi, what is the probability that the left tire has a pressure of at least 25 psi? Compare this to
c. If the pressure in the right tire is found to be 22 psi, what is the expected pressure in the left tire, and what is the standard deviation of pressure in this tire?
. a. Determine the conditional pdf of Y given that X = x and the conditional pdf of X given that Y = y if you are given
b. If the pressure in the right tire is found to be 22 psi, what is the probability that the left tire has a pressure of at least 25 psi? Compare this to
c. If the pressure in the right tire is found to be 22 psi, what is the expected pressure in the left tire, and what is the standard deviation of pressure in this tire?
Unlock Deck
Unlock for access to all 19 flashcards in this deck.
Unlock Deck
k this deck
18
Let X be the number of packages being mailed by a randomly selected customer at a certain shipping facility. Suppose the distribution of X is as follows:
a. Consider a random sample of size n = 2 (two customers), and let
be the sample mean number of packages shipped. Obtain the probability distribution of
.
b. Refer to part (a) and calculate
c. Again consider a random sample of size n = 2, but now focus on the statistic R = the sample range (difference between the largest and smallest values in the sample). Obtain the distribution of R. [Hint: Calculate the value of R for each outcome and use the probabilities from part (a).]
d. If a random sample of size n = 4 is selected, what is
? (Hint: You should not have to list all possible outcomes, only those for which
Unlock Deck
Unlock for access to all 19 flashcards in this deck.
Unlock Deck
k this deck
19
Three different roads feed into a particular freeway entrance. Suppose that during a fixed time period, the number of cars coming from each road onto the freeway is a random variable, with expected value and standard deviation as given in the table.
a. What is the expected total number of cars entering the freeway at this point during the period? (Hint: Let
b. What is the variance of the total number of entering cars? Have you made any assumptions about the relationship between the numbers of cars on the different roads?
c. With
denoting the number of cars entering from road I during the period, suppose that
(so that the three streams of traffic are not independent). Compute the expected total number of entering cars and the standard deviation of the total.
Unlock Deck
Unlock for access to all 19 flashcards in this deck.
Unlock Deck
k this deck
Unlock Deck
Unlock for access to all 19 flashcards in this deck.


