Deck 14: Goodness-Of-Fit Tests and Categorical Data Analysis
Full screen (f)
Question
Question
The chi-squared test for homogeneity can safely be applied as long as the estimated expected count  is at least __________ for all cells.
is at least __________ for all cells. Question
The critical value  for the chi-squared distribution is the value such that __________ of the area under the
  curve with
  degrees of freedom lies to the right of
for the chi-squared distribution is the value such that __________ of the area under the curve with degrees of freedom lies to the right of Question
The chi-squared distribution has a single parameter  , called the number __________ of the distribution.
, called the number __________ of the distribution. Question
Question
One may wish to test 
 is not true. The null hypothesis is__________ hypothesis because knowing that
  is true does not uniquely determine the cell probabilities and expected cell counts but only their general form.
is not true. The null hypothesis is__________ hypothesis because knowing that is true does not uniquely determine the cell probabilities and expected cell counts but only their general form. Question
The  goodness-of-fit test statistics, when there are 6 categories and 2 parameters to be estimated, has approximately a chi-squared distribution with __________ degrees of freedom.
goodness-of-fit test statistics, when there are 6 categories and 2 parameters to be estimated, has approximately a chi-squared distribution with __________ degrees of freedom. Question
Question
Question
If Z is a standard normal random variable; that is  , then
  has a __________ distribution with degrees of freedom
  = __________.
, then has a __________ distribution with degrees of freedom = __________. Question
One may wish to test  is not true. The null hypothesis is __________ hypothesis in the sense that each
  is a specified number, so that the expected cell counts when
  is true are uniquely determined numbers.
is not true. The null hypothesis is __________ hypothesis in the sense that each is a specified number, so that the expected cell counts when is true are uniquely determined numbers. Question
If the computed value of the chi-squared test statistic is  =2.83, and the test has 2 degrees of freedom, then the null hypothesis
  is __________ at .05 level of significance.
=2.83, and the test has 2 degrees of freedom, then the null hypothesis is __________ at .05 level of significance. Question
Question
Provided that  for every i (i =1, 2, 3, 4, 5), the
  goodness-of-fit test statistic when category probabilities are completely specified has approximately a chi-squared distribution with __________ degrees of freedom.
for every i (i =1, 2, 3, 4, 5), the goodness-of-fit test statistic when category probabilities are completely specified has approximately a chi-squared distribution with __________ degrees of freedom. Question
Question
Question
Question
Question
Question
Question
What conclusion would be appropriate for an upper-tailed chi-squared test in each of the following situations?
a.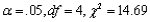
b.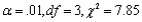
c.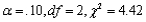
d.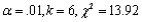
a.
b.
c.
d.
Question
Question
Question
A study reports on research into the effect of different injection treatments on the frequencies of audiogenic seizures. 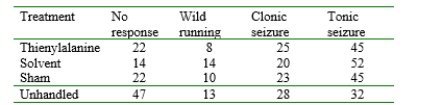 Does the data suggest that the true percentages in the different response categories depend on the nature of the injection treatment? State and test the appropriate hypotheses using
Does the data suggest that the true percentages in the different response categories depend on the nature of the injection treatment? State and test the appropriate hypotheses using Question
Question
A certain type of flashlight is sold with the four batteries included. A random sample of 150 flashlights is obtained, and the number of defective batteries in each is determined, resulting in the following data? ![A certain type of flashlight is sold with the four batteries included. A random sample of 150 flashlights is obtained, and the number of defective batteries in each is determined, resulting in the following data? Let X be the number of defective batteries in a randomly selected flashlight. Test the null hypothesis that the distribution of X is Bin That is, with test i=0,1,2,3,4 [Hint: To obtain the MLE of write the likelihood (the function to be maximized) as where the exponents are linear functions of the cell counts. Then take the natural log, differentiate with respect to equate the result to 0, and solve for ]<div style=padding-top: 35px>](https://d2lvgg3v3hfg70.cloudfront.net/TB3498/11eb0e05_3e6f_2a29_9431_afefa5bb1a38_TB3498_00.jpg) Let X be the number of defective batteries in a randomly selected flashlight. Test the null hypothesis that the distribution of X is Bin
Let X be the number of defective batteries in a randomly selected flashlight. Test the null hypothesis that the distribution of X is Bin ![A certain type of flashlight is sold with the four batteries included. A random sample of 150 flashlights is obtained, and the number of defective batteries in each is determined, resulting in the following data? Let X be the number of defective batteries in a randomly selected flashlight. Test the null hypothesis that the distribution of X is Bin That is, with test i=0,1,2,3,4 [Hint: To obtain the MLE of write the likelihood (the function to be maximized) as where the exponents are linear functions of the cell counts. Then take the natural log, differentiate with respect to equate the result to 0, and solve for ]<div style=padding-top: 35px>](https://d2lvgg3v3hfg70.cloudfront.net/TB3498/11eb0e05_3e6f_513a_9431_4bbcc9038743_TB3498_11.jpg) That is, with
That is, with ![A certain type of flashlight is sold with the four batteries included. A random sample of 150 flashlights is obtained, and the number of defective batteries in each is determined, resulting in the following data? Let X be the number of defective batteries in a randomly selected flashlight. Test the null hypothesis that the distribution of X is Bin That is, with test i=0,1,2,3,4 [Hint: To obtain the MLE of write the likelihood (the function to be maximized) as where the exponents are linear functions of the cell counts. Then take the natural log, differentiate with respect to equate the result to 0, and solve for ]<div style=padding-top: 35px>](https://d2lvgg3v3hfg70.cloudfront.net/TB3498/11eb0e05_3e6f_513b_9431_098a99ae2874_TB3498_11.jpg) test
test ![A certain type of flashlight is sold with the four batteries included. A random sample of 150 flashlights is obtained, and the number of defective batteries in each is determined, resulting in the following data? Let X be the number of defective batteries in a randomly selected flashlight. Test the null hypothesis that the distribution of X is Bin That is, with test i=0,1,2,3,4 [Hint: To obtain the MLE of write the likelihood (the function to be maximized) as where the exponents are linear functions of the cell counts. Then take the natural log, differentiate with respect to equate the result to 0, and solve for ]<div style=padding-top: 35px>](https://d2lvgg3v3hfg70.cloudfront.net/TB3498/11eb0e05_3e6f_513c_9431_218858d3cabc_TB3498_11.jpg) i=0,1,2,3,4
i=0,1,2,3,4
[Hint: To obtain the MLE of![A certain type of flashlight is sold with the four batteries included. A random sample of 150 flashlights is obtained, and the number of defective batteries in each is determined, resulting in the following data? Let X be the number of defective batteries in a randomly selected flashlight. Test the null hypothesis that the distribution of X is Bin That is, with test i=0,1,2,3,4 [Hint: To obtain the MLE of write the likelihood (the function to be maximized) as where the exponents are linear functions of the cell counts. Then take the natural log, differentiate with respect to equate the result to 0, and solve for ]<div style=padding-top: 35px>](https://d2lvgg3v3hfg70.cloudfront.net/TB3498/11eb0e05_3e6f_784d_9431_2f53d6388e08_TB3498_11.jpg) write the likelihood (the function to be maximized) as
write the likelihood (the function to be maximized) as ![A certain type of flashlight is sold with the four batteries included. A random sample of 150 flashlights is obtained, and the number of defective batteries in each is determined, resulting in the following data? Let X be the number of defective batteries in a randomly selected flashlight. Test the null hypothesis that the distribution of X is Bin That is, with test i=0,1,2,3,4 [Hint: To obtain the MLE of write the likelihood (the function to be maximized) as where the exponents are linear functions of the cell counts. Then take the natural log, differentiate with respect to equate the result to 0, and solve for ]<div style=padding-top: 35px>](https://d2lvgg3v3hfg70.cloudfront.net/TB3498/11eb0e05_3e6f_784e_9431_df4a1178d1a3_TB3498_11.jpg) where the exponents
where the exponents ![A certain type of flashlight is sold with the four batteries included. A random sample of 150 flashlights is obtained, and the number of defective batteries in each is determined, resulting in the following data? Let X be the number of defective batteries in a randomly selected flashlight. Test the null hypothesis that the distribution of X is Bin That is, with test i=0,1,2,3,4 [Hint: To obtain the MLE of write the likelihood (the function to be maximized) as where the exponents are linear functions of the cell counts. Then take the natural log, differentiate with respect to equate the result to 0, and solve for ]<div style=padding-top: 35px>](https://d2lvgg3v3hfg70.cloudfront.net/TB3498/11eb0e05_3e6f_784f_9431_7597f73e3568_TB3498_11.jpg) are linear functions of the cell counts. Then take the natural log, differentiate with respect to
are linear functions of the cell counts. Then take the natural log, differentiate with respect to ![A certain type of flashlight is sold with the four batteries included. A random sample of 150 flashlights is obtained, and the number of defective batteries in each is determined, resulting in the following data? Let X be the number of defective batteries in a randomly selected flashlight. Test the null hypothesis that the distribution of X is Bin That is, with test i=0,1,2,3,4 [Hint: To obtain the MLE of write the likelihood (the function to be maximized) as where the exponents are linear functions of the cell counts. Then take the natural log, differentiate with respect to equate the result to 0, and solve for ]<div style=padding-top: 35px>](https://d2lvgg3v3hfg70.cloudfront.net/TB3498/11eb0e05_3e6f_9f60_9431_5946a120cb84_TB3498_11.jpg) equate the result to 0, and solve for
equate the result to 0, and solve for ![A certain type of flashlight is sold with the four batteries included. A random sample of 150 flashlights is obtained, and the number of defective batteries in each is determined, resulting in the following data? Let X be the number of defective batteries in a randomly selected flashlight. Test the null hypothesis that the distribution of X is Bin That is, with test i=0,1,2,3,4 [Hint: To obtain the MLE of write the likelihood (the function to be maximized) as where the exponents are linear functions of the cell counts. Then take the natural log, differentiate with respect to equate the result to 0, and solve for ]<div style=padding-top: 35px>](https://d2lvgg3v3hfg70.cloudfront.net/TB3498/11eb0e05_3e6f_9f61_9431_3546f079e564_TB3498_11.jpg) ]
]
Let X be the number of defective batteries in a randomly selected flashlight. Test the null hypothesis that the distribution of X is Bin That is, with test i=0,1,2,3,4[Hint: To obtain the MLE of
write the likelihood (the function to be maximized) as where the exponents are linear functions of the cell counts. Then take the natural log, differentiate with respect to equate the result to 0, and solve for ] Question
A study reports data on the rate of oxygenation in streams at  C in certain region. The sample mean and standard deviation were computed as
 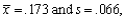 respectively. Based on the accompanying frequency distribution, can it be concluded that oxygenation rate is a normally distributed variable? Use the chi-squared test with
C in certain region. The sample mean and standard deviation were computed as respectively. Based on the accompanying frequency distribution, can it be concluded that oxygenation rate is a normally distributed variable? Use the chi-squared test with Question
Question
Question
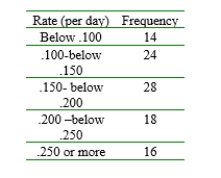
Criminologists have long debated whether there is a relationship between weather conditions and the incidence of violent crime. A study classified 1400 homicides according to season, resulting in the accompanying data. Test the null hypothesis of equal proportions using  by using the chi-squared table to say as much as possible about the P-value.
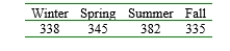
by using the chi-squared table to say as much as possible about the P-value. Question
Say as much as you can about the P-value for an upper-tailed chi-squared test in each of the following situations:
a.
b.
c.
d.
e.
a.
b.
c.
d.
e.
Question
A statistics department at a state university maintains a tutoring service for students in its introductory service courses. The service has been staffed with the expectation that 40% of its students would be from the business statistics course, 30% from engineering statistics, 20% from the statistics course for social science students, and the other 10% from the course for agriculture students. A random sample of n=120 students revealed 50, 40, 18, and 12 from the four courses. Does this data suggest that the percentages on which staffing was based are not correct? State and test the relevant hypotheses using 
Question
Question
The accompanying data refers to leaf marks found on white clover samples selected from both long-grass areas and short-grass areas. Use a  test at .01 level of significance to decide whether the true proportions of different marks are identical for the two types of regions.
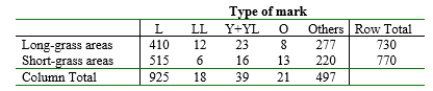
test at .01 level of significance to decide whether the true proportions of different marks are identical for the two types of regions. Question
Question
Question
Consider the accompanying 2  3 table displaying the sample proportions that fell in the various combinations of categories (e.g., 13% of those in the sample were in the first category of both factors).
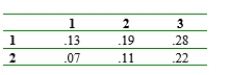
a. Suppose the sample consisted of n = 100 people. Use the chi-squared test for independence with significance level .10.
b. Repeat part (a) assuming that the sample size was n = 1000.
c. What is the smallest sample size n for which these observed proportions would result in rejection of the independence hypothesis?
3 table displaying the sample proportions that fell in the various combinations of categories (e.g., 13% of those in the sample were in the first category of both factors). a. Suppose the sample consisted of n = 100 people. Use the chi-squared test for independence with significance level .10.
b. Repeat part (a) assuming that the sample size was n = 1000.
c. What is the smallest sample size n for which these observed proportions would result in rejection of the independence hypothesis?
Question
A study reports the following data on 7-day flexural strength of nonbloated burned clay aggregate concrete samples (psi): 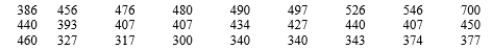 Test at level .10 to decide whether flexural strength is a normally distributed variable.
Test at level .10 to decide whether flexural strength is a normally distributed variable. Question
Question
Each individual in a random sample of high school and college students was cross-classified with respect to both political views and marijuana usage, resulting in the data displayed in the accompanying two-way table. Does the data support the hypothesis that political views and marijuana usage level are independent within the population? Test the appropriate hypotheses using level of significance .01. 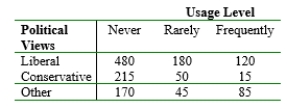

Unlock Deck
Sign up to unlock the cards in this deck!
Unlock Deck
Unlock Deck
1/40
Play
Full screen (f)
Deck 14: Goodness-Of-Fit Tests and Categorical Data Analysis
1
If , then has a
A) standard normal distribution.
B) binomial distribution.
C) multinomial distribution.
D) chi-squared distribution with one degree of freedom.
E) t distribution with two degrees of freedom.
A) standard normal distribution.
B) binomial distribution.
C) multinomial distribution.
D) chi-squared distribution with one degree of freedom.
E) t distribution with two degrees of freedom.
chi-squared distribution with one degree of freedom.
2
The chi-squared test for homogeneity can safely be applied as long as the estimated expected count is at least __________ for all cells.
is at least __________ for all cells.5
3
The critical value for the chi-squared distribution is the value such that __________ of the area under the curve with degrees of freedom lies to the right of
for the chi-squared distribution is the value such that __________ of the area under the curve with degrees of freedom lies to the right of .05
4
The chi-squared distribution has a single parameter , called the number __________ of the distribution.
, called the number __________ of the distribution. Unlock Deck
Unlock for access to all 40 flashcards in this deck.
Unlock Deck
k this deck
5
A two-way contingency table has r rows and c columns. Then, the number of degrees of freedom associated with the chi-squared test for independence is __________.
Unlock Deck
Unlock for access to all 40 flashcards in this deck.
Unlock Deck
k this deck
6
One may wish to test is not true. The null hypothesis is__________ hypothesis because knowing that is true does not uniquely determine the cell probabilities and expected cell counts but only their general form.
is not true. The null hypothesis is__________ hypothesis because knowing that is true does not uniquely determine the cell probabilities and expected cell counts but only their general form. Unlock Deck
Unlock for access to all 40 flashcards in this deck.
Unlock Deck
k this deck
7
The goodness-of-fit test statistics, when there are 6 categories and 2 parameters to be estimated, has approximately a chi-squared distribution with __________ degrees of freedom.
goodness-of-fit test statistics, when there are 6 categories and 2 parameters to be estimated, has approximately a chi-squared distribution with __________ degrees of freedom. Unlock Deck
Unlock for access to all 40 flashcards in this deck.
Unlock Deck
k this deck
8
The area to the right of 4.93 under the 2 degrees of freedom chi-squared curve is __________.
Unlock Deck
Unlock for access to all 40 flashcards in this deck.
Unlock Deck
k this deck
9
In a two-way contingency table, if the second row total is 125, the third column total is 60, and the total number of observations is 375, then the estimated expected count in cell (2, 3) is __________.
Unlock Deck
Unlock for access to all 40 flashcards in this deck.
Unlock Deck
k this deck
10
If Z is a standard normal random variable; that is , then has a __________ distribution with degrees of freedom = __________.
, then has a __________ distribution with degrees of freedom = __________. Unlock Deck
Unlock for access to all 40 flashcards in this deck.
Unlock Deck
k this deck
11
One may wish to test is not true. The null hypothesis is __________ hypothesis in the sense that each is a specified number, so that the expected cell counts when is true are uniquely determined numbers.
is not true. The null hypothesis is __________ hypothesis in the sense that each is a specified number, so that the expected cell counts when is true are uniquely determined numbers. Unlock Deck
Unlock for access to all 40 flashcards in this deck.
Unlock Deck
k this deck
12
If the computed value of the chi-squared test statistic is =2.83, and the test has 2 degrees of freedom, then the null hypothesis is __________ at .05 level of significance.
=2.83, and the test has 2 degrees of freedom, then the null hypothesis is __________ at .05 level of significance. Unlock Deck
Unlock for access to all 40 flashcards in this deck.
Unlock Deck
k this deck
13
It is true that the more the sample correlation coefficient r deviates from __________, the less the normal probability plot resembles a straight line.
Unlock Deck
Unlock for access to all 40 flashcards in this deck.
Unlock Deck
k this deck
14
Provided that for every i (i =1, 2, 3, 4, 5), the goodness-of-fit test statistic when category probabilities are completely specified has approximately a chi-squared distribution with __________ degrees of freedom.
for every i (i =1, 2, 3, 4, 5), the goodness-of-fit test statistic when category probabilities are completely specified has approximately a chi-squared distribution with __________ degrees of freedom. Unlock Deck
Unlock for access to all 40 flashcards in this deck.
Unlock Deck
k this deck
15
Which of the following statements are true regarding the critical value for the chi-squared distribution when
A) The area to the right of 9.488 is .05.
B) The area to the left of 9.488 is .95.
C) The total area under the chi-squared curve is 9.488.
D) All of the above statements are true.
E) None of the above statements are true.
A) The area to the right of 9.488 is .05.
B) The area to the left of 9.488 is .95.
C) The total area under the chi-squared curve is 9.488.
D) All of the above statements are true.
E) None of the above statements are true.
Unlock Deck
Unlock for access to all 40 flashcards in this deck.
Unlock Deck
k this deck
16
In testing versus the alternative that states that at least one does not equal rejection of is appropriate at .10 significance level when the test statistic value is
A) greater than or equal to 9.236.
B) smaller than or equal to 11.070
C) between 9.236 and 11.070
D) smaller than or equal to 7.779
E) greater than or equal to 7.779
A) greater than or equal to 9.236.
B) smaller than or equal to 11.070
C) between 9.236 and 11.070
D) smaller than or equal to 7.779
E) greater than or equal to 7.779
Unlock Deck
Unlock for access to all 40 flashcards in this deck.
Unlock Deck
k this deck
17
A __________ generalizes a binomial experiment by allowing each trial to result in one of k possible outcomes (categories), where k > 2.
Unlock Deck
Unlock for access to all 40 flashcards in this deck.
Unlock Deck
k this deck
18
A two-way contingency table has 3 rows and 5 columns. Then, the number of degrees of freedom associated with the chi-squared test for homogeneity is __________.
Unlock Deck
Unlock for access to all 40 flashcards in this deck.
Unlock Deck
k this deck
19
Which of the following statements are true?
A) The
Goodness-of-fit test can be used when the number of categories k is two or more.
B) If
, then
Has a t distribution with one degree of freedom.
C) The chi-squared tests in this chapter are not all upper-tailed.
D) The P-value for an upper-tailed chi-squared test is the area under the chi-squared curve with
Degrees of freedom to the left of the calculated
Test statistic value.
E) All of the above statements are true.
Unlock Deck
Unlock for access to all 40 flashcards in this deck.
Unlock Deck
k this deck
20
Which of the following statements are not true?
A) The chi-squared distribution is used to obtain a confidence interval for the variance
Of a normal population.
B) Provided that
For every i (i =1, 2,……, k), the
Goodness-of-fit test statistic when all k category probabilities are completely specified has approximately a t distribution with k-1 degrees of freedom.
C) A multinomial experiment generalizes a binomial experiment by allowing each trial to result in one of k possible outcomes, where k>2. In general, we refer to these outcomes as categories.
D) All of the above statements are correct.
E) None of the above statements are correct.
Unlock Deck
Unlock for access to all 40 flashcards in this deck.
Unlock Deck
k this deck
21
What conclusion would be appropriate for an upper-tailed chi-squared test in each of the following situations?
a.
b.
c.
d.
a.
b.
c.
d.
Unlock Deck
Unlock for access to all 40 flashcards in this deck.
Unlock Deck
k this deck
22
The number of degrees of freedom for a two-way contingency table with I rows and J columns is
A)
B)
C)
D)
E)
A)
B)
C)
D)
E)
Unlock Deck
Unlock for access to all 40 flashcards in this deck.
Unlock Deck
k this deck
23
In a two-way contingency table with 3 rows and 5 columns, assume that the second row total is 120 and the fourth column total is 50, and the total number of observations is 600. Then, the estimated expected count in cell (2, 4) is
A) 50
B) 40
C) 30
D) 20
E) 10
A) 50
B) 40
C) 30
D) 20
E) 10
Unlock Deck
Unlock for access to all 40 flashcards in this deck.
Unlock Deck
k this deck
24
A study reports on research into the effect of different injection treatments on the frequencies of audiogenic seizures. Does the data suggest that the true percentages in the different response categories depend on the nature of the injection treatment? State and test the appropriate hypotheses using
Does the data suggest that the true percentages in the different response categories depend on the nature of the injection treatment? State and test the appropriate hypotheses using Unlock Deck
Unlock for access to all 40 flashcards in this deck.
Unlock Deck
k this deck
25
The chi-squared test for homogeneity can safely be applied as long as each estimated expected county for all cells in the contingency table must be
A) at least 5
B) at most 10
C) at least 10
D) at most 15
E) any number between 10 and 15
A) at least 5
B) at most 10
C) at least 10
D) at most 15
E) any number between 10 and 15
Unlock Deck
Unlock for access to all 40 flashcards in this deck.
Unlock Deck
k this deck
26
A certain type of flashlight is sold with the four batteries included. A random sample of 150 flashlights is obtained, and the number of defective batteries in each is determined, resulting in the following data? Let X be the number of defective batteries in a randomly selected flashlight. Test the null hypothesis that the distribution of X is Bin That is, with test i=0,1,2,3,4
[Hint: To obtain the MLE of write the likelihood (the function to be maximized) as where the exponents are linear functions of the cell counts. Then take the natural log, differentiate with respect to equate the result to 0, and solve for ]
Let X be the number of defective batteries in a randomly selected flashlight. Test the null hypothesis that the distribution of X is Bin That is, with test i=0,1,2,3,4[Hint: To obtain the MLE of
write the likelihood (the function to be maximized) as where the exponents are linear functions of the cell counts. Then take the natural log, differentiate with respect to equate the result to 0, and solve for ] Unlock Deck
Unlock for access to all 40 flashcards in this deck.
Unlock Deck
k this deck
27
A study reports data on the rate of oxygenation in streams at C in certain region. The sample mean and standard deviation were computed as respectively. Based on the accompanying frequency distribution, can it be concluded that oxygenation rate is a normally distributed variable? Use the chi-squared test with
C in certain region. The sample mean and standard deviation were computed as respectively. Based on the accompanying frequency distribution, can it be concluded that oxygenation rate is a normally distributed variable? Use the chi-squared test with Unlock Deck
Unlock for access to all 40 flashcards in this deck.
Unlock Deck
k this deck
28
A study focuses on the existence of any relationship between date of patient admission for treatment of alcoholism and patient's birthday. Assuming a 365-day year more than 90 days from the birthday. A sample of 200 patients gave observed frequencies of 11, 24, 69, and 96 for categories 1, 2, 3, and 4, respectively. State and test the relevant hypotheses using a significance level of .01.
Unlock Deck
Unlock for access to all 40 flashcards in this deck.
Unlock Deck
k this deck
29
Let be the maximum likelihood estimators of the unknown parameters , and let denote the test statistic value based on these estimators. If the data are classified into k categories, then the critical value that specifies a level upper-tailed test satisfies
A)
B)
C)
D)
E)
A)
B)
C)
D)
E)
Unlock Deck
Unlock for access to all 40 flashcards in this deck.
Unlock Deck
k this deck
30
Criminologists have long debated whether there is a relationship between weather conditions and the incidence of violent crime. A study classified 1400 homicides according to season, resulting in the accompanying data. Test the null hypothesis of equal proportions using by using the chi-squared table to say as much as possible about the P-value.
by using the chi-squared table to say as much as possible about the P-value. Unlock Deck
Unlock for access to all 40 flashcards in this deck.
Unlock Deck
k this deck
31
Say as much as you can about the P-value for an upper-tailed chi-squared test in each of the following situations:
a.
b.
c.
d.
e.
a.
b.
c.
d.
e.
Unlock Deck
Unlock for access to all 40 flashcards in this deck.
Unlock Deck
k this deck
32
A statistics department at a state university maintains a tutoring service for students in its introductory service courses. The service has been staffed with the expectation that 40% of its students would be from the business statistics course, 30% from engineering statistics, 20% from the statistics course for social science students, and the other 10% from the course for agriculture students. A random sample of n=120 students revealed 50, 40, 18, and 12 from the four courses. Does this data suggest that the percentages on which staffing was based are not correct? State and test the relevant hypotheses using
Unlock Deck
Unlock for access to all 40 flashcards in this deck.
Unlock Deck
k this deck
33
The number of degrees of freedom in testing for independence when using a contingency table with 6 rows and 4 columns is:
A) 24
B) 10
C) 15
D) 20
E) 12
A) 24
B) 10
C) 15
D) 20
E) 12
Unlock Deck
Unlock for access to all 40 flashcards in this deck.
Unlock Deck
k this deck
34
The accompanying data refers to leaf marks found on white clover samples selected from both long-grass areas and short-grass areas. Use a test at .01 level of significance to decide whether the true proportions of different marks are identical for the two types of regions.
test at .01 level of significance to decide whether the true proportions of different marks are identical for the two types of regions. Unlock Deck
Unlock for access to all 40 flashcards in this deck.
Unlock Deck
k this deck
35
Which of the following statements are not true?
A) The chi-squared goodness-of-fit test can be used to test whether the sample comes from a specified family of continuous distributions, such as the normal family, but it cannot be used to test whether the sample comes from a specified discrete distribution, such as Poisson.
B) A normal probability plot is used for checking whether any member of the normal distribution family is plausible.
C) The sample correlation coefficient r is a quantitative measure of the extent to which points cluster about a straight line.
D) The null hypothesis of population normality is rejected if the sample correlation coefficient r is less than or equal to
Where
Is a critical value chosen to yield the desired significance level
)
E) All of the above statements are true.
Unlock Deck
Unlock for access to all 40 flashcards in this deck.
Unlock Deck
k this deck
36
Which of the following statements are not true?
A) The chi-squared test statistic used in testing for independence is identical to that used in testing for homogeneity.
B) In general, the number of degrees of freedom when testing for independence is larger than those used in testing for homogeneity.
C) The chi-squared test for independence can safely be applied as long as the estimated expected count
For all cells in the contingency table is larger than or equal to5.
D) The rejection region in testing for homogeneity at significance level
Is that the test statistic value
Where I and J are the number of rows and columns, respectively, in the two-way contingency table.
E) All of the above statements are true.
Unlock Deck
Unlock for access to all 40 flashcards in this deck.
Unlock Deck
k this deck
37
Consider the accompanying 2 3 table displaying the sample proportions that fell in the various combinations of categories (e.g., 13% of those in the sample were in the first category of both factors).
a. Suppose the sample consisted of n = 100 people. Use the chi-squared test for independence with significance level .10.
b. Repeat part (a) assuming that the sample size was n = 1000.
c. What is the smallest sample size n for which these observed proportions would result in rejection of the independence hypothesis?
3 table displaying the sample proportions that fell in the various combinations of categories (e.g., 13% of those in the sample were in the first category of both factors). a. Suppose the sample consisted of n = 100 people. Use the chi-squared test for independence with significance level .10.
b. Repeat part (a) assuming that the sample size was n = 1000.
c. What is the smallest sample size n for which these observed proportions would result in rejection of the independence hypothesis?
Unlock Deck
Unlock for access to all 40 flashcards in this deck.
Unlock Deck
k this deck
38
A study reports the following data on 7-day flexural strength of nonbloated burned clay aggregate concrete samples (psi): Test at level .10 to decide whether flexural strength is a normally distributed variable.
Test at level .10 to decide whether flexural strength is a normally distributed variable. Unlock Deck
Unlock for access to all 40 flashcards in this deck.
Unlock Deck
k this deck
39
The goodness-of-fit test statistic, when there are k categories and m parameters to be estimated from the sample data, has approximately a chi-squared distribution with degrees of freedom, where equals
A) m-k-1
B) k-m
C) k-m-1
D) m+k-1
E) k-m+1
A) m-k-1
B) k-m
C) k-m-1
D) m+k-1
E) k-m+1
Unlock Deck
Unlock for access to all 40 flashcards in this deck.
Unlock Deck
k this deck
40
Each individual in a random sample of high school and college students was cross-classified with respect to both political views and marijuana usage, resulting in the data displayed in the accompanying two-way table. Does the data support the hypothesis that political views and marijuana usage level are independent within the population? Test the appropriate hypotheses using level of significance .01.
Unlock Deck
Unlock for access to all 40 flashcards in this deck.
Unlock Deck
k this deck
Unlock Deck
Unlock for access to all 40 flashcards in this deck.


