Deck 8: Producers in the Long Run
Full screen (f)
Question
Question
Question
Question
Question
The following table shows the marginal products of capital (K) and labour (L) for various methods for Firm ABC to produce 1000 toys per day. 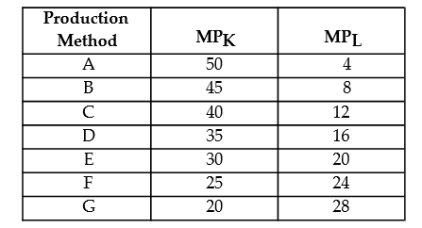 TABLE 8-2
Refer to Table 8-2. Suppose the firm is employing production method G. How should this firm adjust its use of capital and labour in order to minimize costs?
A) employ more capital and less labour
B) employ more capital and labour
C) employ less capital and more labour
D) employ less capital and labour
E) There is insufficient information to know.
TABLE 8-2Refer to Table 8-2. Suppose the firm is employing production method G. How should this firm adjust its use of capital and labour in order to minimize costs?
A) employ more capital and less labour
B) employ more capital and labour
C) employ less capital and more labour
D) employ less capital and labour
E) There is insufficient information to know.
Question
Question
The figure below shows the isocost lines facing a firm producing golf tees. 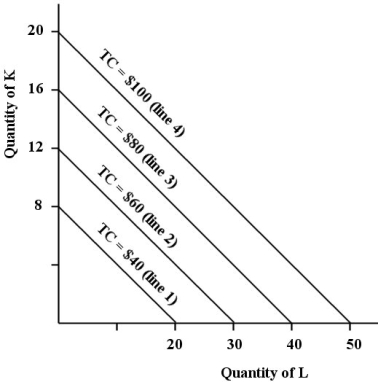 FIGURE 8-5
Refer to Figure 8-5.
A) -- not determinable from the information provided.
B) 4 only.
C) 1 only.
D) 2 only.
E) 3 only.
FIGURE 8-5Refer to Figure 8-5.
A) -- not determinable from the information provided.
B) 4 only.
C) 1 only.
D) 2 only.
E) 3 only.
Question
The table below shows the number of units of labour and capital used in 4 alternative production techniques for producing 1000 widgets
per month.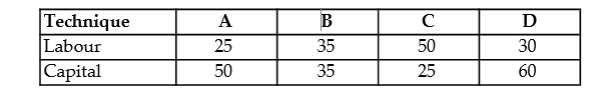 TABLE 8-1
Refer to Table 8-1. If the price of both labour and capital is $10, which production techniqueminimizes the costs of producing 1000 units of output?
A) A
B) B
C) C
D) D
E) Any of the techniques have the same cost.
per month.
TABLE 8-1Refer to Table 8-1. If the price of both labour and capital is $10, which production techniqueminimizes the costs of producing 1000 units of output?
A) A
B) B
C) C
D) D
E) Any of the techniques have the same cost.
Question
Question
Question
Question
Question
Question
Question
The figure below shows a family of cost curves for a firm. The subscripts 1, 2, and 3 for the SRATC curves refer to different plant sizes.  FIGURE 8-3
Refer to Figure 8-3. Should this firm ever consider moving from point E (output level Q₃ onSRATC2) to point F (output level Q5 on SRATC3)?
A) Yes, because the firm can take advantage of economies of scale.
B) Yes, if the product price rises enough to lead the firm to expand to plant size 3.
C) No, because they are already producing at their lowest possible cost at point E.
D) No, because producing at point F implies a higher cost per unit of output.
E) Yes, because SRATC3 is the optimal plant size for this firm.
FIGURE 8-3Refer to Figure 8-3. Should this firm ever consider moving from point E (output level Q₃ onSRATC2) to point F (output level Q5 on SRATC3)?
A) Yes, because the firm can take advantage of economies of scale.
B) Yes, if the product price rises enough to lead the firm to expand to plant size 3.
C) No, because they are already producing at their lowest possible cost at point E.
D) No, because producing at point F implies a higher cost per unit of output.
E) Yes, because SRATC3 is the optimal plant size for this firm.
Question
The table below shows the number of units of labour and capital used in 4 alternative production techniques for producing 1000 widgets
per month. TABLE 8-1
Which of the following is unlikely to be a source of increasing productivity?
A) better raw materials even if there are no changes in factor quantities or proportions
B) increases in technological know-how
C) better organization of production
D) substitution toward labour and away from capital (with constant technology)
E) better-trained labour
per month.
TABLE 8-1Which of the following is unlikely to be a source of increasing productivity?
A) better raw materials even if there are no changes in factor quantities or proportions
B) increases in technological know-how
C) better organization of production
D) substitution toward labour and away from capital (with constant technology)
E) better-trained labour
Question
The figure below shows a family of cost curves for a firm. The subscripts 1, 2, and 3 for the SRATC curves refer to different plant sizes. FIGURE 8-3
Suppose that capital costs $50 per unit and labour costs $20 per unit. If the marginal product of capital is 100 and the marginal product of labour is 30, a cost-minimizing firm should
A) employ more capital and less labour.
B) employ less of both capital and labour.
C) employ more of both capital and labour.
D) not change its current factor use.
E) employ less capital and more labour.
FIGURE 8-3Suppose that capital costs $50 per unit and labour costs $20 per unit. If the marginal product of capital is 100 and the marginal product of labour is 30, a cost-minimizing firm should
A) employ more capital and less labour.
B) employ less of both capital and labour.
C) employ more of both capital and labour.
D) not change its current factor use.
E) employ less capital and more labour.
Question
The figure below shows a family of cost curves for a firm. The subscripts 1, 2, and 3 for the SRATC curves refer to different plant sizes. FIGURE 8-3
"The bigger the volume, the lower the cost, and we pass these savings on to you" is a familiar advertising slogan. It implies essentially that the
A) firm expects to experience increasing returns over the relevant level of output.
B) average fixed cost will decline or remain constant over the long run.
C) firm is altruistic.
D) total cost of the firm will remain constant as output expands.
E) consumer is able to pay less today because the total cost of the firm is expected to decline tomorrow.
FIGURE 8-3"The bigger the volume, the lower the cost, and we pass these savings on to you" is a familiar advertising slogan. It implies essentially that the
A) firm expects to experience increasing returns over the relevant level of output.
B) average fixed cost will decline or remain constant over the long run.
C) firm is altruistic.
D) total cost of the firm will remain constant as output expands.
E) consumer is able to pay less today because the total cost of the firm is expected to decline tomorrow.
Question
The figure below shows a family of cost curves for a firm. The subscripts 1, 2, and 3 for the SRATC curves refer to different plant sizes. FIGURE 8-3
The slope of a firm's isocost line is equal to the ratio of
A) the factor prices.
B) the marginal rate of substitution between factors.
C) product prices.
D) the marginal products of its factors.
E) total variable cost to total cost.
FIGURE 8-3The slope of a firm's isocost line is equal to the ratio of
A) the factor prices.
B) the marginal rate of substitution between factors.
C) product prices.
D) the marginal products of its factors.
E) total variable cost to total cost.
Question
Question
Question
Question
Question
Question
Question
Question
The figure below shows the isocost lines facing a firm producing golf tees.  FIGURE 8-5
Refer to Figure 8-5. Given the information provided about the isocost lines, we know that the per unit price of capital is _ and the per unit price of labour is _ .
A) $20; $50
B) not determinable; not determinable
C) $5; $2
D) $50; $20
E) $2; $5
FIGURE 8-5Refer to Figure 8-5. Given the information provided about the isocost lines, we know that the per unit price of capital is _ and the per unit price of labour is _ .
A) $20; $50
B) not determinable; not determinable
C) $5; $2
D) $50; $20
E) $2; $5
Question
The following table shows the marginal products of capital (K) and labour (L) for various methods for Firm ABC to produce 1000 toys per day. 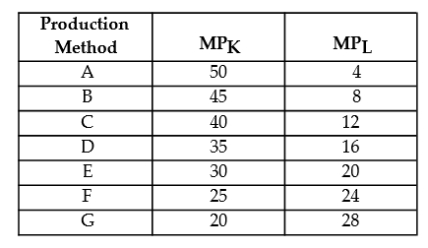 TABLE 8-2
Refer to Table 8-2. As this firm switches from production method A to production method G, production is
A) remaining at a cost-minimizing level of output.
B) becoming more labour intensive and less capital intensive.
C) becoming more profitable.
D) becoming more capital intensive and less labour intensive.
E) moving farther and farther away from cost minimization.
TABLE 8-2Refer to Table 8-2. As this firm switches from production method A to production method G, production is
A) remaining at a cost-minimizing level of output.
B) becoming more labour intensive and less capital intensive.
C) becoming more profitable.
D) becoming more capital intensive and less labour intensive.
E) moving farther and farther away from cost minimization.
Question
The following table shows the marginal products of capital (K) and labour (L) for various methods for Firm ABC to produce 1000 toys per day. 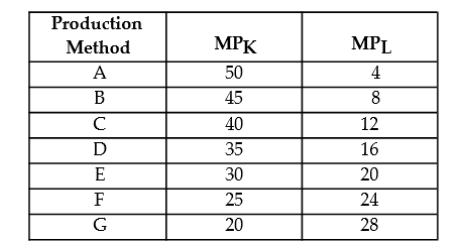 TABLE 8-2
Refer to Table 8-2. If capital costs $6 per unit and labour costs $4 per unit, which production method minimizes the cost of producing 1000 toys per day?
A) method B
B) method C
C) method D
D) method E
E) method F
TABLE 8-2Refer to Table 8-2. If capital costs $6 per unit and labour costs $4 per unit, which production method minimizes the cost of producing 1000 toys per day?
A) method B
B) method C
C) method D
D) method E
E) method F
Question
Question
Question
Question
The table below shows the number of units of labour and capital used in 4 alternative production techniques for producing 1000 widgets per month. 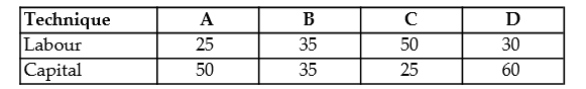 TABLE 8-1
Refer to Table 8-1. If the price of labour is $10 and the price of capital is $5, which production technique minimizes the costs of producing 1000 units of output?
A) A
B) B
C) C
D) D
E) Any of the techniques have the same cost.
TABLE 8-1Refer to Table 8-1. If the price of labour is $10 and the price of capital is $5, which production technique minimizes the costs of producing 1000 units of output?
A) A
B) B
C) C
D) D
E) Any of the techniques have the same cost.
Question
Question
Question
Question
The following table shows the marginal products of capital (K) and labour (L) for various methods for Firm ABC to produce 1000 toys per day. TABLE 8-2
Refer to Figure 8-2. Increasing returns to scale occur over the output range
A) Q₂ to Q₃ only.
B) beyond Q₃ only.
C) 0 to Q₁ only.
D) Q₁ to Q₂ only.
E) 0 to Q₃ only.
TABLE 8-2Refer to Figure 8-2. Increasing returns to scale occur over the output range
A) Q₂ to Q₃ only.
B) beyond Q₃ only.
C) 0 to Q₁ only.
D) Q₁ to Q₂ only.
E) 0 to Q₃ only.
Question
Question
Question
Question
Question
Question
The figure below shows the isocost lines and the isoquant map for a firm producing golf tees.  FIGURE 8-6
Refer to Figure 8-6.
A) the firm has adjusted the factor prices to equate the ratio of marginal products of the factors.
B) the ratio of the marginal utilities of capital and labour is equal to the ratio of the prices of capital and labour.
C) the ratio of the marginal products of capital and labour is equal to the ratio of the prices of capital and labour.
D) the firm can adjust its employment of factors to reduce its total cost, with output unchanged.
E) the firm is at its cost-minimizing position for an output level of 4000 golf tees.
FIGURE 8-6Refer to Figure 8-6.
A) the firm has adjusted the factor prices to equate the ratio of marginal products of the factors.
B) the ratio of the marginal utilities of capital and labour is equal to the ratio of the prices of capital and labour.
C) the ratio of the marginal products of capital and labour is equal to the ratio of the prices of capital and labour.
D) the firm can adjust its employment of factors to reduce its total cost, with output unchanged.
E) the firm is at its cost-minimizing position for an output level of 4000 golf tees.
Question
The figure below shows a family of cost curves for a firm. The subscripts 1, 2, and 3 for the SRATC curves refer to different plant sizes.  FIGURE 8-3
Refer to Figure 8-3. If this firm is producing at point B, then
A) this firm is producing a level of output that is technically inefficient in the long run.
B) this firm could produce the same level of output at a lower cost with plant size 2.
C) it should employ more of its variable factors of production.
D) this firm is experiencing decreasing returns to scale.
E) plant size 1 is optimal.
FIGURE 8-3Refer to Figure 8-3. If this firm is producing at point B, then
A) this firm is producing a level of output that is technically inefficient in the long run.
B) this firm could produce the same level of output at a lower cost with plant size 2.
C) it should employ more of its variable factors of production.
D) this firm is experiencing decreasing returns to scale.
E) plant size 1 is optimal.
Question
Question
Question
The figure below shows a family of cost curves for a firm. The subscripts 1, 2, and 3 for the SRATC curves refer to different plant sizes. 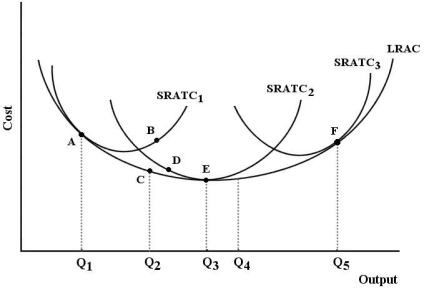 FIGURE 8-3
Refer to Figure 8-3. The minimum efficient scale is achieved by this firm at output level
A) Q₃.
B) Q₄.
C) Q₂.
D) Q₁.
E) Q5.
FIGURE 8-3Refer to Figure 8-3. The minimum efficient scale is achieved by this firm at output level
A) Q₃.
B) Q₄.
C) Q₂.
D) Q₁.
E) Q5.
Question
Question
Question
Question
Question
Question
The figure below shows a family of cost curves for a firm. The subscripts 1, 2, and 3 for the SRATC curves refer to different plant sizes. FIGURE 8-3
Refer to Figure 8-4. The firm is initially minimizing the cost of producing 1000 units of output.Suppose the factor prices then change such that the price of capital (K) falls and the price of labour(L) rises. If the firm decides to leave its output unchanged, it will now move toward the point
A) A.
B) B.
C) C.
D) D.
E) unknown as there is insufficient information to know
FIGURE 8-3Refer to Figure 8-4. The firm is initially minimizing the cost of producing 1000 units of output.Suppose the factor prices then change such that the price of capital (K) falls and the price of labour(L) rises. If the firm decides to leave its output unchanged, it will now move toward the point
A) A.
B) B.
C) C.
D) D.
E) unknown as there is insufficient information to know
Question
Question
Question
Question
The figure below shows the isocost lines facing a firm producing golf tees.  FIGURE 8-5
Refer to Figure 8-5. is equal to
A) -not determinable from the information provided.
B) 2.
C) 2/5.
D) 5.
E) 5/2.
FIGURE 8-5Refer to Figure 8-5. is equal to
A) -not determinable from the information provided.
B) 2.
C) 2/5.
D) 5.
E) 5/2.
Question
Question
Question
Question
Question
Question
The following table shows the marginal products of capital (K) and labour (L) for various methods for Firm ABC to produce 1000 toys per day. 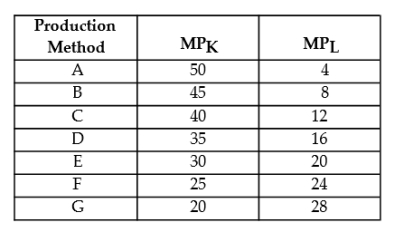 TABLE 8-2
Refer to Table 8-2. Suppose capital costs $80 per unit and labour costs $24 per unit. Which production method minimizes the cost of producing 1000 toys per day.
A) method B
B) method C
C) method D
D) method E
E) method F
TABLE 8-2Refer to Table 8-2. Suppose capital costs $80 per unit and labour costs $24 per unit. Which production method minimizes the cost of producing 1000 toys per day.
A) method B
B) method C
C) method D
D) method E
E) method F
Question
The figure below shows a family of cost curves for a firm. The subscripts 1, 2, and 3 for the SRATC curves refer to different plant sizes.  FIGURE 8-3
Refer to Figure 8-3. The difference between the SRATC curves and the LRAC curve is that
A) the LRAC is an envelope curve, joining the minimum points on all SRATC curves.
B) for the SRATC curves, one or more of the factors of production is fixed, whereas for the LRAC curve, all factors of production are variable.
C) the SRATC curves show the lowest attainable cost of production at each level of output when all factors are variable in the short run, whereas the LRAC curve shows the same in the long run.
D) the SRATC curves show diseconomies of scales, whereas the LRAC curve shows economies of scale.
E) the SRATC curves show the optimal plant size when all factors of production are variable, whereas the LRAC shows the lowest cost attainable associated with each LRAC curve.
FIGURE 8-3Refer to Figure 8-3. The difference between the SRATC curves and the LRAC curve is that
A) the LRAC is an envelope curve, joining the minimum points on all SRATC curves.
B) for the SRATC curves, one or more of the factors of production is fixed, whereas for the LRAC curve, all factors of production are variable.
C) the SRATC curves show the lowest attainable cost of production at each level of output when all factors are variable in the short run, whereas the LRAC curve shows the same in the long run.
D) the SRATC curves show diseconomies of scales, whereas the LRAC curve shows economies of scale.
E) the SRATC curves show the optimal plant size when all factors of production are variable, whereas the LRAC shows the lowest cost attainable associated with each LRAC curve.
Question
Question
Question
Question
Question
The figure below shows the isocost lines and the isoquant map for a firm producing golf tees.  FIGURE 8-6
Refer to Figure 8-6.
A) 6 units of capital and 15 units of labour.
B) 12 units of capital and 30 units of labour.
C) 10 units of capital and 25 units of labour.
D) 4 units of capital and 10 units of labour.
E) 8 units of capital and 20 units of labour.
FIGURE 8-6Refer to Figure 8-6.
A) 6 units of capital and 15 units of labour.
B) 12 units of capital and 30 units of labour.
C) 10 units of capital and 25 units of labour.
D) 4 units of capital and 10 units of labour.
E) 8 units of capital and 20 units of labour.
Question
Question
Question
The figure below shows a family of cost curves for a firm. The subscripts 1, 2, and 3 for the SRATC curves refer to different plant sizes.  FIGURE 8-3
Refer to Figure 8-3. Each of the three SRATC curves shows
A) the output that is possible when all factors of production are fixed.
B) the lowest cost attainable, given that the plant size is the largest it can possibly be.
C) the lowest cost attainable, holding the plant size constant.
D) optimal plant sizes in the long run.
E) technically inefficient methods of production, given that they lie above the LRAC.
FIGURE 8-3Refer to Figure 8-3. Each of the three SRATC curves shows
A) the output that is possible when all factors of production are fixed.
B) the lowest cost attainable, given that the plant size is the largest it can possibly be.
C) the lowest cost attainable, holding the plant size constant.
D) optimal plant sizes in the long run.
E) technically inefficient methods of production, given that they lie above the LRAC.
Question
Question
Question
Question
The figure below shows the isocost lines and the isoquant map for a firm producing golf tees. 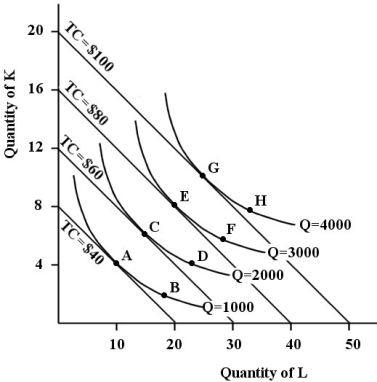 FIGURE 8-6
Refer to Figure 8-6. As this firm is increasing its production of golf tees, it is experiencingreturns to scale.
A) not determinable from the information provided
B) constant
C) decreasing
D) diminishing
E) increasing
FIGURE 8-6Refer to Figure 8-6. As this firm is increasing its production of golf tees, it is experiencingreturns to scale.
A) not determinable from the information provided
B) constant
C) decreasing
D) diminishing
E) increasing
Question
Question
Question
The figure below shows the isocost lines and the isoquant map for a firm producing golf tees. FIGURE 8-6
Refer to Figure 8-6. Suppose this firm is producing 3000 golf tees and is at point F on the isoquant map. Which of the following is true?
A) MPL/MPK is greater than 5/2.
B) MPK/MPL is equal to 5/2.
C) MPK/MPL is equal to PK/PL.
D) MPK/MPL is equal to 2/5.
E) MPK/MPL is greater than 5/2.
FIGURE 8-6Refer to Figure 8-6. Suppose this firm is producing 3000 golf tees and is at point F on the isoquant map. Which of the following is true?
A) MPL/MPK is greater than 5/2.
B) MPK/MPL is equal to 5/2.
C) MPK/MPL is equal to PK/PL.
D) MPK/MPL is equal to 2/5.
E) MPK/MPL is greater than 5/2.
Question

Unlock Deck
Sign up to unlock the cards in this deck!
Unlock Deck
Unlock Deck
1/107
Play
Full screen (f)
Deck 8: Producers in the Long Run
1
For a firm with only two inputs, capital and labour, the condition MPK/MPL = PK/PL guarantees that the firm is
A) minimizing its costs but is not necessarily maximizing its profits.
B) technically efficient but not economically efficient.
C) economically efficient but not technically efficient.
D) at its profit-maximizing output but is not necessarily minimizing its costs.
E) at its profit-maximizing and cost-minimizing level of output.
A
2
A profit-maximizing firm will increase its use of capital and decrease its use of labour when the
A) average product of capital is higher than the average product of labour.
B) total product of capital is higher than the total product of labour.
C) marginal product of capital, per dollar spent on capital, is less than the marginal product of labour, per dollar spent on labour.
D) marginal product of capital, per dollar spent on capital, is greater than the marginal product of labour, per dollar spent on labour.
E) marginal product of capital is higher than the marginal product of labour.
D
3
Isoquants are usually drawn convex when viewed from the origin,assumption
A) that both factors are subject to the law of diminishing returns.
B) that the variable factor is subject to the law of diminishing returns.
C) that both factors are subject to increasing returns.
D) negative marginal productivity of all factors.
E) the positive marginal productivity of all factors.
A
4
Assume a firm is using 6 units of capital and 6 units of labour to produce 6 baskets. Now it doublesboth inputs resulting in a new total of 16 baskets being produced. This firm is experiencing
A) constant returns to scale.
B) increasing costs.
C) diseconomies of scale.
D) increasing returns to scale.
E) decreasing returns to scale.
A) constant returns to scale.
B) increasing costs.
C) diseconomies of scale.
D) increasing returns to scale.
E) decreasing returns to scale.
Unlock Deck
Unlock for access to all 107 flashcards in this deck.
Unlock Deck
k this deck
5
The following table shows the marginal products of capital (K) and labour (L) for various methods for Firm ABC to produce 1000 toys per day. TABLE 8-2
Refer to Table 8-2. Suppose the firm is employing production method G. How should this firm adjust its use of capital and labour in order to minimize costs?
A) employ more capital and less labour
B) employ more capital and labour
C) employ less capital and more labour
D) employ less capital and labour
E) There is insufficient information to know.
TABLE 8-2Refer to Table 8-2. Suppose the firm is employing production method G. How should this firm adjust its use of capital and labour in order to minimize costs?
A) employ more capital and less labour
B) employ more capital and labour
C) employ less capital and more labour
D) employ less capital and labour
E) There is insufficient information to know.
Unlock Deck
Unlock for access to all 107 flashcards in this deck.
Unlock Deck
k this deck
6
Assume a firm is using 10 units of labour and 10 units of capital and is producing 10 units of output per hour. Now both inputs are doubled, resulting in output rising to 18 units per hour. The firm is experiencing
A) decreasing costs.
B) decreasing returns to scale.
C) increasing returns to scale.
D) economies of scale.
E) constant returns to scale.
A) decreasing costs.
B) decreasing returns to scale.
C) increasing returns to scale.
D) economies of scale.
E) constant returns to scale.
Unlock Deck
Unlock for access to all 107 flashcards in this deck.
Unlock Deck
k this deck
7
The figure below shows the isocost lines facing a firm producing golf tees. FIGURE 8-5
Refer to Figure 8-5.
A) -- not determinable from the information provided.
B) 4 only.
C) 1 only.
D) 2 only.
E) 3 only.
FIGURE 8-5Refer to Figure 8-5.
A) -- not determinable from the information provided.
B) 4 only.
C) 1 only.
D) 2 only.
E) 3 only.
Unlock Deck
Unlock for access to all 107 flashcards in this deck.
Unlock Deck
k this deck
8
The table below shows the number of units of labour and capital used in 4 alternative production techniques for producing 1000 widgets
per month. TABLE 8-1
Refer to Table 8-1. If the price of both labour and capital is $10, which production techniqueminimizes the costs of producing 1000 units of output?
A) A
B) B
C) C
D) D
E) Any of the techniques have the same cost.
per month.
TABLE 8-1Refer to Table 8-1. If the price of both labour and capital is $10, which production techniqueminimizes the costs of producing 1000 units of output?
A) A
B) B
C) C
D) D
E) Any of the techniques have the same cost.
Unlock Deck
Unlock for access to all 107 flashcards in this deck.
Unlock Deck
k this deck
9
Suppose a firm employs two inputs, X and Y, and that at their current levels of use MPX/PX >MPY/PY. To minimize the cost of production, the firm should hire
A) more input Y only if its price falls.
B) more input Y and less input X.
C) more input X only if its price decreases.
D) more input X only if its price increases.
E) more input X and less input Y.
A) more input Y only if its price falls.
B) more input Y and less input X.
C) more input X only if its price decreases.
D) more input X only if its price increases.
E) more input X and less input Y.
Unlock Deck
Unlock for access to all 107 flashcards in this deck.
Unlock Deck
k this deck
10
A change in the technique for producing an existing product is known as
A) process innovation.
B) an increase in productivity.
C) invention.
D) investment.
E) product innovation.
A) process innovation.
B) an increase in productivity.
C) invention.
D) investment.
E) product innovation.
Unlock Deck
Unlock for access to all 107 flashcards in this deck.
Unlock Deck
k this deck
11
Increasing returns to scale for a firm is shown graphically by
A) a horizontal long-run average cost curve.
B) a downward-sloping long-run average cost curve.
C) an upward-sloping long-run average cost curve.
D) a vertical long-run average cost curve.
E) none of the above; returns to scale have nothing to do with the shape of the long-run average cost curve.
A) a horizontal long-run average cost curve.
B) a downward-sloping long-run average cost curve.
C) an upward-sloping long-run average cost curve.
D) a vertical long-run average cost curve.
E) none of the above; returns to scale have nothing to do with the shape of the long-run average cost curve.
Unlock Deck
Unlock for access to all 107 flashcards in this deck.
Unlock Deck
k this deck
12
Canada has a much lower population density than does Japan. Therefore, the price of land (relative to the price of labour) is lower in Canada than in Japan. Consider a Canadian firm and a Japanese firm, both producing rice, both having access to the same technologies, and both striving to minimize costs. Now suppose that the relative price of land rises in Canada but remains the samein Japan. The effect will be to
A) decrease the land/labour ratio for the Canadian firm.
B) increase the land/labour ratio for both the Canadian and the Japanese firms.
C) increase the land/labour ratio for the Canadian firm.
D) not change the land/labour ratio for either firm.
E) decrease the land/labour ratio for both the Canadian and the Japanese firms.
Unlock Deck
Unlock for access to all 107 flashcards in this deck.
Unlock Deck
k this deck
13
In the long run, the law of diminishing marginal returns
A) is not relevant because there are no fixed factors of production.
B) does not hold because technology is a variable.
C) does hold, regardless of production process.
D) sometimes holds, depending on the production process.
E) is exactly the same as in the short run.
A) is not relevant because there are no fixed factors of production.
B) does not hold because technology is a variable.
C) does hold, regardless of production process.
D) sometimes holds, depending on the production process.
E) is exactly the same as in the short run.
Unlock Deck
Unlock for access to all 107 flashcards in this deck.
Unlock Deck
k this deck
14
If a firm is using labour and capital such that the MP of labour is two times the MP of capital, andthe price of labour is four times the price of capital, the firm should in order to minimizeits costs of producing its output.
A) decrease both capital and labour
B) decrease capital and increase labour
C) not alter its present factor mix
D) increase both labour and capital
E) increase capital and decrease labour
A) decrease both capital and labour
B) decrease capital and increase labour
C) not alter its present factor mix
D) increase both labour and capital
E) increase capital and decrease labour
Unlock Deck
Unlock for access to all 107 flashcards in this deck.
Unlock Deck
k this deck
15
The figure below shows a family of cost curves for a firm. The subscripts 1, 2, and 3 for the SRATC curves refer to different plant sizes. FIGURE 8-3
Refer to Figure 8-3. Should this firm ever consider moving from point E (output level Q₃ onSRATC2) to point F (output level Q5 on SRATC3)?
A) Yes, because the firm can take advantage of economies of scale.
B) Yes, if the product price rises enough to lead the firm to expand to plant size 3.
C) No, because they are already producing at their lowest possible cost at point E.
D) No, because producing at point F implies a higher cost per unit of output.
E) Yes, because SRATC3 is the optimal plant size for this firm.
FIGURE 8-3Refer to Figure 8-3. Should this firm ever consider moving from point E (output level Q₃ onSRATC2) to point F (output level Q5 on SRATC3)?
A) Yes, because the firm can take advantage of economies of scale.
B) Yes, if the product price rises enough to lead the firm to expand to plant size 3.
C) No, because they are already producing at their lowest possible cost at point E.
D) No, because producing at point F implies a higher cost per unit of output.
E) Yes, because SRATC3 is the optimal plant size for this firm.
Unlock Deck
Unlock for access to all 107 flashcards in this deck.
Unlock Deck
k this deck
16
The table below shows the number of units of labour and capital used in 4 alternative production techniques for producing 1000 widgets
per month. TABLE 8-1
Which of the following is unlikely to be a source of increasing productivity?
A) better raw materials even if there are no changes in factor quantities or proportions
B) increases in technological know-how
C) better organization of production
D) substitution toward labour and away from capital (with constant technology)
E) better-trained labour
per month.
TABLE 8-1Which of the following is unlikely to be a source of increasing productivity?
A) better raw materials even if there are no changes in factor quantities or proportions
B) increases in technological know-how
C) better organization of production
D) substitution toward labour and away from capital (with constant technology)
E) better-trained labour
Unlock Deck
Unlock for access to all 107 flashcards in this deck.
Unlock Deck
k this deck
17
The figure below shows a family of cost curves for a firm. The subscripts 1, 2, and 3 for the SRATC curves refer to different plant sizes. FIGURE 8-3
Suppose that capital costs $50 per unit and labour costs $20 per unit. If the marginal product of capital is 100 and the marginal product of labour is 30, a cost-minimizing firm should
A) employ more capital and less labour.
B) employ less of both capital and labour.
C) employ more of both capital and labour.
D) not change its current factor use.
E) employ less capital and more labour.
FIGURE 8-3Suppose that capital costs $50 per unit and labour costs $20 per unit. If the marginal product of capital is 100 and the marginal product of labour is 30, a cost-minimizing firm should
A) employ more capital and less labour.
B) employ less of both capital and labour.
C) employ more of both capital and labour.
D) not change its current factor use.
E) employ less capital and more labour.
Unlock Deck
Unlock for access to all 107 flashcards in this deck.
Unlock Deck
k this deck
18
The figure below shows a family of cost curves for a firm. The subscripts 1, 2, and 3 for the SRATC curves refer to different plant sizes. FIGURE 8-3
"The bigger the volume, the lower the cost, and we pass these savings on to you" is a familiar advertising slogan. It implies essentially that the
A) firm expects to experience increasing returns over the relevant level of output.
B) average fixed cost will decline or remain constant over the long run.
C) firm is altruistic.
D) total cost of the firm will remain constant as output expands.
E) consumer is able to pay less today because the total cost of the firm is expected to decline tomorrow.
FIGURE 8-3"The bigger the volume, the lower the cost, and we pass these savings on to you" is a familiar advertising slogan. It implies essentially that the
A) firm expects to experience increasing returns over the relevant level of output.
B) average fixed cost will decline or remain constant over the long run.
C) firm is altruistic.
D) total cost of the firm will remain constant as output expands.
E) consumer is able to pay less today because the total cost of the firm is expected to decline tomorrow.
Unlock Deck
Unlock for access to all 107 flashcards in this deck.
Unlock Deck
k this deck
19
The figure below shows a family of cost curves for a firm. The subscripts 1, 2, and 3 for the SRATC curves refer to different plant sizes. FIGURE 8-3
The slope of a firm's isocost line is equal to the ratio of
A) the factor prices.
B) the marginal rate of substitution between factors.
C) product prices.
D) the marginal products of its factors.
E) total variable cost to total cost.
FIGURE 8-3The slope of a firm's isocost line is equal to the ratio of
A) the factor prices.
B) the marginal rate of substitution between factors.
C) product prices.
D) the marginal products of its factors.
E) total variable cost to total cost.
Unlock Deck
Unlock for access to all 107 flashcards in this deck.
Unlock Deck
k this deck
20
Suppose that capital costs $8 per unit and labour costs $4 per unit. For a profit- maximizing firmoperating at its optimal factor mix, if the marginal product of capital is 60, the marginal product oflabour must be _ .
A) 30
B) 10
C) 120
D) 90
E) 20
A) 30
B) 10
C) 120
D) 90
E) 20
Unlock Deck
Unlock for access to all 107 flashcards in this deck.
Unlock Deck
k this deck
21
In the long run, a profit-maximizing firm produces any given level of output by choosing the production method that
A) equates the average cost per unit of all factors.
B) equates the marginal product of all factors.
C) produces that output at the lowest possible cost.
D) is associated with a flat total cost curve.
E) maximizes the marginal product of all factors.
A) equates the average cost per unit of all factors.
B) equates the marginal product of all factors.
C) produces that output at the lowest possible cost.
D) is associated with a flat total cost curve.
E) maximizes the marginal product of all factors.
Unlock Deck
Unlock for access to all 107 flashcards in this deck.
Unlock Deck
k this deck
22
Increasing returns to scale
A) means that output rises proportionately less than inputs, increasing per unit cost of production in the short run.
B) means that output rises proportionately more than inputs, resulting in increasing per unit costs.
C) implies that the long-run average cost curve is shifting downward.
D) has the same meaning as increasing costs of production.
E) means that output rises proportionately more than inputs, resulting in lower per unit costs in the long run.
Unlock Deck
Unlock for access to all 107 flashcards in this deck.
Unlock Deck
k this deck
23
Productivity is defined as
A) the cost of a unit of output.
B) a measure of input used.
C) the efficient use of technology.
D) output per combination of two or more inputs.
E) a measure of output per unit of resource input.
A) the cost of a unit of output.
B) a measure of input used.
C) the efficient use of technology.
D) output per combination of two or more inputs.
E) a measure of output per unit of resource input.
Unlock Deck
Unlock for access to all 107 flashcards in this deck.
Unlock Deck
k this deck
24
The point of tangency between the short-run average total cost (SRATC) curve and the long-run average cost (LRAC) curve occurs
A) at a point where average total cost is falling but the marginal cost is rising.
B) at the point of minimum SRATC.
C) at a point where both the average total cost and the marginal cost is rising.
D) only when the LRAC curve is at its minimum.
E) at an output level for which the quantity of the fixed factor is optimal.
Unlock Deck
Unlock for access to all 107 flashcards in this deck.
Unlock Deck
k this deck
25
Suppose that a firm is using 100 units of labour and 50 units of capital to produce 200 fax machines per day. The price of labour is $10 per unit and the price of capital is $5 per unit. The MPL equals 2 and the MPK equals 5. In this situation,
A) the firm should decrease the use of both inputs.
B) the firm should increase the use of both inputs.
C) the firm is minimizing its costs.
D) the firm could lower its production costs by increasing labour input and decreasing capital input.
E) the firm could lower its production costs by decreasing labour input and increasing capital input.
Unlock Deck
Unlock for access to all 107 flashcards in this deck.
Unlock Deck
k this deck
26
If factor prices decrease,
A) there will be a downward shift in the long-run average cost curve but not in the short-run average cost curve.
B) a firm will move down along both its long-run and short-run average cost curves.
C) both the long-run and short-run average cost curves will shift downward.
D) a firm will move down along its long-run average cost curve only.
E) there will be no change in the cost curves in the long run.
Unlock Deck
Unlock for access to all 107 flashcards in this deck.
Unlock Deck
k this deck
27
The figure below shows the isocost lines facing a firm producing golf tees. FIGURE 8-5
Refer to Figure 8-5. Given the information provided about the isocost lines, we know that the per unit price of capital is _ and the per unit price of labour is _ .
A) $20; $50
B) not determinable; not determinable
C) $5; $2
D) $50; $20
E) $2; $5
FIGURE 8-5Refer to Figure 8-5. Given the information provided about the isocost lines, we know that the per unit price of capital is _ and the per unit price of labour is _ .
A) $20; $50
B) not determinable; not determinable
C) $5; $2
D) $50; $20
E) $2; $5
Unlock Deck
Unlock for access to all 107 flashcards in this deck.
Unlock Deck
k this deck
28
The following table shows the marginal products of capital (K) and labour (L) for various methods for Firm ABC to produce 1000 toys per day. TABLE 8-2
Refer to Table 8-2. As this firm switches from production method A to production method G, production is
A) remaining at a cost-minimizing level of output.
B) becoming more labour intensive and less capital intensive.
C) becoming more profitable.
D) becoming more capital intensive and less labour intensive.
E) moving farther and farther away from cost minimization.
TABLE 8-2Refer to Table 8-2. As this firm switches from production method A to production method G, production is
A) remaining at a cost-minimizing level of output.
B) becoming more labour intensive and less capital intensive.
C) becoming more profitable.
D) becoming more capital intensive and less labour intensive.
E) moving farther and farther away from cost minimization.
Unlock Deck
Unlock for access to all 107 flashcards in this deck.
Unlock Deck
k this deck
29
The following table shows the marginal products of capital (K) and labour (L) for various methods for Firm ABC to produce 1000 toys per day. TABLE 8-2
Refer to Table 8-2. If capital costs $6 per unit and labour costs $4 per unit, which production method minimizes the cost of producing 1000 toys per day?
A) method B
B) method C
C) method D
D) method E
E) method F
TABLE 8-2Refer to Table 8-2. If capital costs $6 per unit and labour costs $4 per unit, which production method minimizes the cost of producing 1000 toys per day?
A) method B
B) method C
C) method D
D) method E
E) method F
Unlock Deck
Unlock for access to all 107 flashcards in this deck.
Unlock Deck
k this deck
30
A cost-minimizing firm will increase its use of labour and decrease its use of capital when the
A) marginal product of capital, per dollar spent on capital, is greater than the marginal product of labour, per dollar spent on labour.
B) average product of capital is higher than the average product of labour.
C) total product of capital is higher than the total product of labour.
D) marginal product of capital, per dollar spent on capital, is less than the marginal product of labour, per dollar spent on labour.
E) marginal product of capital is higher than the marginal product of labour.
Unlock Deck
Unlock for access to all 107 flashcards in this deck.
Unlock Deck
k this deck
31
Refer to Figure 8-1. For which of the four firms would the family of short-run average total cost curves lie below the LRAC?
A) Firm A
B) Firm B
C) Firm C
D) Firm D
E) none of the four firms.
A) Firm A
B) Firm B
C) Firm C
D) Firm D
E) none of the four firms.
Unlock Deck
Unlock for access to all 107 flashcards in this deck.
Unlock Deck
k this deck
32
A profit-maximizing firm with variable labour and capital will always produce
A) at a point on the LRAC curve where it is experiencing economies of scale.
B) at the minimum point of the LRAC curve.
C) at the tangency of the relevant SRATC curve and the LRAC curve.
D) anywhere along the LRAC curve.
E) at the minimum of the relevant SRATC curve and the LRAC curve.
A) at a point on the LRAC curve where it is experiencing economies of scale.
B) at the minimum point of the LRAC curve.
C) at the tangency of the relevant SRATC curve and the LRAC curve.
D) anywhere along the LRAC curve.
E) at the minimum of the relevant SRATC curve and the LRAC curve.
Unlock Deck
Unlock for access to all 107 flashcards in this deck.
Unlock Deck
k this deck
33
The table below shows the number of units of labour and capital used in 4 alternative production techniques for producing 1000 widgets per month. TABLE 8-1
Refer to Table 8-1. If the price of labour is $10 and the price of capital is $5, which production technique minimizes the costs of producing 1000 units of output?
A) A
B) B
C) C
D) D
E) Any of the techniques have the same cost.
TABLE 8-1Refer to Table 8-1. If the price of labour is $10 and the price of capital is $5, which production technique minimizes the costs of producing 1000 units of output?
A) A
B) B
C) C
D) D
E) Any of the techniques have the same cost.
Unlock Deck
Unlock for access to all 107 flashcards in this deck.
Unlock Deck
k this deck
34
The creation of a new product is called
A) investment.
B) a rise in productivity.
C) process innovation.
D) creative destruction
E) product innovation.
A) investment.
B) a rise in productivity.
C) process innovation.
D) creative destruction
E) product innovation.
Unlock Deck
Unlock for access to all 107 flashcards in this deck.
Unlock Deck
k this deck
35
A short-run average total cost curve will touch the long-run average cost curve at a level of outputonly
A) when the quantity of the fixed factor being employed is at the optimal level for that level of output.
B) where the short-run cost curve is downward sloping.
C) by coincidence.
D) where the short-run cost curve is downward-sloping and the quantity of the fixed factor is optimal.
E) where the short-run cost curve is upward sloping.
Unlock Deck
Unlock for access to all 107 flashcards in this deck.
Unlock Deck
k this deck
36
A firm's long-run average cost curve
A) shows the relationship between marginal cost and output given that the economically most efficient method of production is employed.
B) is an envelope of short-run average variable cost curves.
C) shows the minimum cost of producing each possible level of output with a fixed factor.
D) is the boundary between attainable and unattainable cost levels, with known production technologies and given factor prices.
E) is horizontal in most situations..
Unlock Deck
Unlock for access to all 107 flashcards in this deck.
Unlock Deck
k this deck
37
The following table shows the marginal products of capital (K) and labour (L) for various methods for Firm ABC to produce 1000 toys per day. TABLE 8-2
Refer to Figure 8-2. Increasing returns to scale occur over the output range
A) Q₂ to Q₃ only.
B) beyond Q₃ only.
C) 0 to Q₁ only.
D) Q₁ to Q₂ only.
E) 0 to Q₃ only.
TABLE 8-2Refer to Figure 8-2. Increasing returns to scale occur over the output range
A) Q₂ to Q₃ only.
B) beyond Q₃ only.
C) 0 to Q₁ only.
D) Q₁ to Q₂ only.
E) 0 to Q₃ only.
Unlock Deck
Unlock for access to all 107 flashcards in this deck.
Unlock Deck
k this deck
38
A short-run average total cost curve and a long-run average cost curve are tangent
A) where the short-run cost curve is downward sloping.
B) by coincidence.
C) where the short-run cost curve is upward sloping.
D) when the quantity of the fixed factor is at the optimal level for that level of output.
E) where the short-run cost curve is downward-sloping and the quantity of the fixed factor is optimal.
Unlock Deck
Unlock for access to all 107 flashcards in this deck.
Unlock Deck
k this deck
39
Suppose that a firm is using 100 units of labour and 50 units of capital to produce 200 fax machinesper day. The price of labour is $5 per unit and the price of capital is $2 per unit. The MPL equals 5 and the MPK equals 2. In this situation, the firm
A) is minimizing its costs.
B) could lower its production costs by increasing labour input and decreasing capital input.
C) should increase the use of both inputs.
D) should decrease the use of both inputs.
E) could lower its production costs by decreasing labour input and increasing capital input.
A) is minimizing its costs.
B) could lower its production costs by increasing labour input and decreasing capital input.
C) should increase the use of both inputs.
D) should decrease the use of both inputs.
E) could lower its production costs by decreasing labour input and increasing capital input.
Unlock Deck
Unlock for access to all 107 flashcards in this deck.
Unlock Deck
k this deck
40
Suppose a firm experiences decreasing returns to scale. This is shown graphically by
A) a downward-sloping long-run marginal-cost curve.
B) a downward-sloping long-run average cost curve.
C) a horizontal long-run average cost curve.
D) an upward-sloping long-run average cost curve.
E) an increasing marginal product curve.
A) a downward-sloping long-run marginal-cost curve.
B) a downward-sloping long-run average cost curve.
C) a horizontal long-run average cost curve.
D) an upward-sloping long-run average cost curve.
E) an increasing marginal product curve.
Unlock Deck
Unlock for access to all 107 flashcards in this deck.
Unlock Deck
k this deck
41
If there is a fall in all factor prices faced by a firm,
A) there will be a downward shift in the long-run average cost curve but not in the short-run average cost curve.
B) there will be no change in the cost curves in the long run.
C) the firm will move to a lower point on both its long-run and short-run average cost curves.
D) the firm will move to a lower point on its long-run average cost curve only.
E) both the long-run and short-run average cost curves will shift downward.
Unlock Deck
Unlock for access to all 107 flashcards in this deck.
Unlock Deck
k this deck
42
Which of the following paired concepts are equivalent to each other?
A) increasing costs; economies of scale
B) increasing returns; diseconomies of scale
C) increasing returns; decreasing costs
D) constant costs; economies of scale
E) increasing returns; increasing costs
A) increasing costs; economies of scale
B) increasing returns; diseconomies of scale
C) increasing returns; decreasing costs
D) constant costs; economies of scale
E) increasing returns; increasing costs
Unlock Deck
Unlock for access to all 107 flashcards in this deck.
Unlock Deck
k this deck
43
The figure below shows the isocost lines and the isoquant map for a firm producing golf tees. FIGURE 8-6
Refer to Figure 8-6.
A) the firm has adjusted the factor prices to equate the ratio of marginal products of the factors.
B) the ratio of the marginal utilities of capital and labour is equal to the ratio of the prices of capital and labour.
C) the ratio of the marginal products of capital and labour is equal to the ratio of the prices of capital and labour.
D) the firm can adjust its employment of factors to reduce its total cost, with output unchanged.
E) the firm is at its cost-minimizing position for an output level of 4000 golf tees.
FIGURE 8-6Refer to Figure 8-6.
A) the firm has adjusted the factor prices to equate the ratio of marginal products of the factors.
B) the ratio of the marginal utilities of capital and labour is equal to the ratio of the prices of capital and labour.
C) the ratio of the marginal products of capital and labour is equal to the ratio of the prices of capital and labour.
D) the firm can adjust its employment of factors to reduce its total cost, with output unchanged.
E) the firm is at its cost-minimizing position for an output level of 4000 golf tees.
Unlock Deck
Unlock for access to all 107 flashcards in this deck.
Unlock Deck
k this deck
44
The figure below shows a family of cost curves for a firm. The subscripts 1, 2, and 3 for the SRATC curves refer to different plant sizes. FIGURE 8-3
Refer to Figure 8-3. If this firm is producing at point B, then
A) this firm is producing a level of output that is technically inefficient in the long run.
B) this firm could produce the same level of output at a lower cost with plant size 2.
C) it should employ more of its variable factors of production.
D) this firm is experiencing decreasing returns to scale.
E) plant size 1 is optimal.
FIGURE 8-3Refer to Figure 8-3. If this firm is producing at point B, then
A) this firm is producing a level of output that is technically inefficient in the long run.
B) this firm could produce the same level of output at a lower cost with plant size 2.
C) it should employ more of its variable factors of production.
D) this firm is experiencing decreasing returns to scale.
E) plant size 1 is optimal.
Unlock Deck
Unlock for access to all 107 flashcards in this deck.
Unlock Deck
k this deck
45
The fact that new methods to extract oil are developed as oil prices increase suggests
A) nothing; changes in technology occur regardless of market prices.
B) that invention does respond to economic signals and is endogenous.
C) that methods of production do not change in response to factor-price changes.
D) that invention is exogenous.
E) that oil has many close substitutes.
A) nothing; changes in technology occur regardless of market prices.
B) that invention does respond to economic signals and is endogenous.
C) that methods of production do not change in response to factor-price changes.
D) that invention is exogenous.
E) that oil has many close substitutes.
Unlock Deck
Unlock for access to all 107 flashcards in this deck.
Unlock Deck
k this deck
46
Movement from one point to another along an isoquant implies a change in
A) factor combinations, holding output constant.
B) output levels, holding factor combinations constant.
C) the level of output, independent of what happens to factor combinations.
D) money income.
E) product prices.
A) factor combinations, holding output constant.
B) output levels, holding factor combinations constant.
C) the level of output, independent of what happens to factor combinations.
D) money income.
E) product prices.
Unlock Deck
Unlock for access to all 107 flashcards in this deck.
Unlock Deck
k this deck
47
The figure below shows a family of cost curves for a firm. The subscripts 1, 2, and 3 for the SRATC curves refer to different plant sizes. FIGURE 8-3
Refer to Figure 8-3. The minimum efficient scale is achieved by this firm at output level
A) Q₃.
B) Q₄.
C) Q₂.
D) Q₁.
E) Q5.
FIGURE 8-3Refer to Figure 8-3. The minimum efficient scale is achieved by this firm at output level
A) Q₃.
B) Q₄.
C) Q₂.
D) Q₁.
E) Q5.
Unlock Deck
Unlock for access to all 107 flashcards in this deck.
Unlock Deck
k this deck
48
A firm operates at its least-cost position for a given level of output by equating
A) the average product for each factor.
B) the price of each input.
C) the marginal product per dollar spent for each factor.
D) the marginal product of each factor.
E) the total expenditure on each input.
A) the average product for each factor.
B) the price of each input.
C) the marginal product per dollar spent for each factor.
D) the marginal product of each factor.
E) the total expenditure on each input.
Unlock Deck
Unlock for access to all 107 flashcards in this deck.
Unlock Deck
k this deck
49
Suppose that capital costs $6 per unit and labour costs $3 per unit. If the marginal product ofcapital is 3 and the marginal product of labour is 6, the cost-minimizing firm should
A) employ more capital and less labour.
B) employ less capital and more labour.
C) not change its current factor use.
D) employ less of both capital and labour.
E) employ more of both capital and labour.
A) employ more capital and less labour.
B) employ less capital and more labour.
C) not change its current factor use.
D) employ less of both capital and labour.
E) employ more of both capital and labour.
Unlock Deck
Unlock for access to all 107 flashcards in this deck.
Unlock Deck
k this deck
50
When there is no other way of producing a given level of output with a smaller total value of inputs, the firm is operating at
A) maximum profit.
B) optimal output.
C) minimum cost.
D) maximum output.
E) an irrelevant output.
A) maximum profit.
B) optimal output.
C) minimum cost.
D) maximum output.
E) an irrelevant output.
Unlock Deck
Unlock for access to all 107 flashcards in this deck.
Unlock Deck
k this deck
51
The long-run average cost (LRAC) curve shows
A) the operation of the law of diminishing returns.
B) the highest unit costs of producing a given output.
C) the same as the short-run average cost curve.
D) the lowest unit cost at which the firm can produce a given output.
E) what happens to the fixed costs in the long run.
A) the operation of the law of diminishing returns.
B) the highest unit costs of producing a given output.
C) the same as the short-run average cost curve.
D) the lowest unit cost at which the firm can produce a given output.
E) what happens to the fixed costs in the long run.
Unlock Deck
Unlock for access to all 107 flashcards in this deck.
Unlock Deck
k this deck
52
When a cost-minimizing firm is faced with an increase in the relative price of labour, it adjusts its factor usage so as to
A) increase the marginal product of capital relative to the marginal product of labour.
B) use more of both capital and labour per unit of output.
C) increase the marginal product of labour relative to the marginal product of capital.
D) use more labour per unit of output than before.
E) maintain the previous usage of labour.
Unlock Deck
Unlock for access to all 107 flashcards in this deck.
Unlock Deck
k this deck
53
The figure below shows a family of cost curves for a firm. The subscripts 1, 2, and 3 for the SRATC curves refer to different plant sizes. FIGURE 8-3
Refer to Figure 8-4. The firm is initially minimizing the cost of producing 1000 units of output.Suppose the factor prices then change such that the price of capital (K) falls and the price of labour(L) rises. If the firm decides to leave its output unchanged, it will now move toward the point
A) A.
B) B.
C) C.
D) D.
E) unknown as there is insufficient information to know
FIGURE 8-3Refer to Figure 8-4. The firm is initially minimizing the cost of producing 1000 units of output.Suppose the factor prices then change such that the price of capital (K) falls and the price of labour(L) rises. If the firm decides to leave its output unchanged, it will now move toward the point
A) A.
B) B.
C) C.
D) D.
E) unknown as there is insufficient information to know
Unlock Deck
Unlock for access to all 107 flashcards in this deck.
Unlock Deck
k this deck
54
Suppose that capital costs $6 per unit and labour costs $3 per unit. If the marginal product ofcapital is 12 and the marginal product of labour is 6, the cost-minimizing firm should
A) employ more capital and less labour.
B) employ less of both capital and labour.
C) employ more of both capital and labour.
D) employ less capital and more labour.
E) not change its current factor use.
A) employ more capital and less labour.
B) employ less of both capital and labour.
C) employ more of both capital and labour.
D) employ less capital and more labour.
E) not change its current factor use.
Unlock Deck
Unlock for access to all 107 flashcards in this deck.
Unlock Deck
k this deck
55
The principle of substitution plays a central role in resource allocation because it demonstrates that
A) firms will find it profitable to make abundant use of relatively scarce factors.
B) prices will be relatively low for those factors for which demand is high relative to supply.
C) firms can use all factors of production interchangeably with no impact on their costs.
D) methods of producing the same commodity will not differ from one country to another.
E) relative factor prices reflect relative scarcities of factors in the economy and so firms will find it profitable to make abundant use of relatively abundant factors.
Unlock Deck
Unlock for access to all 107 flashcards in this deck.
Unlock Deck
k this deck
56
In the long run, decreasing returns to scale are likely to be caused by
A) decreasing costs.
B) diminishing returns to the variable factor.
C) management diseconomies.
D) increasing specialization.
E) a decrease in factor prices.
A) decreasing costs.
B) diminishing returns to the variable factor.
C) management diseconomies.
D) increasing specialization.
E) a decrease in factor prices.
Unlock Deck
Unlock for access to all 107 flashcards in this deck.
Unlock Deck
k this deck
57
The figure below shows the isocost lines facing a firm producing golf tees. FIGURE 8-5
Refer to Figure 8-5. is equal to
A) -not determinable from the information provided.
B) 2.
C) 2/5.
D) 5.
E) 5/2.
FIGURE 8-5Refer to Figure 8-5. is equal to
A) -not determinable from the information provided.
B) 2.
C) 2/5.
D) 5.
E) 5/2.
Unlock Deck
Unlock for access to all 107 flashcards in this deck.
Unlock Deck
k this deck
58
Consider a firm that uses only labour and capital. At the present use of labour and capital, the MP of labour is two times the MP of capital, and the price of labour is two times the price of capital. In order to minimize its costs, the firm should
A) not alter its present factor mix.
B) decrease capital and increase labour.
C) increase both labour and capital.
D) decrease both capital and labour.
E) substitute capital for labour until their marginal products are equal.
A) not alter its present factor mix.
B) decrease capital and increase labour.
C) increase both labour and capital.
D) decrease both capital and labour.
E) substitute capital for labour until their marginal products are equal.
Unlock Deck
Unlock for access to all 107 flashcards in this deck.
Unlock Deck
k this deck
59
By expressing the cost-minimizing condition as MPK/MPL = PK/PL, we are able to see 68)
A) that the capital-labour ratio is fixed.
B) that the firm is producing at a lower cost if the left-hand side of the equation is greater than the right-hand side.
C) that the ratio of factor prices is constant over time.
D) how the firm determines its profit-maximizing output.
E) how the firm can adjust the marginal products of the factors of production to the prices of the factors given by the market.
Unlock Deck
Unlock for access to all 107 flashcards in this deck.
Unlock Deck
k this deck
60
Suppose a firm is employing labour (L) and capital (K) such that MPK/MPL = PK/PL. If the price of labour rises, the cost-minimizing firm should
A) do nothing.
B) employ more capital and less labour because MPK/MPL < PK/PL.
C) employ more labour and less capital because MPK/MPL < PK/PL
D) employ more labour and less capital because MPK/MPL > PK/PL.
E) employ more capital and less labour because MPK/MPL > PK/PL
A) do nothing.
B) employ more capital and less labour because MPK/MPL < PK/PL.
C) employ more labour and less capital because MPK/MPL < PK/PL
D) employ more labour and less capital because MPK/MPL > PK/PL.
E) employ more capital and less labour because MPK/MPL > PK/PL
Unlock Deck
Unlock for access to all 107 flashcards in this deck.
Unlock Deck
k this deck
61
A firm's least-cost position for producing a given output level occurs at that point where
A) the isocost line intersects the highest isoquant.
B) the isocost and isoquant intersect the vertical axis.
C) the isocost and isoquant intersect the horizontal axis.
D) the isocost line and the isoquant are tangent to each other.
E) the isoquant is closest to the origin.
A) the isocost line intersects the highest isoquant.
B) the isocost and isoquant intersect the vertical axis.
C) the isocost and isoquant intersect the horizontal axis.
D) the isocost line and the isoquant are tangent to each other.
E) the isoquant is closest to the origin.
Unlock Deck
Unlock for access to all 107 flashcards in this deck.
Unlock Deck
k this deck
62
If there is an improvement in the firm's technology,
A) there will be no change in the cost curves in the long run.
B) the firm will move to a lower point on both its long-run and short-run average cost curves.
C) the firm will move to a lower point on its long-run average cost curve only.
D) there will be a downward shift in the long-run average cost curve but not in the short-run average cost curve.
E) both the long-run and short-run average cost curves will shift downward.
Unlock Deck
Unlock for access to all 107 flashcards in this deck.
Unlock Deck
k this deck
63
The following table shows the marginal products of capital (K) and labour (L) for various methods for Firm ABC to produce 1000 toys per day. TABLE 8-2
Refer to Table 8-2. Suppose capital costs $80 per unit and labour costs $24 per unit. Which production method minimizes the cost of producing 1000 toys per day.
A) method B
B) method C
C) method D
D) method E
E) method F
TABLE 8-2Refer to Table 8-2. Suppose capital costs $80 per unit and labour costs $24 per unit. Which production method minimizes the cost of producing 1000 toys per day.
A) method B
B) method C
C) method D
D) method E
E) method F
Unlock Deck
Unlock for access to all 107 flashcards in this deck.
Unlock Deck
k this deck
64
The figure below shows a family of cost curves for a firm. The subscripts 1, 2, and 3 for the SRATC curves refer to different plant sizes. FIGURE 8-3
Refer to Figure 8-3. The difference between the SRATC curves and the LRAC curve is that
A) the LRAC is an envelope curve, joining the minimum points on all SRATC curves.
B) for the SRATC curves, one or more of the factors of production is fixed, whereas for the LRAC curve, all factors of production are variable.
C) the SRATC curves show the lowest attainable cost of production at each level of output when all factors are variable in the short run, whereas the LRAC curve shows the same in the long run.
D) the SRATC curves show diseconomies of scales, whereas the LRAC curve shows economies of scale.
E) the SRATC curves show the optimal plant size when all factors of production are variable, whereas the LRAC shows the lowest cost attainable associated with each LRAC curve.
FIGURE 8-3Refer to Figure 8-3. The difference between the SRATC curves and the LRAC curve is that
A) the LRAC is an envelope curve, joining the minimum points on all SRATC curves.
B) for the SRATC curves, one or more of the factors of production is fixed, whereas for the LRAC curve, all factors of production are variable.
C) the SRATC curves show the lowest attainable cost of production at each level of output when all factors are variable in the short run, whereas the LRAC curve shows the same in the long run.
D) the SRATC curves show diseconomies of scales, whereas the LRAC curve shows economies of scale.
E) the SRATC curves show the optimal plant size when all factors of production are variable, whereas the LRAC shows the lowest cost attainable associated with each LRAC curve.
Unlock Deck
Unlock for access to all 107 flashcards in this deck.
Unlock Deck
k this deck
65
Suppose a firm employs two kinds of inputs, capital at $100 per unit, and labour at $25 per unit. If the marginal product of capital is 50, then the firm should in order to minimize its production costs.
A) not change its current factor use
B) employ more labour and more capital
C) employ more labour and less capital
D) employ more capital and less labour
E) There is insufficient information to make a recommendation.
A) not change its current factor use
B) employ more labour and more capital
C) employ more labour and less capital
D) employ more capital and less labour
E) There is insufficient information to make a recommendation.
Unlock Deck
Unlock for access to all 107 flashcards in this deck.
Unlock Deck
k this deck
66
In the long run, a profit-maximizing firm producing a given level of output chooses the productionmethod that
A) maximizes the marginal product of labour.
B) produces that output at the lowest possible cost.
C) maximizes the marginal product of all factors.
D) leads to a flat total cost curve.
E) minimizes labour input.
A) maximizes the marginal product of labour.
B) produces that output at the lowest possible cost.
C) maximizes the marginal product of all factors.
D) leads to a flat total cost curve.
E) minimizes labour input.
Unlock Deck
Unlock for access to all 107 flashcards in this deck.
Unlock Deck
k this deck
67
Of the following, which is the least likely to represent a firm's long-run decision?
A) By how much should output be expanded from existing plants?
B) Should the firm count on an expanding or contracting share of the market?
C) Should the firm choose a method of production that uses relatively more capital than labour?
D) What technique (technology) is the best to use under current factor pricing?
E) What should be the size and design of a firm's new plant?
Unlock Deck
Unlock for access to all 107 flashcards in this deck.
Unlock Deck
k this deck
68
Movement from one point to another along an isocost line implies a change in
A) expenditure.
B) output levels, holding factor combinations constant.
C) factor combinations, holding expenditure constant.
D) factor prices.
E) the level of output, independent of what happens to factor combinations.
A) expenditure.
B) output levels, holding factor combinations constant.
C) factor combinations, holding expenditure constant.
D) factor prices.
E) the level of output, independent of what happens to factor combinations.
Unlock Deck
Unlock for access to all 107 flashcards in this deck.
Unlock Deck
k this deck
69
The figure below shows the isocost lines and the isoquant map for a firm producing golf tees. FIGURE 8-6
Refer to Figure 8-6.
A) 6 units of capital and 15 units of labour.
B) 12 units of capital and 30 units of labour.
C) 10 units of capital and 25 units of labour.
D) 4 units of capital and 10 units of labour.
E) 8 units of capital and 20 units of labour.
FIGURE 8-6Refer to Figure 8-6.
A) 6 units of capital and 15 units of labour.
B) 12 units of capital and 30 units of labour.
C) 10 units of capital and 25 units of labour.
D) 4 units of capital and 10 units of labour.
E) 8 units of capital and 20 units of labour.
Unlock Deck
Unlock for access to all 107 flashcards in this deck.
Unlock Deck
k this deck
70
Which of the following cost curves demonstrate increasing returns to scale?
A) returns to scale have nothing to do with the shape of the long-run average cost curve
B) a horizontal long-run average cost curve
C) a downward-sloping long-run average cost curve
D) an upward-sloping long-run average cost curve
E) a vertical long-run average cost curve
A) returns to scale have nothing to do with the shape of the long-run average cost curve
B) a horizontal long-run average cost curve
C) a downward-sloping long-run average cost curve
D) an upward-sloping long-run average cost curve
E) a vertical long-run average cost curve
Unlock Deck
Unlock for access to all 107 flashcards in this deck.
Unlock Deck
k this deck
71
Which of the following conditions indicate cost minimization, assuming two inputs, labour (L) and capital (K)?
A) PK · MPK = PL · MPL
B) MPK/PK = MPL/PL
C) MPK/PL = MPL/PK
D) MPL = MPK
E) PK = PL
A) PK · MPK = PL · MPL
B) MPK/PK = MPL/PL
C) MPK/PL = MPL/PK
D) MPL = MPK
E) PK = PL
Unlock Deck
Unlock for access to all 107 flashcards in this deck.
Unlock Deck
k this deck
72
The figure below shows a family of cost curves for a firm. The subscripts 1, 2, and 3 for the SRATC curves refer to different plant sizes. FIGURE 8-3
Refer to Figure 8-3. Each of the three SRATC curves shows
A) the output that is possible when all factors of production are fixed.
B) the lowest cost attainable, given that the plant size is the largest it can possibly be.
C) the lowest cost attainable, holding the plant size constant.
D) optimal plant sizes in the long run.
E) technically inefficient methods of production, given that they lie above the LRAC.
FIGURE 8-3Refer to Figure 8-3. Each of the three SRATC curves shows
A) the output that is possible when all factors of production are fixed.
B) the lowest cost attainable, given that the plant size is the largest it can possibly be.
C) the lowest cost attainable, holding the plant size constant.
D) optimal plant sizes in the long run.
E) technically inefficient methods of production, given that they lie above the LRAC.
Unlock Deck
Unlock for access to all 107 flashcards in this deck.
Unlock Deck
k this deck
73
The slope of an isoquant measures
A) the capital/labour ratio.
B) the marginal rate of (technical) substitution between factors.
C) the marginal cost of a given level of output.
D) the ratio of prices of inputs.
E) the ratio of prices of goods.
A) the capital/labour ratio.
B) the marginal rate of (technical) substitution between factors.
C) the marginal cost of a given level of output.
D) the ratio of prices of inputs.
E) the ratio of prices of goods.
Unlock Deck
Unlock for access to all 107 flashcards in this deck.
Unlock Deck
k this deck
74
A firm trying to maximize its profits in the long run should
A) charge the lowest price possible given the minimum possible cost.
B) select the most technically efficient method of production regardless of the level of production.
C) maximize the marginal product of all factors of production.
D) charge the highest price.
E) minimize the cost of producing the level of production it chooses.
Unlock Deck
Unlock for access to all 107 flashcards in this deck.
Unlock Deck
k this deck
75
Isocost lines are downward sloping straight lines, reflecting
A) increasing factor prices.
B) that each factor price has a negative value.
C) constant factor prices.
D) a change in relative factor prices.
E) decreasing factor prices.
A) increasing factor prices.
B) that each factor price has a negative value.
C) constant factor prices.
D) a change in relative factor prices.
E) decreasing factor prices.
Unlock Deck
Unlock for access to all 107 flashcards in this deck.
Unlock Deck
k this deck
76
The figure below shows the isocost lines and the isoquant map for a firm producing golf tees. FIGURE 8-6
Refer to Figure 8-6. As this firm is increasing its production of golf tees, it is experiencingreturns to scale.
A) not determinable from the information provided
B) constant
C) decreasing
D) diminishing
E) increasing
FIGURE 8-6Refer to Figure 8-6. As this firm is increasing its production of golf tees, it is experiencingreturns to scale.
A) not determinable from the information provided
B) constant
C) decreasing
D) diminishing
E) increasing
Unlock Deck
Unlock for access to all 107 flashcards in this deck.
Unlock Deck
k this deck
77
Suppose that capital costs $10 per unit and labour costs $4 per unit. If the marginal product of capital is 50 and the marginal product of labour is 50, the firm should in order to minimize its costs of producing its output.
A) employ less capital and labour
B) employ less capital and more labour
C) employ more capital and less labour
D) employ more capital and labour
E) not change its current factor use
A) employ less capital and labour
B) employ less capital and more labour
C) employ more capital and less labour
D) employ more capital and labour
E) not change its current factor use
Unlock Deck
Unlock for access to all 107 flashcards in this deck.
Unlock Deck
k this deck
78
A very-long-run consideration that could change a firm's production function is
A) size of the plant.
B) an improvement in education that increases the quality of the economy's labour force.
C) increasing returns to scale of operation.
D) diminishing returns.
E) rising cost of the factors of production.
A) size of the plant.
B) an improvement in education that increases the quality of the economy's labour force.
C) increasing returns to scale of operation.
D) diminishing returns.
E) rising cost of the factors of production.
Unlock Deck
Unlock for access to all 107 flashcards in this deck.
Unlock Deck
k this deck
79
The figure below shows the isocost lines and the isoquant map for a firm producing golf tees. FIGURE 8-6
Refer to Figure 8-6. Suppose this firm is producing 3000 golf tees and is at point F on the isoquant map. Which of the following is true?
A) MPL/MPK is greater than 5/2.
B) MPK/MPL is equal to 5/2.
C) MPK/MPL is equal to PK/PL.
D) MPK/MPL is equal to 2/5.
E) MPK/MPL is greater than 5/2.
FIGURE 8-6Refer to Figure 8-6. Suppose this firm is producing 3000 golf tees and is at point F on the isoquant map. Which of the following is true?
A) MPL/MPK is greater than 5/2.
B) MPK/MPL is equal to 5/2.
C) MPK/MPL is equal to PK/PL.
D) MPK/MPL is equal to 2/5.
E) MPK/MPL is greater than 5/2.
Unlock Deck
Unlock for access to all 107 flashcards in this deck.
Unlock Deck
k this deck
80
Any point representing a cost and output combination that is below the long-run average costcurve
A) is attainable if the firm minimizes its costs according to the "principle of substitution".
B) is attainable only when all factors are variable.
C) represents unattainable cost levels.
D) may represent actual cost and production levels in the short run.
E) represents less efficient cost levels than points on the long-run average cost curve.
Unlock Deck
Unlock for access to all 107 flashcards in this deck.
Unlock Deck
k this deck
Unlock Deck
Unlock for access to all 107 flashcards in this deck.


