Deck 11: Comparing Two Populations or Treatments
Full screen (f)
Question
Question
When testing hypotheses about and constructing confidence intervals for μ1 − μ2, we utilize the statistic,  . What are the mean and standard deviation of the sampling distribution of
  ?
?
. What are the mean and standard deviation of the sampling distribution of ? Question
Question
The perception of danger is an important characteristic for survival of animals. In a field experiment in Costa Rica, investigators located and directly approached black iguanas; that is, they walked straight towards them. Two treatments were randomly assigned to the individual iguanas. In one treatment the investigator gazed at the iguana while approaching, "maintaining eye contact." In a second treatment, the investigator did not gaze at the iguana while approaching. The outcome measure was the distance of the investigator from the iguana when it decided to run away. The researchers believe that eye contact is noticed by the iguana, leading to a longer approach distance. Data from this experiment appears in the table below. 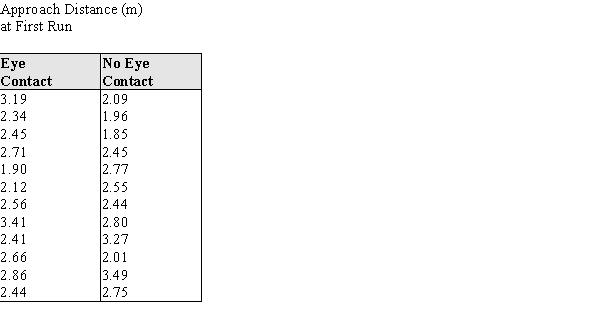
a) Using a graphical display of your choosing, assess the assumption that the distributions of approach distances are approximately normal. State your conclusion in a few sentences.
b) Assuming that it is OK to proceed with a two-sample t procedure, determine if there is sufficient evidence to conclude that there is a shorter mean approach distance for the "Eye contact" group.
c) In a few sentences, state any concerns you have about your conclusions in part (b), based on your results from part (a). If you have no concerns, write "No concerns."
Question
Question
Question
Question
Question
Question
Question
As part of the iguana risk assessment experiment described in the previous problem, investigators replicated the experiment with one difference--the investigators approached the iguanas at a tangent, passing by the iguana with a closest distance being 2 meters. Summary statistics for the approach distances for the two treatments, Eye Contact and No Eye Contact, are given in the table below: 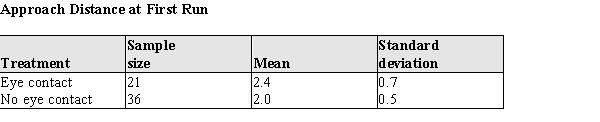 An initial analysis of the data revealed that it was reasonable to assume the population approach distances at first run were both approximately normal.
a) Construct a 95% confidence interval for the difference in approach distances for the eye contact and no eye contact treatments.
b) Do the data indicate that for a tangential approach, the population means differ? Justify your answer statistically.
An initial analysis of the data revealed that it was reasonable to assume the population approach distances at first run were both approximately normal. a) Construct a 95% confidence interval for the difference in approach distances for the eye contact and no eye contact treatments.
b) Do the data indicate that for a tangential approach, the population means differ? Justify your answer statistically.
Question
For two independent samples, 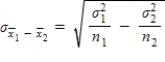 .
.
. Question
Researchers have hypothesized that female Downy Woodpeckers avoid the feeding areas of socially dominant males; that is, the males chase them away from prime spots. An alternative opinion is that there are important physical characteristics of males and females that might lead them to choose different foraging locations. One such characteristic could be the bill length of the males and females; it may be that longer bills let one gender or the other drill deeper into a tree and thus get more food per tree. The data in the table below are the bill lengths of 12 male and 12 female randomly selected Downy Woodpeckers caught and released in a banding survey. The investigators would like to know whether these data provide evidence that the males and females differ in bill size. 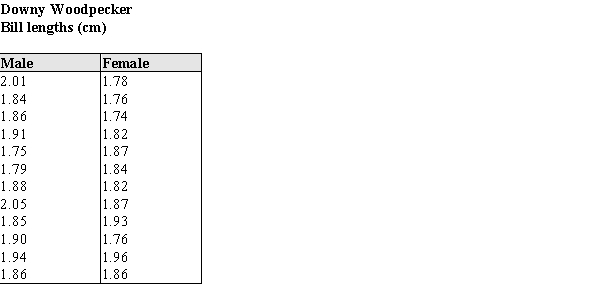
a) Using a graphical display of your choosing, assess the plausibility of the assumption that the distributions of bill lengths are approximately normal. State your conclusion in a few sentences.
b) Assuming that it is OK to proceed with a two-sample t procedure, determine if there is sufficient evidence to conclude that there is a difference in mean bill length for males and females.
c) In a few sentences, state any concerns you have about your conclusions in part (b), based on your results from part (a). If you have no concerns, write "No concerns."
Question
In 1992 Hurricane Andrew struck Florida causing widespread devastation. The eye of Hurricane Andrew passed directly over a site where scientists were studying the ecology of white-tailed deer. The deer had been radio-collared prior to Andrew's appearance, and the hurricane provided an opportunity to study the effects of an awesome storm on the deer. The investigators felt that the home ranges of the deer would change, but were unsure of the direction of the change. (The home range is the average area an animal occupies while foraging for food and defending its territory.) Home ranges of animals usually do not change much unless an area is under ecological stress. The home range data for a random sample of 18 white-tailed radio-collared deer are shown below in Table 1. The raw area of the home range for each of the deer is reported in hectares for the pre-hurricane year of 1992 and the post hurricane year of 1993. (A hectare is a metric unit of area equal to 2.471 acres.) 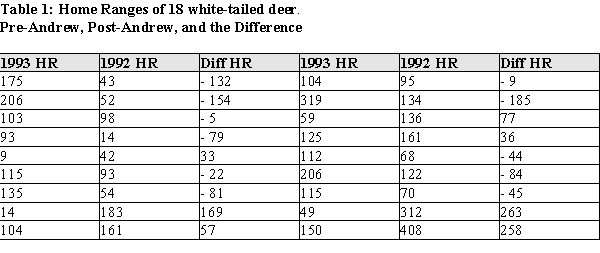
a) Using graphical display(s) of your choice show that the assumptions necessary for determining any change in the mean home ranges are plausible.
b) Construct a 95% confidence interval for the difference in means of the home ranges from before Andrew to after Andrew.
c) Do the data provide evidence of a change in the size of the home ranges after Hurricane Andrew? Provide statistical justification for your response.
Question
As part of the foraging behavior assessment described in the previous problem, investigators also measured the bill depths of the male and female Downy Woodpeckers. Summary statistics for these measures are given in the table below: 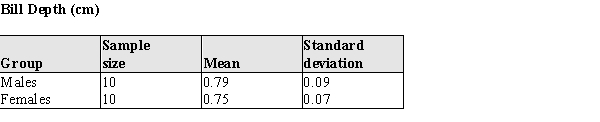 An initial analysis of the data revealed that it was reasonable to assume the bill depths for both sexes are approximately normal.
a) Construct a 95% confidence interval for the difference in bill depths of the males and females.
b) Do the data indicate that the bill depths differ? Justify your answer statistically.
An initial analysis of the data revealed that it was reasonable to assume the bill depths for both sexes are approximately normal. a) Construct a 95% confidence interval for the difference in bill depths of the males and females.
b) Do the data indicate that the bill depths differ? Justify your answer statistically.
Question
Question
Body fat and lean body mass can be estimated in living animals by measuring the total body electrical conductivity (TOBEC). This technique is useful when attempting to determine if "diet drugs" are working on laboratory rats over time--the researchers need not sacrifice the animals to measure the amount of adipose body fat after periods of drug usage. However, the procedure requires that the animal be totally inside the measurement chamber, which is fairly small. Some rats are so big that their tails must be tucked under their bodies before putting them into the measurement chamber. This is causing concern among the researchers, because there is a possibility the tail position might alter the measurements. To see if the TOBEC measurement is altered by the tail position of the rats, an experiment was run on 16 rats ranging in weight from 210 to 505 g.
The rats were randomly assigned the order of measurement, with 8 rats measured in the tail-under position first, and 8 rats in the tail-extended position. The data for the body fat measures, and the differences, are presented in the table below.
a)
Using graphical display(s) of your choice show that the assumptions necessary for the paired t-test are plausible.
b)
Test the hypothesis that there is no difference between the population mean TOBEC body fat measurements of rats in the tail-under vs. the tail-extended positions. For purposes of the statistics you may assume that these rats are a random sample of laboratory rats.
c)
Write a short paragraph based on your analysis above, explaining your results for laboratory technicians. Your paragraph should advise them whether or not it is necessary to make sure the tail positions of the rats are the same when replicating the lean mass body measurements during the experiment.
Question
Question
For both large and small samples the estimated standard deviation of  is calculated the same way.
is calculated the same way. Question
When testing hypotheses about and constructing confidence intervals for μ1 − μ2, we utilize the statistic,  . What are the mean and variance of the sampling distribution of
  ?
?
. What are the mean and variance of the sampling distribution of ? Question
In many animal societies, a role assumed by the adult male is a sentry, warning adult females and juveniles of approaching predators. Some students of animal behavior believe that this occurs in human society also. In one 4-month study in Seattle an investigator observed people crossing the street at an intersection with no traffic control. The observed behavior was the scanning behavior ("looking both ways") of adult males and females. The investigator reasoned that if the adult male assumed a protective sentry role, the scanning rate when alone would be less than when accompanied by an adult female. Data from this study is given below. 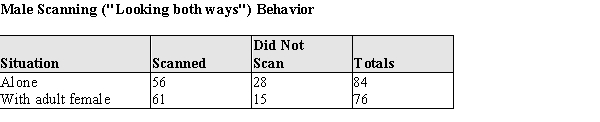 Do these data support the investigator's hypothesis that the male scanning rate would be greater when accompanied by a female? Assume that is reasonable to regard these samples as representative of the corresponding populations. Provide statistical justification for your answer.
Do these data support the investigator's hypothesis that the male scanning rate would be greater when accompanied by a female? Assume that is reasonable to regard these samples as representative of the corresponding populations. Provide statistical justification for your answer. Question
Question
The teacher noticed that 13 out of 20 girls read 90 words per minute by the end of the second grade, while only 9 out of 17 boys showed the same result. Interpret the following output produced by the Shiny app "Bootstrap Confidence Interval for Difference in Two Proportions". 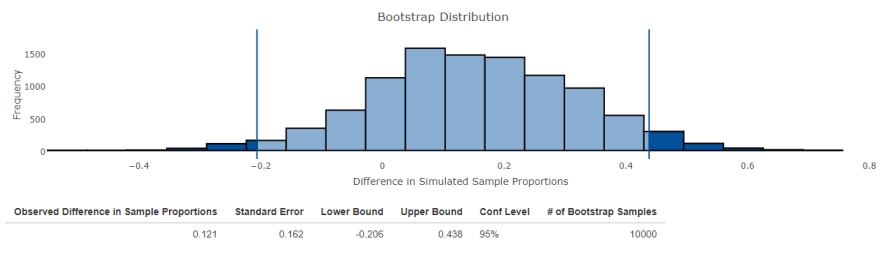
A) The interval (0.1, 0.65) contains the population mean difference with a 95% confidence.
B) The interval (−0.3, 0.1620) contains the population mean difference with a 95% confidence.
C) The interval (−0.21, 0.44) contains the population mean difference with a 95% confidence.
D) The interval (0.16, 0.44) contains the population mean difference with a 95% confidence.
E) The samples are too small to provide a definitive answer.
Question
The manager of a chain of shops compares the average revenues of two outlets, using data on revenues for 15 randomly selected days of the past year. Summary statistics for the revenue calculated using the given data for both outlets follow. 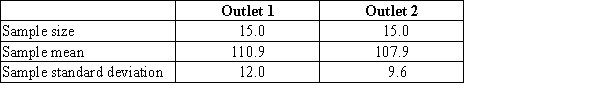 Use the output from the Shiny app "Randomization Test for the Difference in Two Population Means Using Independent Samples" to complete an appropriate hypothesis test.
 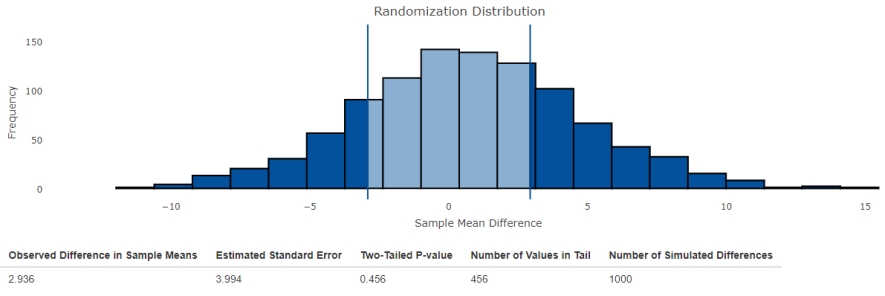 Interpret the obtained results, using a significance level of 0.1.
A) There is convincing evidence of a difference in the population means for the two outlets.
B) There is convincing evidence that the mean for outlet 2 is greater than the mean for outlet 1.
C) There is no convincing evidence of a difference in the population means for the two outlets.
D) There is convincing evidence that the mean for outlet 1 is greater than the mean for outlet 2.
E) The samples are too small to make a conclusion with the output.
Use the output from the Shiny app "Randomization Test for the Difference in Two Population Means Using Independent Samples" to complete an appropriate hypothesis test. Interpret the obtained results, using a significance level of 0.1. A) There is convincing evidence of a difference in the population means for the two outlets.
B) There is convincing evidence that the mean for outlet 2 is greater than the mean for outlet 1.
C) There is no convincing evidence of a difference in the population means for the two outlets.
D) There is convincing evidence that the mean for outlet 1 is greater than the mean for outlet 2.
E) The samples are too small to make a conclusion with the output.
Question
Question
A producer of instant breakfasts decides which new taste is appropriate for launching a series of products. For this purpose, a control group of 10 people is offered instant breakfasts with a cherry and cranberry flavor in a random order. Then, the group evaluates the taste of both products on a ten-point scale. The obtained data are given below. 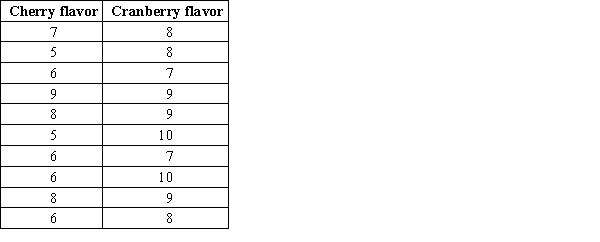 Estimate the difference in mean average rates for the cherry and cranberry flavors using the Shiny app "Bootstrap Confidence Interval for the Difference in Two Population Means Using Paired Samples". Use 10000 generated samples for more accurate results.
A) The interval (−3.2, −1.3) contains the population mean difference with a 95% confidence.
B) The interval (−2.9, −1.0) contains the population mean difference with a 95% confidence.
C) The interval (−2.4, 0.2) contains the population mean difference with a 95% confidence.
D) The interval (−2.2, 0.8) contains the population mean difference with a 95% confidence.
E) The samples are too small to make a conclusion with the output.
Estimate the difference in mean average rates for the cherry and cranberry flavors using the Shiny app "Bootstrap Confidence Interval for the Difference in Two Population Means Using Paired Samples". Use 10000 generated samples for more accurate results. A) The interval (−3.2, −1.3) contains the population mean difference with a 95% confidence.
B) The interval (−2.9, −1.0) contains the population mean difference with a 95% confidence.
C) The interval (−2.4, 0.2) contains the population mean difference with a 95% confidence.
D) The interval (−2.2, 0.8) contains the population mean difference with a 95% confidence.
E) The samples are too small to make a conclusion with the output.
Question
A common memory task is the classification of objects into categories. For example, a table is a piece of furniture; a dog is an animal, etc. This classification capability was used in a recent study of divided attention. College Psychology students were randomly selected and randomly assigned to one of two experimental conditions: divided attention and no divided attention. Students in the "divided attention" group were asked to memorize a list of 36 words while simultaneously listening to a tape recorder; students in a control group were told to memorize a list of 36 words and did not listen to a tape recorder. Each student was then asked to classify the 36 words into 6 categories. (There were 6 words in each category.) The distributions of the correct number of recalled words / category were approximately normal in each of the groups, and a summary of the data for the words/category recalled are presented below: 
a) Is there evidence that the memory performance differs in the two groups? Test the appropriate hypothesis using α = 0.05.
b) One possible implication of this study is that high school students should not be dividing their attention by listening to music while studying. What results, if any, of this study would support the contention that students should not be dividing their attention?
Question
The Iowa Tests of Basic Skills is a collection of various achievement tests given to students in grades 1 - 8. Student achievement levels are reported on a scale that runs from 0 to 13. The North Snowshoe Community Schools are evaluating their reading program for students whose native language is not English. In one part of the study the reading comprehension of 10 students, randomly selected from a large population of students in the program, take the Reading Comprehension test in third and fourth grade. Their scores for each year, in grade equivalents, are listed below. 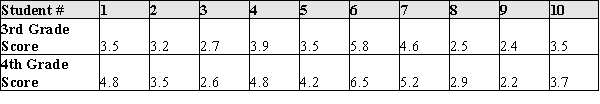 "Normal" growth, by definition, is a change of 1.0. Using the data above, test the hypothesis that the difference in means for 3rd and 4th grade students in this program for non-native English speakers is equal to 1.0.
"Normal" growth, by definition, is a change of 1.0. Using the data above, test the hypothesis that the difference in means for 3rd and 4th grade students in this program for non-native English speakers is equal to 1.0. Question
Assume you obtained a MINITAB output and a boxplot of differences between the number of fish at a depth of 5 meters and 10 meters. 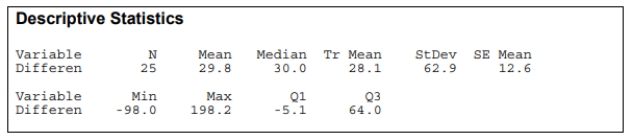
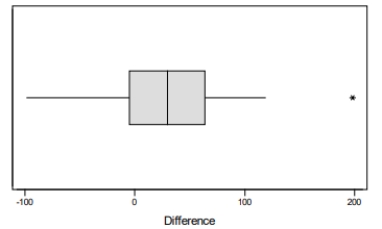 Choose the correct statement.
A) The boxplot of differences is approximately symmetric and does not show any outliers, so the assumption of normality is not unreasonable and we will use the paired t test.
B) The boxplot of differences is approximately symmetric, but has outliers, so the assumption of normality is not unreasonable and we will use the paired t test.
C) The boxplot of differences is approximately symmetric, but has outliers, so the assumption of normality is unreasonable and we cannot use the paired t test.
D) The boxplot of differences is approximately symmetric and does not show any outliers, so the assumption of normality is not unreasonable and we cannot use the paired t test.
Choose the correct statement. A) The boxplot of differences is approximately symmetric and does not show any outliers, so the assumption of normality is not unreasonable and we will use the paired t test.
B) The boxplot of differences is approximately symmetric, but has outliers, so the assumption of normality is not unreasonable and we will use the paired t test.
C) The boxplot of differences is approximately symmetric, but has outliers, so the assumption of normality is unreasonable and we cannot use the paired t test.
D) The boxplot of differences is approximately symmetric and does not show any outliers, so the assumption of normality is not unreasonable and we cannot use the paired t test.
Question
One of the most striking human accomplishments is the achievement of intelligible speech by age five. Deficits in speech acquisition often occur when a child has hearing difficulty or does is slow to develop the motor functions associated with speech. Other deficits in speech acquisition are of unknown origin. It has been hypothesized that a family history of speech communication disorder might be a factor in speech delay. The theory is that if members of the family have difficulty communicating, this may increase the probability of a speech deficit in a young family member. A random sample of healthy two-year-olds was followed over the course of a year. At age 3, each child was classified as having a speech delay or not. These data, cross-classified by a family history of speech communication disorder, is given in the table below: 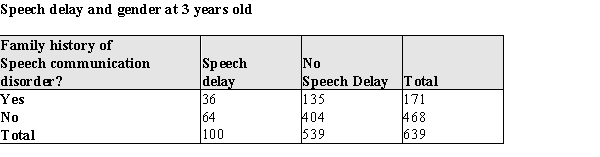 a) At the .05 significance level, do the data provide evidence of the hypothesized developmental differences? Provide statistical evidence for your conclusion. b) Is this an observational or experimental study? Justify your response in a few sentences.
a) At the .05 significance level, do the data provide evidence of the hypothesized developmental differences? Provide statistical evidence for your conclusion. b) Is this an observational or experimental study? Justify your response in a few sentences. Question
One of the most striking human accomplishments is the achievement of intelligible speech by age five. Deficits in speech acquisition often occur when a child has hearing difficulty or is slow to develop the motor functions associated with speech. Other deficits in speech acquisition are of unknown origin. Males generally develop physiologically at a slower rate than females, and in a recent large study of speech development in young children investigators hypothesized that a greater proportion of boys would have speech deficits for this reason. A random sample of healthy two-year-olds was followed over the course of a year. At age 3, each child was classified as having a speech delay or not. The data by gender is given in the table below: 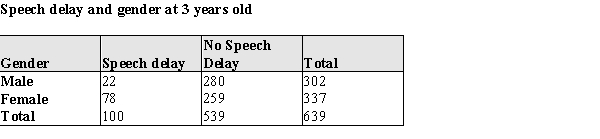
a) At the .05 significance level, do the data provide evidence of the hypothesized developmental differences? Provide statistical evidence for your conclusion.
b) Is this an observational or experimental study? Justify your response in a few sentences.
a) At the .05 significance level, do the data provide evidence of the hypothesized developmental differences? Provide statistical evidence for your conclusion.
b) Is this an observational or experimental study? Justify your response in a few sentences.
Question
The home range of an animal is the average area an animal occupies while foraging for food and defending its territory. It is thought that home ranges of animals usually do not change much, except when an area is under ecological stress. As part of a study of white-tailed deer in Florida in 1991 and 1992, deer were radiocollared and their movements followed over the course of a year. The home range data for a random sample of 18 white-tailed deer are shown below in Table 1. The raw area of the home range for each of the deer is reported in hectares for the years 1991 and 1992. (A hectare is a metric unit of area equal to 2.471 acres.) The investigators are interested in determining whether the home range white-tailed deer change over the course of as little time as a year. 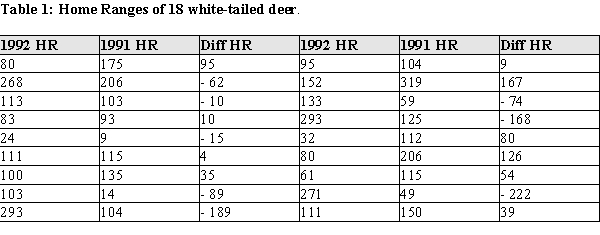 a) Using graphical display(s) of your choice show that the assumptions necessary for determining a change in the mean home ranges are plausible. b) Construct a 95% confidence interval for the difference in means of the home ranges from 1991 to 1992. c) Do the data provide evidence of a change in the size of the home ranges between 1991 and 1992? Provide statistical justification for y.
a) Using graphical display(s) of your choice show that the assumptions necessary for determining a change in the mean home ranges are plausible. b) Construct a 95% confidence interval for the difference in means of the home ranges from 1991 to 1992. c) Do the data provide evidence of a change in the size of the home ranges between 1991 and 1992? Provide statistical justification for y. Question
Question
In many animal societies, a role assumed by the adult male is a sentry, warning adult females and juveniles of approaching predators. Some students of animal behavior believe that in human society this role is active also. An interesting variation of this theory is that the human female accepts this role. In one 4-month study in Seattle, an investigator observed people crossing the street at an intersection with no traffic control. The observed behavior was the scanning behavior ("looking both ways") of adult males and females. The investigator reasoned that if the adult female accepted the protection of the adult male, the scanning rate when alone would be greater than when accompanied by an adult female. Data from this study is given below. 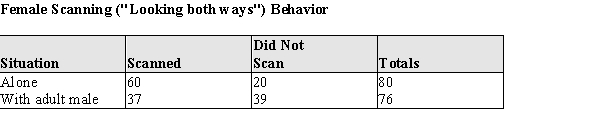 Do these data support the investigator's hypothesis that the female scanning rate would be less when accompanied by a male? Assume that it is reasonable to regard these samples as representative of the corresponding populations. Provide statistical justification for your answer.
Do these data support the investigator's hypothesis that the female scanning rate would be less when accompanied by a male? Assume that it is reasonable to regard these samples as representative of the corresponding populations. Provide statistical justification for your answer. Question
A common memory task is the classification of objects into categories. For example, a table is a piece of furniture; a dog is an animal, etc. This classification capability was used in a recent study of divided attention. Elderly adults were randomly selected from those answering a newspaper advertisement, and randomly assigned to two conditions: divided attention and no divided attention. Subjects in the "divided attention" group were told to memorize a list of 36 words while simultaneously listening to a tape recorder; subjects in a control group were told to memorize a list of 36 words and did not listen to a tape recorder. Subjects were then asked to classify the 36 words into 6 categories. (There were 6 words in each category.) The distributions of the correct number of recalled words / category were approximately normal in each of the groups, and a summary of the data for the words/category recalled are presented below: 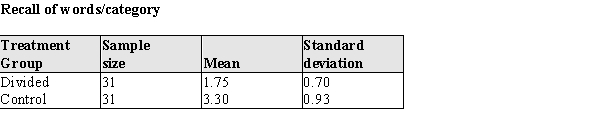 a) Is there evidence that the memory performance differs in the two groups? Test the appropriate hypothesis using α = .05. b) One possible implication of this study is that high school students should not be dividing their attention by listening to music while studying. What results, if any, of this study would support the contention that students should not be dividing their attention?
a) Is there evidence that the memory performance differs in the two groups? Test the appropriate hypothesis using α = .05. b) One possible implication of this study is that high school students should not be dividing their attention by listening to music while studying. What results, if any, of this study would support the contention that students should not be dividing their attention? Question
One method of human locomotion that appears to have no function except to express joy is skipping, a skill usually learned in early and middle childhood. In surveys gathered over a 3-year period, University students were asked, "Approximately how long ago did you last spontaneously skip?" The total sample sizes and the numbers who responded "Less than 1 week ago" are given in the table below: 
a) Construct a 95% confidence interval for the difference in the population proportions of males and females responding "Less than 1 week." Assume that it is reasonable to regard these samples as representative of the corresponding populations.
b) Does there appear to be a difference between the proportions of men and women responding "Less than 1 week?" Provide statistical justification for your answer.
Question
Question
An article proving effectiveness of a new hair growth shampoo was published on a producer's website. The producer states that two samples were compared, both consisted of 35 subjects. One group used the new shampoo, while the other used a shampoo without the components that activate hair growth. Both groups used the products three times a week. After a month, hair growth was measured for both samples. The producer declares that their shampoo significantly increases hair growth, because the P-value was less than 0.001 in a paired t test at a 0.01 significance level. The article also provided the following information on hair growth for the two experimental groups. 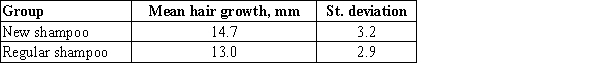 Is the producer's statement about the effectiveness of the product correct?
A) Yes, since it is consistent with the results of the study.
B) No, because the difference was likely to occur due to a coincidence.
C) No, because the two-sample t test should have been conducted.
D) No, because the announced P-value is incorrect.
E) The data provided was not enough.
Is the producer's statement about the effectiveness of the product correct? A) Yes, since it is consistent with the results of the study.
B) No, because the difference was likely to occur due to a coincidence.
C) No, because the two-sample t test should have been conducted.
D) No, because the announced P-value is incorrect.
E) The data provided was not enough.
Question
Viruses are infectious agents that often cause diseases in plants. Different viruses have different potency levels, and this fact can be used to detect whether a new virus is infecting plants in the field. In a potency comparison experiment, two viruses were placed on a tobacco leaf of 10 randomly selected tobacco plants in a field. The viruses were randomly assigned to one-half of each of the leaves. The table below presents the potency of the viruses, as measured by the number of lesions appearing on the leaf half. 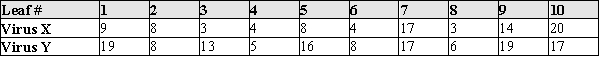 Test the hypothesis that there is no difference in mean number of lesions for Virus X and Virus Y.
Test the hypothesis that there is no difference in mean number of lesions for Virus X and Virus Y. Question
Body fat and lean body mass can be estimated in living animals by measuring the total body electrical conductivity (TOBEC). This technique is useful when attempting to determine if "diet drugs" are working on laboratory rats over time--the researchers need not sacrifice the animals to measure the amount of adipose body fat after periods of drug usage. However, the procedure requires that the animal be totally inside the measurement chamber, which is fairly small. Some rats are so big their tails must be tucked under their bodies before putting them into the measurement chamber. This is causing concern among the researchers, because there is a possibility the tail position might alter the measurements. To see if the TOBEC measurement is altered by the tail position of the rats, an experiment was run on 16 rats ranging in weight from 210 to 505 g.
The rats were randomly assigned the order of measurement, with 8 rats measured in the tail-under position first, and 8 rats in the tail-extended position. The data for the lean mass measures, and the differences, are presented in the table below.
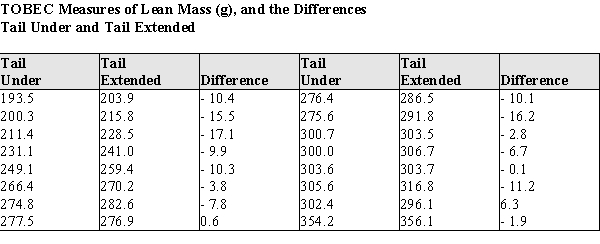
a) Using graphical display(s) of your choice show that the assumptions necessary for the paired t-test are plausible.
b) Test the hypothesis that there is no difference between the population mean TOBEC measurements of rats in the tail-under vs. the tail-extended positions. For purposes of the statistics you may assume that these rats are a random sample of laboratory rats.
c) Write a short paragraph based on your analysis above, explaining your results for laboratory technicians. Your paragraph should advise them whether or not it is necessary to make sure the tail positions of the rats are the same when replicating the lean mass body measurements during the experiment.
The rats were randomly assigned the order of measurement, with 8 rats measured in the tail-under position first, and 8 rats in the tail-extended position. The data for the lean mass measures, and the differences, are presented in the table below.
a) Using graphical display(s) of your choice show that the assumptions necessary for the paired t-test are plausible.
b) Test the hypothesis that there is no difference between the population mean TOBEC measurements of rats in the tail-under vs. the tail-extended positions. For purposes of the statistics you may assume that these rats are a random sample of laboratory rats.
c) Write a short paragraph based on your analysis above, explaining your results for laboratory technicians. Your paragraph should advise them whether or not it is necessary to make sure the tail positions of the rats are the same when replicating the lean mass body measurements during the experiment.
Question
Question

Unlock Deck
Sign up to unlock the cards in this deck!
Unlock Deck
Unlock Deck
1/42
Play
Full screen (f)
Deck 11: Comparing Two Populations or Treatments
1
p1 − p2 is a biased estimator of π1 − π2.
False
2
When testing hypotheses about and constructing confidence intervals for μ1 − μ2, we utilize the statistic, . What are the mean and standard deviation of the sampling distribution of ?
. What are the mean and standard deviation of the sampling distribution of ?The mean of the sampling distribution of  is
is 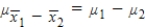 , the standard deviation is
  .
.
is , the standard deviation is . 3
When comparing two population means, it is important to know if the investigation was an experiment where the researcher was able to control which subject gets what treatment, or if the study was observational. Suppose that a statistically significant result is obtained in a study. How would the interpretations of the results differ, based on whether the study was observational or the study was an experiment?
If a study is not such that the treatments are randomly assigned, then no causal conclusions can be made. Therefore, even if two samples or treatments have a statistically significant difference, it will not be possible to decide that the two populations are different or that the two treatments have a different effect.
4
The perception of danger is an important characteristic for survival of animals. In a field experiment in Costa Rica, investigators located and directly approached black iguanas; that is, they walked straight towards them. Two treatments were randomly assigned to the individual iguanas. In one treatment the investigator gazed at the iguana while approaching, "maintaining eye contact." In a second treatment, the investigator did not gaze at the iguana while approaching. The outcome measure was the distance of the investigator from the iguana when it decided to run away. The researchers believe that eye contact is noticed by the iguana, leading to a longer approach distance. Data from this experiment appears in the table below.
a) Using a graphical display of your choosing, assess the assumption that the distributions of approach distances are approximately normal. State your conclusion in a few sentences.
b) Assuming that it is OK to proceed with a two-sample t procedure, determine if there is sufficient evidence to conclude that there is a shorter mean approach distance for the "Eye contact" group.
c) In a few sentences, state any concerns you have about your conclusions in part (b), based on your results from part (a). If you have no concerns, write "No concerns."
Unlock Deck
Unlock for access to all 42 flashcards in this deck.
Unlock Deck
k this deck
5
The number of degrees of freedom of the two-sample t test are the same as the degrees of freedom for the paired t test statistic.
Unlock Deck
Unlock for access to all 42 flashcards in this deck.
Unlock Deck
k this deck
6
Comparison of means focuses on the difference between two population or treatment means, μ1 − μ2. When testing the hypothesis, H0 : μ1 − μ2 = 0, there are three possible alternative hypotheses.
a) Using correct statistical notation, list these three alternative hypotheses.
b) For each alternative hypothesis in part (a), give an example of a situation from your own experience or your reading where one might use that alternative hypothesis. Be sure to clearly specify a context, define your variables, and state the null and alternative hypothesis.
Unlock Deck
Unlock for access to all 42 flashcards in this deck.
Unlock Deck
k this deck
7
The standard deviation of p1 − p2 used in the large sample test of π1 − π2 is the same as the standard deviation used in the large sample confidence interval for π1 − π2.
Unlock Deck
Unlock for access to all 42 flashcards in this deck.
Unlock Deck
k this deck
8
The P-value of an upper-tail t test is the area to the right of the calculated t value on the appropriate t curve.
Unlock Deck
Unlock for access to all 42 flashcards in this deck.
Unlock Deck
k this deck
9
When comparing two population means, it is important to make the distinction between independent samples and paired samples. What makes two samples independent?
Unlock Deck
Unlock for access to all 42 flashcards in this deck.
Unlock Deck
k this deck
10
The large sample z test for μ1 − μ2 can be used as long as at least one of the two sample sizes, n1 and n2, is greater than or equal to 30.
Unlock Deck
Unlock for access to all 42 flashcards in this deck.
Unlock Deck
k this deck
11
As part of the iguana risk assessment experiment described in the previous problem, investigators replicated the experiment with one difference--the investigators approached the iguanas at a tangent, passing by the iguana with a closest distance being 2 meters. Summary statistics for the approach distances for the two treatments, Eye Contact and No Eye Contact, are given in the table below: An initial analysis of the data revealed that it was reasonable to assume the population approach distances at first run were both approximately normal.
a) Construct a 95% confidence interval for the difference in approach distances for the eye contact and no eye contact treatments.
b) Do the data indicate that for a tangential approach, the population means differ? Justify your answer statistically.
An initial analysis of the data revealed that it was reasonable to assume the population approach distances at first run were both approximately normal. a) Construct a 95% confidence interval for the difference in approach distances for the eye contact and no eye contact treatments.
b) Do the data indicate that for a tangential approach, the population means differ? Justify your answer statistically.
Unlock Deck
Unlock for access to all 42 flashcards in this deck.
Unlock Deck
k this deck
12
For two independent samples, .
. Unlock Deck
Unlock for access to all 42 flashcards in this deck.
Unlock Deck
k this deck
13
Researchers have hypothesized that female Downy Woodpeckers avoid the feeding areas of socially dominant males; that is, the males chase them away from prime spots. An alternative opinion is that there are important physical characteristics of males and females that might lead them to choose different foraging locations. One such characteristic could be the bill length of the males and females; it may be that longer bills let one gender or the other drill deeper into a tree and thus get more food per tree. The data in the table below are the bill lengths of 12 male and 12 female randomly selected Downy Woodpeckers caught and released in a banding survey. The investigators would like to know whether these data provide evidence that the males and females differ in bill size.
a) Using a graphical display of your choosing, assess the plausibility of the assumption that the distributions of bill lengths are approximately normal. State your conclusion in a few sentences.
b) Assuming that it is OK to proceed with a two-sample t procedure, determine if there is sufficient evidence to conclude that there is a difference in mean bill length for males and females.
c) In a few sentences, state any concerns you have about your conclusions in part (b), based on your results from part (a). If you have no concerns, write "No concerns."
Unlock Deck
Unlock for access to all 42 flashcards in this deck.
Unlock Deck
k this deck
14
In 1992 Hurricane Andrew struck Florida causing widespread devastation. The eye of Hurricane Andrew passed directly over a site where scientists were studying the ecology of white-tailed deer. The deer had been radio-collared prior to Andrew's appearance, and the hurricane provided an opportunity to study the effects of an awesome storm on the deer. The investigators felt that the home ranges of the deer would change, but were unsure of the direction of the change. (The home range is the average area an animal occupies while foraging for food and defending its territory.) Home ranges of animals usually do not change much unless an area is under ecological stress. The home range data for a random sample of 18 white-tailed radio-collared deer are shown below in Table 1. The raw area of the home range for each of the deer is reported in hectares for the pre-hurricane year of 1992 and the post hurricane year of 1993. (A hectare is a metric unit of area equal to 2.471 acres.)
a) Using graphical display(s) of your choice show that the assumptions necessary for determining any change in the mean home ranges are plausible.
b) Construct a 95% confidence interval for the difference in means of the home ranges from before Andrew to after Andrew.
c) Do the data provide evidence of a change in the size of the home ranges after Hurricane Andrew? Provide statistical justification for your response.
Unlock Deck
Unlock for access to all 42 flashcards in this deck.
Unlock Deck
k this deck
15
As part of the foraging behavior assessment described in the previous problem, investigators also measured the bill depths of the male and female Downy Woodpeckers. Summary statistics for these measures are given in the table below: An initial analysis of the data revealed that it was reasonable to assume the bill depths for both sexes are approximately normal.
a) Construct a 95% confidence interval for the difference in bill depths of the males and females.
b) Do the data indicate that the bill depths differ? Justify your answer statistically.
An initial analysis of the data revealed that it was reasonable to assume the bill depths for both sexes are approximately normal. a) Construct a 95% confidence interval for the difference in bill depths of the males and females.
b) Do the data indicate that the bill depths differ? Justify your answer statistically.
Unlock Deck
Unlock for access to all 42 flashcards in this deck.
Unlock Deck
k this deck
16
The number of degrees of freedom used in the two-sample t test for independent samples are the same as the degrees of freedom used in the construction of a confidence interval for μ1 − μ2.
Unlock Deck
Unlock for access to all 42 flashcards in this deck.
Unlock Deck
k this deck
17
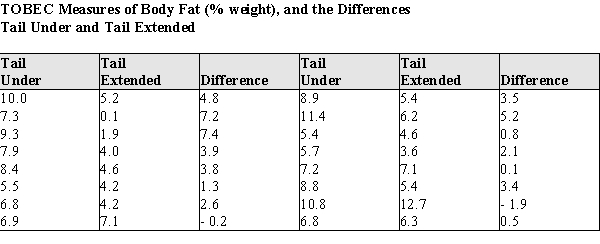
Body fat and lean body mass can be estimated in living animals by measuring the total body electrical conductivity (TOBEC). This technique is useful when attempting to determine if "diet drugs" are working on laboratory rats over time--the researchers need not sacrifice the animals to measure the amount of adipose body fat after periods of drug usage. However, the procedure requires that the animal be totally inside the measurement chamber, which is fairly small. Some rats are so big that their tails must be tucked under their bodies before putting them into the measurement chamber. This is causing concern among the researchers, because there is a possibility the tail position might alter the measurements. To see if the TOBEC measurement is altered by the tail position of the rats, an experiment was run on 16 rats ranging in weight from 210 to 505 g.
The rats were randomly assigned the order of measurement, with 8 rats measured in the tail-under position first, and 8 rats in the tail-extended position. The data for the body fat measures, and the differences, are presented in the table below.
a)
Using graphical display(s) of your choice show that the assumptions necessary for the paired t-test are plausible.
b)
Test the hypothesis that there is no difference between the population mean TOBEC body fat measurements of rats in the tail-under vs. the tail-extended positions. For purposes of the statistics you may assume that these rats are a random sample of laboratory rats.
c)
Write a short paragraph based on your analysis above, explaining your results for laboratory technicians. Your paragraph should advise them whether or not it is necessary to make sure the tail positions of the rats are the same when replicating the lean mass body measurements during the experiment.
The rats were randomly assigned the order of measurement, with 8 rats measured in the tail-under position first, and 8 rats in the tail-extended position. The data for the body fat measures, and the differences, are presented in the table below.
a)
Using graphical display(s) of your choice show that the assumptions necessary for the paired t-test are plausible.
b)
Test the hypothesis that there is no difference between the population mean TOBEC body fat measurements of rats in the tail-under vs. the tail-extended positions. For purposes of the statistics you may assume that these rats are a random sample of laboratory rats.
c)
Write a short paragraph based on your analysis above, explaining your results for laboratory technicians. Your paragraph should advise them whether or not it is necessary to make sure the tail positions of the rats are the same when replicating the lean mass body measurements during the experiment.
Unlock Deck
Unlock for access to all 42 flashcards in this deck.
Unlock Deck
k this deck
18
Two samples are said to be independent when the selection of the individuals in one sample has no bearing on the selection of those in the other sample.
Unlock Deck
Unlock for access to all 42 flashcards in this deck.
Unlock Deck
k this deck
19
For both large and small samples the estimated standard deviation of is calculated the same way.
is calculated the same way. Unlock Deck
Unlock for access to all 42 flashcards in this deck.
Unlock Deck
k this deck
20
When testing hypotheses about and constructing confidence intervals for μ1 − μ2, we utilize the statistic, . What are the mean and variance of the sampling distribution of ?
. What are the mean and variance of the sampling distribution of ? Unlock Deck
Unlock for access to all 42 flashcards in this deck.
Unlock Deck
k this deck
21
In many animal societies, a role assumed by the adult male is a sentry, warning adult females and juveniles of approaching predators. Some students of animal behavior believe that this occurs in human society also. In one 4-month study in Seattle an investigator observed people crossing the street at an intersection with no traffic control. The observed behavior was the scanning behavior ("looking both ways") of adult males and females. The investigator reasoned that if the adult male assumed a protective sentry role, the scanning rate when alone would be less than when accompanied by an adult female. Data from this study is given below. Do these data support the investigator's hypothesis that the male scanning rate would be greater when accompanied by a female? Assume that is reasonable to regard these samples as representative of the corresponding populations. Provide statistical justification for your answer.
Do these data support the investigator's hypothesis that the male scanning rate would be greater when accompanied by a female? Assume that is reasonable to regard these samples as representative of the corresponding populations. Provide statistical justification for your answer. Unlock Deck
Unlock for access to all 42 flashcards in this deck.
Unlock Deck
k this deck
22
The teacher noticed that 15 out of 21 girls read more than 90 words per minute by the end of the second grade, while only 8 out of 18 boys showed the same result. The null hypothesis is that the proportions of girls and boys who read more than 90 words per minute are equal. Calculate the two-sided P-value and make the following conclusion at α = 0.05 using the output of the Shiny app "Randomization Test for Two Proportions".
A) 0.03 < P-value < 0.05. There is convincing evidence of a difference in the population proportions for girls and boys.
B) 0.03 < P-value < 0.05. There is convincing evidence that the proportion of girls is greater than the proportion of boys.
C) 0.05 < P-value < 0.1. There is convincing evidence that the two population proportions are equal.
D) 0.05 < P-value < 0.1. There is no convincing evidence of a difference in the population proportions for girls and boys.
E) 0.1 < P-value < 0.5. There is no convincing evidence that the proportion of girls is greater than the proportion of boys.
Unlock Deck
Unlock for access to all 42 flashcards in this deck.
Unlock Deck
k this deck
23
The teacher noticed that 13 out of 20 girls read 90 words per minute by the end of the second grade, while only 9 out of 17 boys showed the same result. Interpret the following output produced by the Shiny app "Bootstrap Confidence Interval for Difference in Two Proportions".
A) The interval (0.1, 0.65) contains the population mean difference with a 95% confidence.
B) The interval (−0.3, 0.1620) contains the population mean difference with a 95% confidence.
C) The interval (−0.21, 0.44) contains the population mean difference with a 95% confidence.
D) The interval (0.16, 0.44) contains the population mean difference with a 95% confidence.
E) The samples are too small to provide a definitive answer.
Unlock Deck
Unlock for access to all 42 flashcards in this deck.
Unlock Deck
k this deck
24
The manager of a chain of shops compares the average revenues of two outlets, using data on revenues for 15 randomly selected days of the past year. Summary statistics for the revenue calculated using the given data for both outlets follow. Use the output from the Shiny app "Randomization Test for the Difference in Two Population Means Using Independent Samples" to complete an appropriate hypothesis test. Interpret the obtained results, using a significance level of 0.1.
A) There is convincing evidence of a difference in the population means for the two outlets.
B) There is convincing evidence that the mean for outlet 2 is greater than the mean for outlet 1.
C) There is no convincing evidence of a difference in the population means for the two outlets.
D) There is convincing evidence that the mean for outlet 1 is greater than the mean for outlet 2.
E) The samples are too small to make a conclusion with the output.
Use the output from the Shiny app "Randomization Test for the Difference in Two Population Means Using Independent Samples" to complete an appropriate hypothesis test. Interpret the obtained results, using a significance level of 0.1. A) There is convincing evidence of a difference in the population means for the two outlets.
B) There is convincing evidence that the mean for outlet 2 is greater than the mean for outlet 1.
C) There is no convincing evidence of a difference in the population means for the two outlets.
D) There is convincing evidence that the mean for outlet 1 is greater than the mean for outlet 2.
E) The samples are too small to make a conclusion with the output.
Unlock Deck
Unlock for access to all 42 flashcards in this deck.
Unlock Deck
k this deck
25
When is using the output of the Shiny app "Randomization Test for Difference in Two Treatment Means" appropriate?
A) When the number of sample differences is at least 30.
B) When the sample sizes are at least 30.
C) When the treatment response distributions are approximately normal.
D) When individuals or objects are randomly assigned to treatments (or vice versa).
E) None of above.
A) When the number of sample differences is at least 30.
B) When the sample sizes are at least 30.
C) When the treatment response distributions are approximately normal.
D) When individuals or objects are randomly assigned to treatments (or vice versa).
E) None of above.
Unlock Deck
Unlock for access to all 42 flashcards in this deck.
Unlock Deck
k this deck
26
A producer of instant breakfasts decides which new taste is appropriate for launching a series of products. For this purpose, a control group of 10 people is offered instant breakfasts with a cherry and cranberry flavor in a random order. Then, the group evaluates the taste of both products on a ten-point scale. The obtained data are given below. Estimate the difference in mean average rates for the cherry and cranberry flavors using the Shiny app "Bootstrap Confidence Interval for the Difference in Two Population Means Using Paired Samples". Use 10000 generated samples for more accurate results.
A) The interval (−3.2, −1.3) contains the population mean difference with a 95% confidence.
B) The interval (−2.9, −1.0) contains the population mean difference with a 95% confidence.
C) The interval (−2.4, 0.2) contains the population mean difference with a 95% confidence.
D) The interval (−2.2, 0.8) contains the population mean difference with a 95% confidence.
E) The samples are too small to make a conclusion with the output.
Estimate the difference in mean average rates for the cherry and cranberry flavors using the Shiny app "Bootstrap Confidence Interval for the Difference in Two Population Means Using Paired Samples". Use 10000 generated samples for more accurate results. A) The interval (−3.2, −1.3) contains the population mean difference with a 95% confidence.
B) The interval (−2.9, −1.0) contains the population mean difference with a 95% confidence.
C) The interval (−2.4, 0.2) contains the population mean difference with a 95% confidence.
D) The interval (−2.2, 0.8) contains the population mean difference with a 95% confidence.
E) The samples are too small to make a conclusion with the output.
Unlock Deck
Unlock for access to all 42 flashcards in this deck.
Unlock Deck
k this deck
27
A common memory task is the classification of objects into categories. For example, a table is a piece of furniture; a dog is an animal, etc. This classification capability was used in a recent study of divided attention. College Psychology students were randomly selected and randomly assigned to one of two experimental conditions: divided attention and no divided attention. Students in the "divided attention" group were asked to memorize a list of 36 words while simultaneously listening to a tape recorder; students in a control group were told to memorize a list of 36 words and did not listen to a tape recorder. Each student was then asked to classify the 36 words into 6 categories. (There were 6 words in each category.) The distributions of the correct number of recalled words / category were approximately normal in each of the groups, and a summary of the data for the words/category recalled are presented below:
a) Is there evidence that the memory performance differs in the two groups? Test the appropriate hypothesis using α = 0.05.
b) One possible implication of this study is that high school students should not be dividing their attention by listening to music while studying. What results, if any, of this study would support the contention that students should not be dividing their attention?
Unlock Deck
Unlock for access to all 42 flashcards in this deck.
Unlock Deck
k this deck
28
The Iowa Tests of Basic Skills is a collection of various achievement tests given to students in grades 1 - 8. Student achievement levels are reported on a scale that runs from 0 to 13. The North Snowshoe Community Schools are evaluating their reading program for students whose native language is not English. In one part of the study the reading comprehension of 10 students, randomly selected from a large population of students in the program, take the Reading Comprehension test in third and fourth grade. Their scores for each year, in grade equivalents, are listed below. "Normal" growth, by definition, is a change of 1.0. Using the data above, test the hypothesis that the difference in means for 3rd and 4th grade students in this program for non-native English speakers is equal to 1.0.
"Normal" growth, by definition, is a change of 1.0. Using the data above, test the hypothesis that the difference in means for 3rd and 4th grade students in this program for non-native English speakers is equal to 1.0. Unlock Deck
Unlock for access to all 42 flashcards in this deck.
Unlock Deck
k this deck
29
Assume you obtained a MINITAB output and a boxplot of differences between the number of fish at a depth of 5 meters and 10 meters. Choose the correct statement.
A) The boxplot of differences is approximately symmetric and does not show any outliers, so the assumption of normality is not unreasonable and we will use the paired t test.
B) The boxplot of differences is approximately symmetric, but has outliers, so the assumption of normality is not unreasonable and we will use the paired t test.
C) The boxplot of differences is approximately symmetric, but has outliers, so the assumption of normality is unreasonable and we cannot use the paired t test.
D) The boxplot of differences is approximately symmetric and does not show any outliers, so the assumption of normality is not unreasonable and we cannot use the paired t test.
Choose the correct statement. A) The boxplot of differences is approximately symmetric and does not show any outliers, so the assumption of normality is not unreasonable and we will use the paired t test.
B) The boxplot of differences is approximately symmetric, but has outliers, so the assumption of normality is not unreasonable and we will use the paired t test.
C) The boxplot of differences is approximately symmetric, but has outliers, so the assumption of normality is unreasonable and we cannot use the paired t test.
D) The boxplot of differences is approximately symmetric and does not show any outliers, so the assumption of normality is not unreasonable and we cannot use the paired t test.
Unlock Deck
Unlock for access to all 42 flashcards in this deck.
Unlock Deck
k this deck
30
One of the most striking human accomplishments is the achievement of intelligible speech by age five. Deficits in speech acquisition often occur when a child has hearing difficulty or does is slow to develop the motor functions associated with speech. Other deficits in speech acquisition are of unknown origin. It has been hypothesized that a family history of speech communication disorder might be a factor in speech delay. The theory is that if members of the family have difficulty communicating, this may increase the probability of a speech deficit in a young family member. A random sample of healthy two-year-olds was followed over the course of a year. At age 3, each child was classified as having a speech delay or not. These data, cross-classified by a family history of speech communication disorder, is given in the table below: a) At the .05 significance level, do the data provide evidence of the hypothesized developmental differences? Provide statistical evidence for your conclusion. b) Is this an observational or experimental study? Justify your response in a few sentences.
a) At the .05 significance level, do the data provide evidence of the hypothesized developmental differences? Provide statistical evidence for your conclusion. b) Is this an observational or experimental study? Justify your response in a few sentences. Unlock Deck
Unlock for access to all 42 flashcards in this deck.
Unlock Deck
k this deck
31
One of the most striking human accomplishments is the achievement of intelligible speech by age five. Deficits in speech acquisition often occur when a child has hearing difficulty or is slow to develop the motor functions associated with speech. Other deficits in speech acquisition are of unknown origin. Males generally develop physiologically at a slower rate than females, and in a recent large study of speech development in young children investigators hypothesized that a greater proportion of boys would have speech deficits for this reason. A random sample of healthy two-year-olds was followed over the course of a year. At age 3, each child was classified as having a speech delay or not. The data by gender is given in the table below:
a) At the .05 significance level, do the data provide evidence of the hypothesized developmental differences? Provide statistical evidence for your conclusion.
b) Is this an observational or experimental study? Justify your response in a few sentences.
a) At the .05 significance level, do the data provide evidence of the hypothesized developmental differences? Provide statistical evidence for your conclusion.
b) Is this an observational or experimental study? Justify your response in a few sentences.
Unlock Deck
Unlock for access to all 42 flashcards in this deck.
Unlock Deck
k this deck
32
The home range of an animal is the average area an animal occupies while foraging for food and defending its territory. It is thought that home ranges of animals usually do not change much, except when an area is under ecological stress. As part of a study of white-tailed deer in Florida in 1991 and 1992, deer were radiocollared and their movements followed over the course of a year. The home range data for a random sample of 18 white-tailed deer are shown below in Table 1. The raw area of the home range for each of the deer is reported in hectares for the years 1991 and 1992. (A hectare is a metric unit of area equal to 2.471 acres.) The investigators are interested in determining whether the home range white-tailed deer change over the course of as little time as a year. a) Using graphical display(s) of your choice show that the assumptions necessary for determining a change in the mean home ranges are plausible. b) Construct a 95% confidence interval for the difference in means of the home ranges from 1991 to 1992. c) Do the data provide evidence of a change in the size of the home ranges between 1991 and 1992? Provide statistical justification for y.
a) Using graphical display(s) of your choice show that the assumptions necessary for determining a change in the mean home ranges are plausible. b) Construct a 95% confidence interval for the difference in means of the home ranges from 1991 to 1992. c) Do the data provide evidence of a change in the size of the home ranges between 1991 and 1992? Provide statistical justification for y. Unlock Deck
Unlock for access to all 42 flashcards in this deck.
Unlock Deck
k this deck
33
Suppose you need to estimate a difference in mean systolic blood pressures between men and women. You've constructed a 95% confidence interval for this test and obtained the lower limit of −25.07 and the upper limit of 6.47. What conclusion can you make?
A) There is no statistically significant difference in mean systolic blood pressures between men and women.
B) We have sufficient evidence to conclude that there is a difference in mean systolic blood pressures between men and women.
C) There is statistically significant difference in mean systolic blood pressures between men and women.
D) The test was not conducted correctly.
Unlock Deck
Unlock for access to all 42 flashcards in this deck.
Unlock Deck
k this deck
34
In many animal societies, a role assumed by the adult male is a sentry, warning adult females and juveniles of approaching predators. Some students of animal behavior believe that in human society this role is active also. An interesting variation of this theory is that the human female accepts this role. In one 4-month study in Seattle, an investigator observed people crossing the street at an intersection with no traffic control. The observed behavior was the scanning behavior ("looking both ways") of adult males and females. The investigator reasoned that if the adult female accepted the protection of the adult male, the scanning rate when alone would be greater than when accompanied by an adult female. Data from this study is given below. Do these data support the investigator's hypothesis that the female scanning rate would be less when accompanied by a male? Assume that it is reasonable to regard these samples as representative of the corresponding populations. Provide statistical justification for your answer.
Do these data support the investigator's hypothesis that the female scanning rate would be less when accompanied by a male? Assume that it is reasonable to regard these samples as representative of the corresponding populations. Provide statistical justification for your answer. Unlock Deck
Unlock for access to all 42 flashcards in this deck.
Unlock Deck
k this deck
35
A common memory task is the classification of objects into categories. For example, a table is a piece of furniture; a dog is an animal, etc. This classification capability was used in a recent study of divided attention. Elderly adults were randomly selected from those answering a newspaper advertisement, and randomly assigned to two conditions: divided attention and no divided attention. Subjects in the "divided attention" group were told to memorize a list of 36 words while simultaneously listening to a tape recorder; subjects in a control group were told to memorize a list of 36 words and did not listen to a tape recorder. Subjects were then asked to classify the 36 words into 6 categories. (There were 6 words in each category.) The distributions of the correct number of recalled words / category were approximately normal in each of the groups, and a summary of the data for the words/category recalled are presented below: a) Is there evidence that the memory performance differs in the two groups? Test the appropriate hypothesis using α = .05. b) One possible implication of this study is that high school students should not be dividing their attention by listening to music while studying. What results, if any, of this study would support the contention that students should not be dividing their attention?
a) Is there evidence that the memory performance differs in the two groups? Test the appropriate hypothesis using α = .05. b) One possible implication of this study is that high school students should not be dividing their attention by listening to music while studying. What results, if any, of this study would support the contention that students should not be dividing their attention? Unlock Deck
Unlock for access to all 42 flashcards in this deck.
Unlock Deck
k this deck
36
One method of human locomotion that appears to have no function except to express joy is skipping, a skill usually learned in early and middle childhood. In surveys gathered over a 3-year period, University students were asked, "Approximately how long ago did you last spontaneously skip?" The total sample sizes and the numbers who responded "Less than 1 week ago" are given in the table below:
a) Construct a 95% confidence interval for the difference in the population proportions of males and females responding "Less than 1 week." Assume that it is reasonable to regard these samples as representative of the corresponding populations.
b) Does there appear to be a difference between the proportions of men and women responding "Less than 1 week?" Provide statistical justification for your answer.
Unlock Deck
Unlock for access to all 42 flashcards in this deck.
Unlock Deck
k this deck
37
Suppose that you wish to compare two treatments for preventing baldness in men. (The measure of baldness you will use is the mean number of healthy hair follicles per square cm.) In some circumstances, you may be able to randomly assign the treatments to the men, and in some circumstances, you may not be able to randomly assign the treatments to the men. Respond to the following questions in a few sentences.
a) If you are testing the hypothesis that the means are equal for the population, how would your statistical procedures differ, if at all, depending on whether you randomly assigned subjects to treatments or whether you merely observed differences in men who chose one treatment or the other?
b) How would your interpretation of the results differ, if at all, depending on whether you randomly assigned subjects to treatments or whether you merely observed differences in men who chose one treatment or the other?
Unlock Deck
Unlock for access to all 42 flashcards in this deck.
Unlock Deck
k this deck
38
An article proving effectiveness of a new hair growth shampoo was published on a producer's website. The producer states that two samples were compared, both consisted of 35 subjects. One group used the new shampoo, while the other used a shampoo without the components that activate hair growth. Both groups used the products three times a week. After a month, hair growth was measured for both samples. The producer declares that their shampoo significantly increases hair growth, because the P-value was less than 0.001 in a paired t test at a 0.01 significance level. The article also provided the following information on hair growth for the two experimental groups. Is the producer's statement about the effectiveness of the product correct?
A) Yes, since it is consistent with the results of the study.
B) No, because the difference was likely to occur due to a coincidence.
C) No, because the two-sample t test should have been conducted.
D) No, because the announced P-value is incorrect.
E) The data provided was not enough.
Is the producer's statement about the effectiveness of the product correct? A) Yes, since it is consistent with the results of the study.
B) No, because the difference was likely to occur due to a coincidence.
C) No, because the two-sample t test should have been conducted.
D) No, because the announced P-value is incorrect.
E) The data provided was not enough.
Unlock Deck
Unlock for access to all 42 flashcards in this deck.
Unlock Deck
k this deck
39
Viruses are infectious agents that often cause diseases in plants. Different viruses have different potency levels, and this fact can be used to detect whether a new virus is infecting plants in the field. In a potency comparison experiment, two viruses were placed on a tobacco leaf of 10 randomly selected tobacco plants in a field. The viruses were randomly assigned to one-half of each of the leaves. The table below presents the potency of the viruses, as measured by the number of lesions appearing on the leaf half. Test the hypothesis that there is no difference in mean number of lesions for Virus X and Virus Y.
Test the hypothesis that there is no difference in mean number of lesions for Virus X and Virus Y. Unlock Deck
Unlock for access to all 42 flashcards in this deck.
Unlock Deck
k this deck
40
Body fat and lean body mass can be estimated in living animals by measuring the total body electrical conductivity (TOBEC). This technique is useful when attempting to determine if "diet drugs" are working on laboratory rats over time--the researchers need not sacrifice the animals to measure the amount of adipose body fat after periods of drug usage. However, the procedure requires that the animal be totally inside the measurement chamber, which is fairly small. Some rats are so big their tails must be tucked under their bodies before putting them into the measurement chamber. This is causing concern among the researchers, because there is a possibility the tail position might alter the measurements. To see if the TOBEC measurement is altered by the tail position of the rats, an experiment was run on 16 rats ranging in weight from 210 to 505 g.
The rats were randomly assigned the order of measurement, with 8 rats measured in the tail-under position first, and 8 rats in the tail-extended position. The data for the lean mass measures, and the differences, are presented in the table below.
a) Using graphical display(s) of your choice show that the assumptions necessary for the paired t-test are plausible.
b) Test the hypothesis that there is no difference between the population mean TOBEC measurements of rats in the tail-under vs. the tail-extended positions. For purposes of the statistics you may assume that these rats are a random sample of laboratory rats.
c) Write a short paragraph based on your analysis above, explaining your results for laboratory technicians. Your paragraph should advise them whether or not it is necessary to make sure the tail positions of the rats are the same when replicating the lean mass body measurements during the experiment.
Unlock Deck
Unlock for access to all 42 flashcards in this deck.
Unlock Deck
k this deck
41
Choose the hypotheses that can be tested using paired-samples t tests.
A) People living in warm countries are happier than people from cold countries.
B) Homicide rates, on average, are higher in Western counties than in Southern counties of the United States.
C) Graduates had higher average salaries 10 years after the graduation than they had 5 years after the graduation.
D) The length of life, on average, is shorter for never-married persons than for married persons who married at least once.
Unlock Deck
Unlock for access to all 42 flashcards in this deck.
Unlock Deck
k this deck
42
Are the given hypotheses essentially the same? People at age 30 have less free time than they had at 20. and 30-year old people have less free time than 20-year old people.
Unlock Deck
Unlock for access to all 42 flashcards in this deck.
Unlock Deck
k this deck
Unlock Deck
Unlock for access to all 42 flashcards in this deck.


