Deck 10: Hypothesis Testing Using a Single Sample
Full screen (f)
Question
Question
Question
Question
Question
Question
Question
Question
Question
Question
Question
Question
Question
Question
Question
Question
Question
Question
Question
Question
Question
Question
Do the students in the campus spend less on food than an average American resident does? To answer this question, expenses of 25 students were calculated.  Food expenses of an average American person are $220. Interpret the output of the Shiny app "Randomization test for a population mean" using a significance level of 0.05.
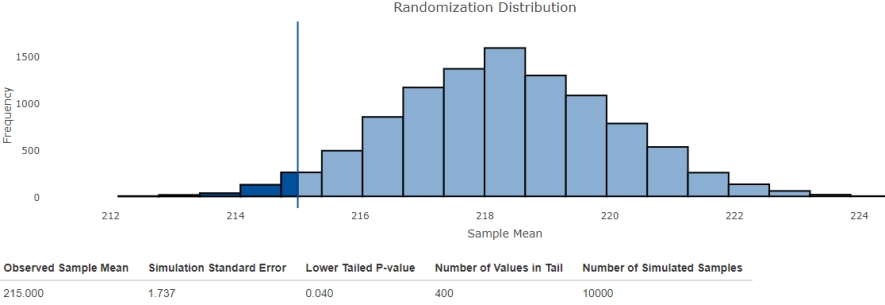
A) There is convincing evidence that students' expenses are less than the national average.
B) There is no convincing evidence that students' expenses are less than the national average.
C) There is convincing evidence that students' expenses are equal to the national average.
D) Students' expenses are certainly equal to the national average.
E) The population is too large to make a conclusion.
Food expenses of an average American person are $220. Interpret the output of the Shiny app "Randomization test for a population mean" using a significance level of 0.05. A) There is convincing evidence that students' expenses are less than the national average.
B) There is no convincing evidence that students' expenses are less than the national average.
C) There is convincing evidence that students' expenses are equal to the national average.
D) Students' expenses are certainly equal to the national average.
E) The population is too large to make a conclusion.
Question
Question
The local airport authority wants to investigate whether the mean of handled passengers per month has increased from 64,500 to plan maintenance works. Determine the valid null and alternative hypotheses.
A) H0: > 64,500 versus Ha:
  = 64,500
B) H0: µ = 64,500 versus Ha: µ > 64,500
C) H0: = 64,500 versus Ha: µ > 64,500
D) H0: µ > 64,500 versus Ha: µ = 64,500
E) H0: = 64,500 versus Ha:
  > 64,500
A) H0:
> 64,500 versus Ha: = 64,500B) H0: µ = 64,500 versus Ha: µ > 64,500
C) H0:
= 64,500 versus Ha: µ > 64,500D) H0: µ > 64,500 versus Ha: µ = 64,500
E) H0:
= 64,500 versus Ha: > 64,500 Question
Question
Question
Question
Question
Question
Question
The average wingspan of a crowned eagle is supposed to be 40 in. A random sample of 31 crowned eagles raised in captivity gave the following results:  = 39.5, s = 1.8. Do the data indicate that the wingspan of captive eagles is less than that of those that live in the wild? Use the significance level α = 0.05.
A) P-value < α, thus the null hypothesis is rejected. There is convincing evidence that the wingspan of captive eagles is less than that of those that live in the wild.
B) P-value > α, thus the null hypothesis is rejected. There is convincing evidence that the wingspan of captive eagles is less than that of those that live in the wild.
C) P-value < α, thus the null hypothesis is not rejected. There is no sufficient evidence to conclude that the wingspan of captive eagles is less than that of those that live in the wild.
D) P-value > α, thus the null hypothesis is not rejected. There is no sufficient evidence to conclude that the wingspan of captive eagles is less than that of those that live in the wild.
= 39.5, s = 1.8. Do the data indicate that the wingspan of captive eagles is less than that of those that live in the wild? Use the significance level α = 0.05.A) P-value < α, thus the null hypothesis is rejected. There is convincing evidence that the wingspan of captive eagles is less than that of those that live in the wild.
B) P-value > α, thus the null hypothesis is rejected. There is convincing evidence that the wingspan of captive eagles is less than that of those that live in the wild.
C) P-value < α, thus the null hypothesis is not rejected. There is no sufficient evidence to conclude that the wingspan of captive eagles is less than that of those that live in the wild.
D) P-value > α, thus the null hypothesis is not rejected. There is no sufficient evidence to conclude that the wingspan of captive eagles is less than that of those that live in the wild.
Question
According to a survey conducted 5 years ago, the proportion of left-handed students at a university was 0.12. Has the proportion increased over the years? A random sample of 50 students was chosen, 9 of whom were left-handed. Use the output from the Shiny app "Randomization Test for One Proportion" to complete an appropriate hypothesis test. 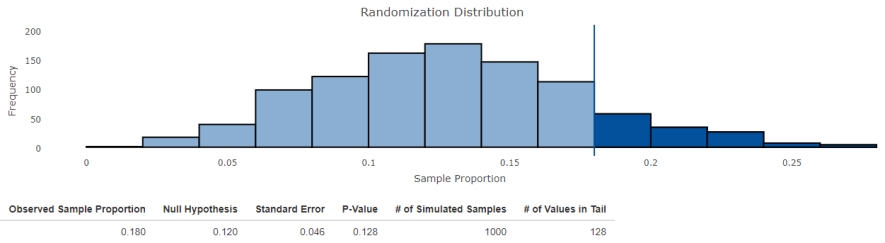 Interpret the obtained results, using a significance level of 0.1.
A) There is convincing evidence that the proportion of left-handed students has decreased.
B) There is convincing evidence that the proportion of left-handed students has increased.
C) There is no convincing evidence that the proportion of left-handed students has increased.
D) The proportion of left-handed students has certainly remained the same.
E) The sample is too small to make a conclusion.
Interpret the obtained results, using a significance level of 0.1. A) There is convincing evidence that the proportion of left-handed students has decreased.
B) There is convincing evidence that the proportion of left-handed students has increased.
C) There is no convincing evidence that the proportion of left-handed students has increased.
D) The proportion of left-handed students has certainly remained the same.
E) The sample is too small to make a conclusion.
Question
Question
Question
The university conducts a study designed to find out the proportion of students who have conversational fluency in two or more foreign languages. The previous study provided the result of 7%. The test is carried out using data from a random sample of n = 72. In this sample, the number of students who speak two or more foreign languages is 10. Complete an appropriate hypothesis test with α = 0.05 and make a conclusion using the output from the Shiny app "Exact Binomial Test for One Proportion". 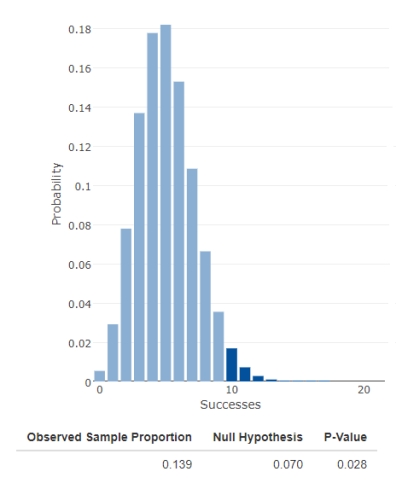
A) The proportion of students who speak two or more foreign languages has certainly remained the same.
B) There is convincing evidence that the proportion of students who speak two or more foreign languages has decreased.
C) There is no convincing evidence that the proportion of students who speak two or more foreign languages has increased.
D) There is convincing evidence that the proportion of students who speak two or more foreign languages has increased.
E) The sample is too small to make a conclusion.
Question
Question
The average sleeping time required for teenagers who experience major physical exertion is about 8 hours. Do the members of the school sport teams sleep enough? Sleeping time for a random sample of 16 sport team members was obtained.  Which test is appropriate for this sample?
A) A one-sample t test.
B) A large-sample z test and a randomization test for a population mean.
C) A large-sample z test.
D) A randomization test for a population mean and a one-sample t test.
E) A randomization test for a population mean.
Which test is appropriate for this sample? A) A one-sample t test.
B) A large-sample z test and a randomization test for a population mean.
C) A large-sample z test.
D) A randomization test for a population mean and a one-sample t test.
E) A randomization test for a population mean.

Unlock Deck
Sign up to unlock the cards in this deck!
Unlock Deck
Unlock Deck
1/37
Play
Full screen (f)
Deck 10: Hypothesis Testing Using a Single Sample
1
If the null hypothesis is not rejected, there is strong statistical evidence that the null hypothesis is true.
False
2
Children as young as 2 years of age, upon seeing an object placed under a pillow in a familiar setting at home, will understand to look for it after an interval of time and be able to find it. Investigators believe this capability will be less pronounced in a laboratory situation, where the child is away from the familiar setting of home. Let π denote the proportion of 2-year-olds than have this understanding in the home situation, and suppose that π = .35. The investigators wish to determine whether the proportion that remembers is less when the child is away from home.
a) What is the appropriate null hypothesis?
b) What is the appropriate alternative hypothesis?
c) In your own words, distinguish between a Type I and a Type II error in this context.
a) What is the appropriate null hypothesis?
b) What is the appropriate alternative hypothesis?
c) In your own words, distinguish between a Type I and a Type II error in this context.
a) H0 : π = .35
b) Ha : π < .35
c) A Type I error is to decide that children remember less when outside of the home environment, when in fact, they remember equally well. A Type II error is to decide that children remember as well in the laboratory setting as in the home setting, when in fact they remember less away from home.
3
The level of significance of a test is the probability of making a type I error, given that the null hypothesis is true.
True
4
Small P-values indicate that the observed sample is inconsistent with the null hypothesis.
Unlock Deck
Unlock for access to all 37 flashcards in this deck.
Unlock Deck
k this deck
5
The power of a test is the probability of failing to reject the null hypothesis.
Unlock Deck
Unlock for access to all 37 flashcards in this deck.
Unlock Deck
k this deck
6
Psychologists have noted that people tend make classifications based on their "typicality." For example, a dog is more readily classified as a mammal than is a whale, because dogs are "more typical" of mammals than are whales. Previous large-scale studies have established the following for songbirds such as robins: when young children are shown a picture of a songbird and asked if it is a bird they respond "yes" in an average of 750 milliseconds. Do children regard chickens as representative of birds? If so, are they more representative or less representative of birds than are songbirds? Let μ represent the mean time it takes children to respond to a question about whether a chicken is a bird. The investigators wish to determine whether the classification time differs from the time needed to classify songbirds.
a) What is the appropriate null hypothesis?
b) What is the appropriate alternative hypothesis?
c) In your own words, distinguish between a Type I and a Type II error in this context.
a) What is the appropriate null hypothesis?
b) What is the appropriate alternative hypothesis?
c) In your own words, distinguish between a Type I and a Type II error in this context.
Unlock Deck
Unlock for access to all 37 flashcards in this deck.
Unlock Deck
k this deck
7
The statement s2 = 100 is a statistical hypothesis.
Unlock Deck
Unlock for access to all 37 flashcards in this deck.
Unlock Deck
k this deck
8
In your own words, distinguish between "statistical" and "practical" significance.
Unlock Deck
Unlock for access to all 37 flashcards in this deck.
Unlock Deck
k this deck
9
The choice of the alternative hypothesis depends on the objectives of the study.
Unlock Deck
Unlock for access to all 37 flashcards in this deck.
Unlock Deck
k this deck
10
Explain in your own words what a hypothesis test is.
Unlock Deck
Unlock for access to all 37 flashcards in this deck.
Unlock Deck
k this deck
11
In cities and towns on the borders between states there is a significant amount of flight across state lines to avoid high state taxes on gasoline. Some states (such as Iowa) have large rivers for borders and tolls to cross the bridges. Do these tolls impede traffic to other states to get cheaper gasoline? To test this hypothesis, an experimental Toll-Free Week will be instituted at the Farmington Bridge, where currently 50 cars per day drive out of the state. Let μ denote the true average number of border crossings per day at Farmington if there were no toll.
a) What is the appropriate null hypothesis?
b) What is the appropriate alternative hypothesis?
c) In your own words, distinguish between a Type I and a Type II error in this context.
a) What is the appropriate null hypothesis?
b) What is the appropriate alternative hypothesis?
c) In your own words, distinguish between a Type I and a Type II error in this context.
Unlock Deck
Unlock for access to all 37 flashcards in this deck.
Unlock Deck
k this deck
12
Explain in your own words the distinction between a null and alternative hypothesis.
Unlock Deck
Unlock for access to all 37 flashcards in this deck.
Unlock Deck
k this deck
13
The Environmental Protection Agency (EPA) is charged with monitoring the environment. One aspect of this is keeping track of "acid rain," a broad term describing the fall of water through an acidic atmosphere. Acidity is measured on the pH scale, where pure water has a pH of 7.0. Normal rain is slightly acidic because carbon dioxide dissolves into it, and thus has a pH of about 5.5. (A lower pH indicates greater acidity.) Suppose the EPA wishes to determine whether a particular area is subject to acid rain. Let μ denote the true average for pH in this area.
a) What is the appropriate null hypothesis?
b) What is the appropriate alternative hypothesis?
c) In your own words, distinguish between a Type I and a Type II error in this context.
a) What is the appropriate null hypothesis?
b) What is the appropriate alternative hypothesis?
c) In your own words, distinguish between a Type I and a Type II error in this context.
Unlock Deck
Unlock for access to all 37 flashcards in this deck.
Unlock Deck
k this deck
14
It is customary to say that the result of a hypothesis test is statistically significant when the P-value is smaller than α.
Unlock Deck
Unlock for access to all 37 flashcards in this deck.
Unlock Deck
k this deck
15
β is called the observed significance level.
Unlock Deck
Unlock for access to all 37 flashcards in this deck.
Unlock Deck
k this deck
16
Suppose that a study has been published linking arsenic, which is commonly found in tap water, to increased cancer rates. The study also stated that arsenic levels below 10 ppm could be considered harmless. Suppose that residents of Hacienda Heights, CA, are worried about the arsenic level in the local tap water.
a) What hypothesis should they test?
b) Describe a Type I and Type II error in this context.
a) What hypothesis should they test?
b) Describe a Type I and Type II error in this context.
Unlock Deck
Unlock for access to all 37 flashcards in this deck.
Unlock Deck
k this deck
17
All other things being equal, choosing a smaller value of α will increase the probability of making a type II error.
Unlock Deck
Unlock for access to all 37 flashcards in this deck.
Unlock Deck
k this deck
18
For tests of hypotheses about μ, β decreases as the sample size increases if the level of significance stays the same.
Unlock Deck
Unlock for access to all 37 flashcards in this deck.
Unlock Deck
k this deck
19
A type II error is made by failing to reject a false null hypothesis.
Unlock Deck
Unlock for access to all 37 flashcards in this deck.
Unlock Deck
k this deck
20
When performing tests of hypotheses, there are assumptions that must be met in order for the test to be appropriate. For the test of a hypothesis about a population mean, and given the raw data, describe how you would check the assumptions.
Unlock Deck
Unlock for access to all 37 flashcards in this deck.
Unlock Deck
k this deck
21
Which information will be comprehensive when summarizing the results of a hypothesis test?
A) Hypotheses, test procedure, conclusion in context.
B) Hypotheses, test procedure, test statistic, conclusion in context.
C) Sample size, hypotheses, conclusion in context.
D) Hypotheses, test statistic, boxplot, normal probability plot, conclusion in context.
E) Hypotheses, significance level, test power, conclusion in context.
Unlock Deck
Unlock for access to all 37 flashcards in this deck.
Unlock Deck
k this deck
22
Do the students in the campus spend less on food than an average American resident does? To answer this question, expenses of 25 students were calculated. Food expenses of an average American person are $220. Interpret the output of the Shiny app "Randomization test for a population mean" using a significance level of 0.05.
A) There is convincing evidence that students' expenses are less than the national average.
B) There is no convincing evidence that students' expenses are less than the national average.
C) There is convincing evidence that students' expenses are equal to the national average.
D) Students' expenses are certainly equal to the national average.
E) The population is too large to make a conclusion.
Food expenses of an average American person are $220. Interpret the output of the Shiny app "Randomization test for a population mean" using a significance level of 0.05. A) There is convincing evidence that students' expenses are less than the national average.
B) There is no convincing evidence that students' expenses are less than the national average.
C) There is convincing evidence that students' expenses are equal to the national average.
D) Students' expenses are certainly equal to the national average.
E) The population is too large to make a conclusion.
Unlock Deck
Unlock for access to all 37 flashcards in this deck.
Unlock Deck
k this deck
23
City officials will conduct a study of the proportion of vehicle owners among the neighborhood residents. The study, which was held 5 years ago, provided the result of 50%. Suppose that a random sample of size n = 20 with the obtained proportion 0.45 is used to decide if the proportion has increased for the whole neighborhood. Calculate the P-value using the appropriate test to analyze these data.
A) A large-sample z test can be used. 0.04 < P-value < 0.06.
B) Both a randomization test for one proportion or a large-sample z test can be used. 0.04 < P-value < 0.06.
C) A large-sample z test, a randomization test for one proportion, or an exact binomial test for one proportion can be used. 0.06 < P-value < 0.08.
D) Both a randomization test for one proportion or an exact binomial test for one proportion can be used. 0.06 < P-value < 0.08.
E) Both a randomization test for one proportion or an exact binomial test for one proportion can be used. 0.09 < P-value < 0.1.
Unlock Deck
Unlock for access to all 37 flashcards in this deck.
Unlock Deck
k this deck
24
The local airport authority wants to investigate whether the mean of handled passengers per month has increased from 64,500 to plan maintenance works. Determine the valid null and alternative hypotheses.
A) H0: > 64,500 versus Ha: = 64,500
B) H0: µ = 64,500 versus Ha: µ > 64,500
C) H0: = 64,500 versus Ha: µ > 64,500
D) H0: µ > 64,500 versus Ha: µ = 64,500
E) H0: = 64,500 versus Ha: > 64,500
A) H0:
> 64,500 versus Ha: = 64,500B) H0: µ = 64,500 versus Ha: µ > 64,500
C) H0:
= 64,500 versus Ha: µ > 64,500D) H0: µ > 64,500 versus Ha: µ = 64,500
E) H0:
= 64,500 versus Ha: > 64,500 Unlock Deck
Unlock for access to all 37 flashcards in this deck.
Unlock Deck
k this deck
25
A cooler bag producing company claims that their coolers keep products cold for 12 hours. A test of hypotheses H0: µ = 12 versus Ha: µ < 12 is based on a sample of size n = 33. Suppose that σ is known to be 0.6 and a significance level of 0.05 will be used. Determine the power of the test and interpret the result when µ = 11.75.
A) The power of the test is 0.23, which means that 23% of the samples will result in a conclusion to reject H0: µ = 12 when the true µ is 11.75.
B) The power of the test is 0.01, which means that 1% of the samples will result in a conclusion to reject H0: µ = 12 when the true µ is 11.75.
C) The power of the test is 0.77, which means that 77% of the samples will result in a conclusion to reject H0: µ = 12 when the true µ is 11.75.
D) The power of the test is 0.99, which means that 99% of the samples will result in a conclusion to reject H0: µ = 12 when the true µ is 11.75.
E) The power of the test is 0.67, which means that 67% of the samples will result in a conclusion to reject H0: µ = 12 when the true µ is 11.75.
Unlock Deck
Unlock for access to all 37 flashcards in this deck.
Unlock Deck
k this deck
26
One of the early decisions that must be made when performing a hypothesis test is the choice of significance level. Briefly describe the considerations that go into making this decision.
Unlock Deck
Unlock for access to all 37 flashcards in this deck.
Unlock Deck
k this deck
27
Researchers study how the global warming affects the sea level. They wonder whether the mean of yearly differences of the sea level has increased from 4.4 mm using the level of significance α = 0.05. What does the level of significance mean in the context of the study?
A) The probability of a decision that the mean of differences would be less than 4.4 mm, when in fact the mean is still 4.4 mm.
B) The probability of a decision that the mean of differences would stay the same, when in fact it would increase.
C) The probability of a decision that the mean of differences would be greater than 4.4 mm, no matter whether it would increase in fact or not.
D) The probability of a decision that the mean of differences would stay the same, no matter whether it would increase in fact or not.
E) The probability of a decision that the mean of differences would be greater than 4.4 mm, when in fact it is still the same.
Unlock Deck
Unlock for access to all 37 flashcards in this deck.
Unlock Deck
k this deck
28
A hypothesis test for a population mean uses t statistic, when the population standard deviation σ is known.
Unlock Deck
Unlock for access to all 37 flashcards in this deck.
Unlock Deck
k this deck
29
Select the correct statement about the test power.
A) When Ha is false, power = 1 - β.
B) When H0 is true, power = 1 - α.
C) When H0 is false, power = 1 - β.
D) When H0 is false, power = 1 - α.
E) When H0 is true, power = 1 - β.
A) When Ha is false, power = 1 - β.
B) When H0 is true, power = 1 - α.
C) When H0 is false, power = 1 - β.
D) When H0 is false, power = 1 - α.
E) When H0 is true, power = 1 - β.
Unlock Deck
Unlock for access to all 37 flashcards in this deck.
Unlock Deck
k this deck
30
A journal article summarizes findings of a study on the effect of color on perception of temperature. The article states that experiments involving 32 participants showed an insignificant difference in the effect of orange and violet on subjective feeling of cold. On average, it was 0.3° warmer in the orange room than in the violet one, when participants started to complain about being cold. The sample standard deviation of the differences was s = 0.7. Does this provide convincing evidence that there is no significant difference in the effect of orange and violet on subjective feeling of cold in general? Test the relevant hypotheses using a α = 0.05.
A) P-value < 0.05, there is convincing evidence that there is no significant difference in the effect of orange and violet on subjective feeling of cold in general.
B) The P-value is not much greater than 0.05. Thus, the conclusion in the article is correct.
C) P-value > 0.05, there is convincing evidence that there is no significant difference in the effect of orange and violet on subjective feeling of cold in general.
D) P-value < 0.05, there is no convincing evidence that there is no significant difference in the effect of orange and violet on subjective feeling of cold in general. But the mean difference is too small to have a practical importance.
E) There is no enough information to make a conclusion.
Unlock Deck
Unlock for access to all 37 flashcards in this deck.
Unlock Deck
k this deck
31
The average wingspan of a crowned eagle is supposed to be 40 in. A random sample of 31 crowned eagles raised in captivity gave the following results: = 39.5, s = 1.8. Do the data indicate that the wingspan of captive eagles is less than that of those that live in the wild? Use the significance level α = 0.05.
A) P-value < α, thus the null hypothesis is rejected. There is convincing evidence that the wingspan of captive eagles is less than that of those that live in the wild.
B) P-value > α, thus the null hypothesis is rejected. There is convincing evidence that the wingspan of captive eagles is less than that of those that live in the wild.
C) P-value < α, thus the null hypothesis is not rejected. There is no sufficient evidence to conclude that the wingspan of captive eagles is less than that of those that live in the wild.
D) P-value > α, thus the null hypothesis is not rejected. There is no sufficient evidence to conclude that the wingspan of captive eagles is less than that of those that live in the wild.
= 39.5, s = 1.8. Do the data indicate that the wingspan of captive eagles is less than that of those that live in the wild? Use the significance level α = 0.05.A) P-value < α, thus the null hypothesis is rejected. There is convincing evidence that the wingspan of captive eagles is less than that of those that live in the wild.
B) P-value > α, thus the null hypothesis is rejected. There is convincing evidence that the wingspan of captive eagles is less than that of those that live in the wild.
C) P-value < α, thus the null hypothesis is not rejected. There is no sufficient evidence to conclude that the wingspan of captive eagles is less than that of those that live in the wild.
D) P-value > α, thus the null hypothesis is not rejected. There is no sufficient evidence to conclude that the wingspan of captive eagles is less than that of those that live in the wild.
Unlock Deck
Unlock for access to all 37 flashcards in this deck.
Unlock Deck
k this deck
32
According to a survey conducted 5 years ago, the proportion of left-handed students at a university was 0.12. Has the proportion increased over the years? A random sample of 50 students was chosen, 9 of whom were left-handed. Use the output from the Shiny app "Randomization Test for One Proportion" to complete an appropriate hypothesis test. Interpret the obtained results, using a significance level of 0.1.
A) There is convincing evidence that the proportion of left-handed students has decreased.
B) There is convincing evidence that the proportion of left-handed students has increased.
C) There is no convincing evidence that the proportion of left-handed students has increased.
D) The proportion of left-handed students has certainly remained the same.
E) The sample is too small to make a conclusion.
Interpret the obtained results, using a significance level of 0.1. A) There is convincing evidence that the proportion of left-handed students has decreased.
B) There is convincing evidence that the proportion of left-handed students has increased.
C) There is no convincing evidence that the proportion of left-handed students has increased.
D) The proportion of left-handed students has certainly remained the same.
E) The sample is too small to make a conclusion.
Unlock Deck
Unlock for access to all 37 flashcards in this deck.
Unlock Deck
k this deck
33
When performing tests of hypotheses, there are assumptions that must be met in order for the test to be appropriate. For the test of a hypothesis about a population proportion, describe how you would check the assumptions.
Unlock Deck
Unlock for access to all 37 flashcards in this deck.
Unlock Deck
k this deck
34
Determine the P-value in a hypothesis test for a population mean with H0: µ = hypothesized value and Ha: µ > hypothesized value.
A) area to the right of the calculated t under the t curve with df = n − 2
B) area to the left of the calculated t under the t curve with df = n − 1
C) area to the right of the calculated t under the t curve with df = n − 1
D) area to the left of the calculated t under the t curve with df = n − 2
E) area to the right of the calculated t under the t curve with df = n
Unlock Deck
Unlock for access to all 37 flashcards in this deck.
Unlock Deck
k this deck
35
The university conducts a study designed to find out the proportion of students who have conversational fluency in two or more foreign languages. The previous study provided the result of 7%. The test is carried out using data from a random sample of n = 72. In this sample, the number of students who speak two or more foreign languages is 10. Complete an appropriate hypothesis test with α = 0.05 and make a conclusion using the output from the Shiny app "Exact Binomial Test for One Proportion".
A) The proportion of students who speak two or more foreign languages has certainly remained the same.
B) There is convincing evidence that the proportion of students who speak two or more foreign languages has decreased.
C) There is no convincing evidence that the proportion of students who speak two or more foreign languages has increased.
D) There is convincing evidence that the proportion of students who speak two or more foreign languages has increased.
E) The sample is too small to make a conclusion.
Unlock Deck
Unlock for access to all 37 flashcards in this deck.
Unlock Deck
k this deck
36
A company provides portable walkie-talkies to construction crews. Their batteries last, on average, 55 hours of continuous use. The purchasing manager receives a brochure advertising a new brand of batteries with a lower price, but suspects that the lifetime of the batteries may be shorter than the brand currently in use. To test this, the new brand is installed in 8 randomly selected radios. Here are the results for the lifetime of the batteries (in hours): 45 52 56 55 51 57 48 52 Is there sufficient evidence to conclude that the purchasing manager is correct in his conjecture that the new brand has a shorter average lifetime?
Unlock Deck
Unlock for access to all 37 flashcards in this deck.
Unlock Deck
k this deck
37
The average sleeping time required for teenagers who experience major physical exertion is about 8 hours. Do the members of the school sport teams sleep enough? Sleeping time for a random sample of 16 sport team members was obtained. Which test is appropriate for this sample?
A) A one-sample t test.
B) A large-sample z test and a randomization test for a population mean.
C) A large-sample z test.
D) A randomization test for a population mean and a one-sample t test.
E) A randomization test for a population mean.
Which test is appropriate for this sample? A) A one-sample t test.
B) A large-sample z test and a randomization test for a population mean.
C) A large-sample z test.
D) A randomization test for a population mean and a one-sample t test.
E) A randomization test for a population mean.
Unlock Deck
Unlock for access to all 37 flashcards in this deck.
Unlock Deck
k this deck
Unlock Deck
Unlock for access to all 37 flashcards in this deck.


