Deck 1: What Is Statistics
Full screen (f)
Question
Question
Descriptive statistics deals with methods of: 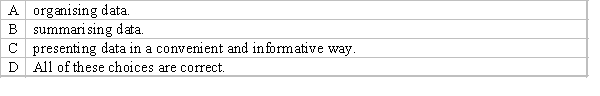
Question
A summary measure that is computed from a population is called: 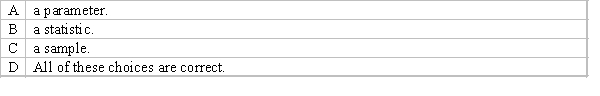
Question
You ask five of your classmates about their height. On the basis of this information, you state that the average height of the students in the sample is 170 cm. Which of the following is this an example of? 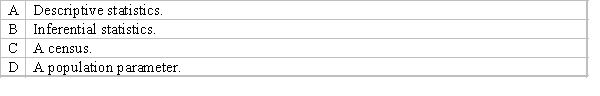
Question
Question
Question
Question
Question
Which of the following best describes the data that is collected in a statistical study for only a portion or subset of all elements of interest? 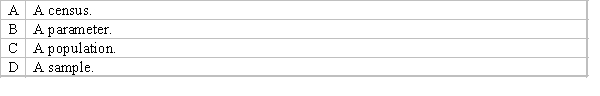
Question
A politician who is running for the office of premier in a state with 1 million registered voters commissions a survey. In the survey, 52% of the 3000 registered voters interviewed say they plan to vote for her. The sample is the: 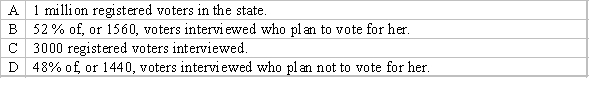
Question
Question
Which of the following is the goal of descriptive statistics? 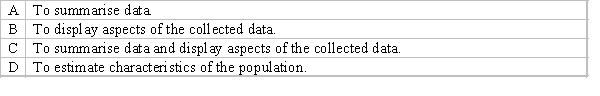
Question
A summary measure that is computed from a sample to describe a characteristic of the population is called: 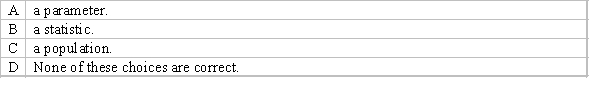
Question
Question
Question

Unlock Deck
Sign up to unlock the cards in this deck!
Unlock Deck
Unlock Deck
1/16
Play
Full screen (f)
Deck 1: What Is Statistics
1
A local cable TV system using a sample of 500 subscribers finds that 40% of these subscribers watch a premium channel at least once per day. This is an example of statistical inference as opposed to
descriptive statistics.
descriptive statistics.
False
2
Descriptive statistics deals with methods of:
D
3
A summary measure that is computed from a population is called:
A
4
You ask five of your classmates about their height. On the basis of this information, you state that the average height of the students in the sample is 170 cm. Which of the following is this an example of?
Unlock Deck
Unlock for access to all 16 flashcards in this deck.
Unlock Deck
k this deck
5
Consider the population of all pencil manufacturers in the world. Describe any four examples of possible samples that could be taken from this population.
Unlock Deck
Unlock for access to all 16 flashcards in this deck.
Unlock Deck
k this deck
6
Identify each of the following studies as using either descriptive statistics or inferential statistics.
A. Calculating the relative frequency of Holden Commodore SV6 cars passing by your house
between 7pm and 8pm this evening.
B. Estimating the proportion of households in Melbourne that have at least two dependents, from a random sample of 100 Melbournian households.
C. Measuring the fuel efficiency of five brand new Holden Commodore SV6 cars in order to find out whether the average fuel consumption of this make and model is better than 10L/100km.
D. Calculating the proportion of female students in a business statistics class.
E. Estimating the average age of students at La Trobe University from a sample of 200 randomly
selected students.
Unlock Deck
Unlock for access to all 16 flashcards in this deck.
Unlock Deck
k this deck
7
A businessman who is running for a vacant city council seat with 20 000 registered voters conducts a survey. In the survey, 200 of the 300 registered voters interviewed say they plan to vote for him.
A. What proportion of the respondents plans to vote for this businessman?
B. What is the population of interest?
C. What is the sample?
D. Is your answer in part (a) above a parameter or a statistic?
A. What proportion of the respondents plans to vote for this businessman?
B. What is the population of interest?
C. What is the sample?
D. Is your answer in part (a) above a parameter or a statistic?
Unlock Deck
Unlock for access to all 16 flashcards in this deck.
Unlock Deck
k this deck
8
The significance level is the relative frequency of a wrong conclusion.
Unlock Deck
Unlock for access to all 16 flashcards in this deck.
Unlock Deck
k this deck
9
Which of the following best describes the data that is collected in a statistical study for only a portion or subset of all elements of interest?
Unlock Deck
Unlock for access to all 16 flashcards in this deck.
Unlock Deck
k this deck
10
A politician who is running for the office of premier in a state with 1 million registered voters commissions a survey. In the survey, 52% of the 3000 registered voters interviewed say they plan to vote for her. The sample is the:
Unlock Deck
Unlock for access to all 16 flashcards in this deck.
Unlock Deck
k this deck
11
A summary measure that is computed from a population is called a population parameter.
Unlock Deck
Unlock for access to all 16 flashcards in this deck.
Unlock Deck
k this deck
12
Which of the following is the goal of descriptive statistics?
Unlock Deck
Unlock for access to all 16 flashcards in this deck.
Unlock Deck
k this deck
13
A summary measure that is computed from a sample to describe a characteristic of the population is called:
Unlock Deck
Unlock for access to all 16 flashcards in this deck.
Unlock Deck
k this deck
14
Statistical inference is the process of making an estimate, prediction or decision about a population, based on sample data.
Unlock Deck
Unlock for access to all 16 flashcards in this deck.
Unlock Deck
k this deck
15
A summary measure that is computed from a sample to describe a characteristic of the population is called a statistic.
Unlock Deck
Unlock for access to all 16 flashcards in this deck.
Unlock Deck
k this deck
16
Which of the following statements is true?
Unlock Deck
Unlock for access to all 16 flashcards in this deck.
Unlock Deck
k this deck
Unlock Deck
Unlock for access to all 16 flashcards in this deck.


