Deck 3: The Economic Problem
Full screen (f)
Question
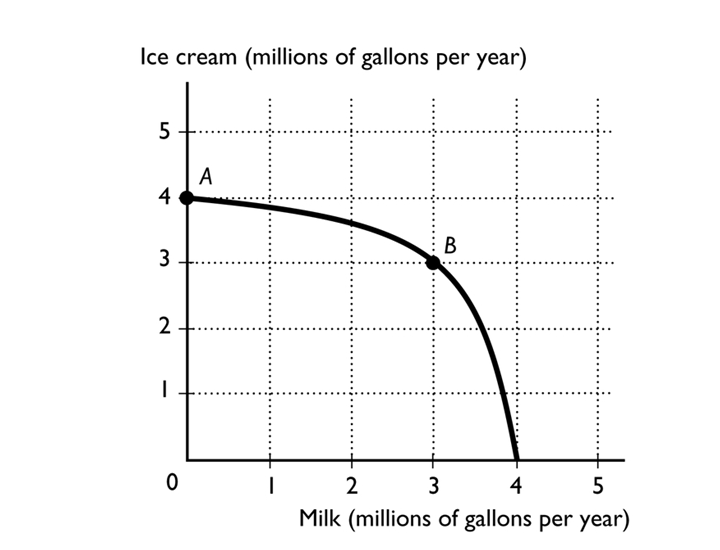
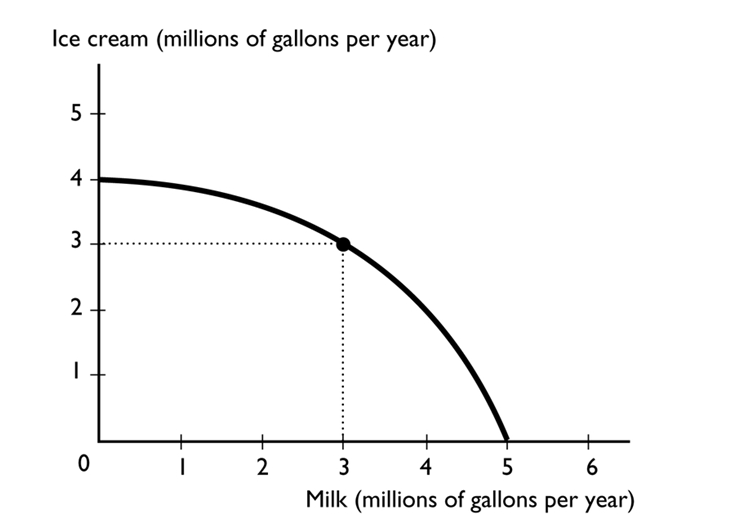
The figure above shows the production possibilities frontier for a country. The opportunity cost of a gallon of milk between combination point A and B is
A)3 gallons of ice cream for a gallon of milk.
B)1/3 of a gallon of ice cream for a gallon of milk.
C)4 gallons of ice cream for a gallon of milk.
D)1 gallon of ice cream for a gallon of milk.
E)zero because at point A zero milk is being produced.
Question
-
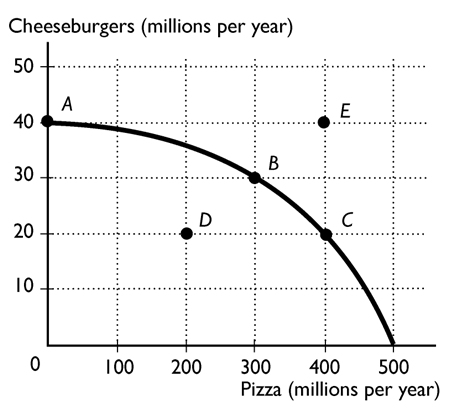
The above figure shows the production possibility frontier for an economy. The point or points that are attainable and production efficient are
A)points A and D.
B)points A, B, C, and D.
C)points A, B, and C.
D)point E.
E)points B and C.
Question
Question
Question
Question
Question
-
The figure above shows the production possibilities frontier for a country. A combination of 2 Million gallons of milk and 2 million gallons of ice cream is
A)unattainable.
B)attainable but more than production efficient.
C)attainable and production inefficient.
D)attainable and production efficient.
E)More information is needed to determine if the point is attainable or not.
Question
Question
Question
-
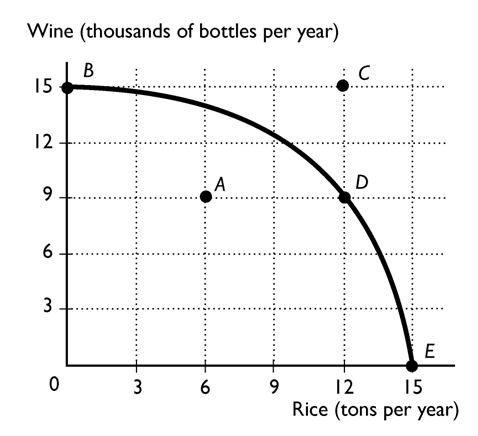
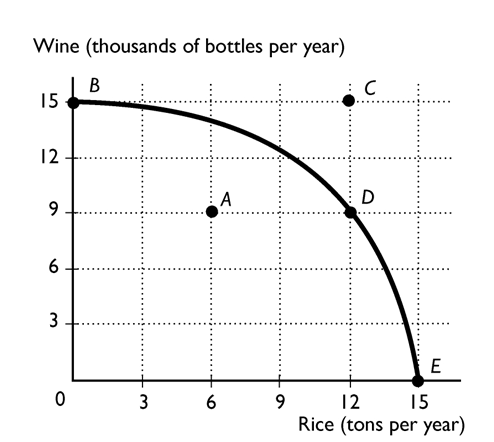
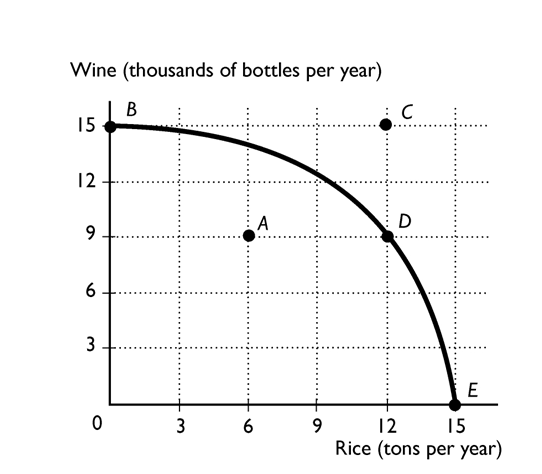
The above figure shows the production possibility frontier for a country. What is the opportunity cost to move from point D to point B?
A)6 thousand bottles of wine
B)9 thousand bottles of wine
C)15 thousand bottles of wine
D)12 tons of rice
E)Nothing, it is a free lunch
Question
Question
Question
Question
Question
Question
Question
Question
Question
-
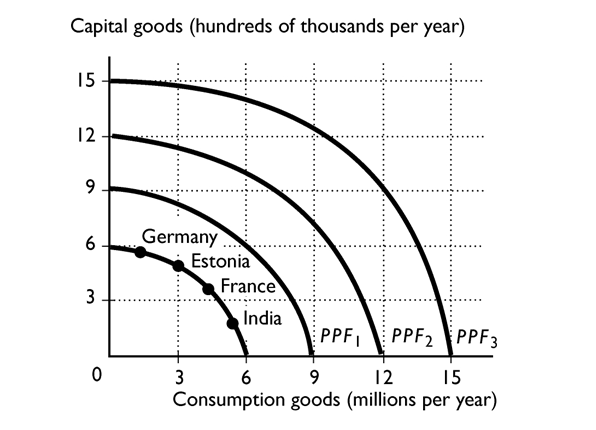
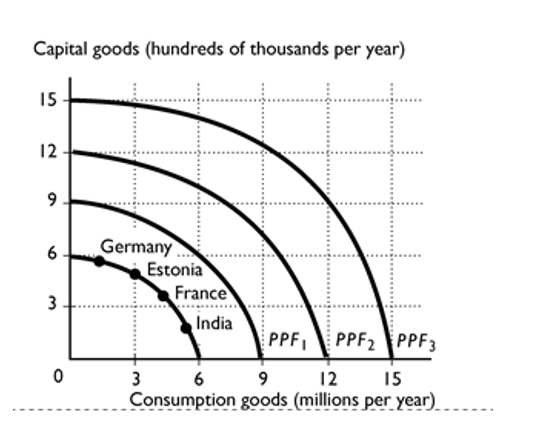
Suppose that Germany, France, Estonia, and India all have the same production possibilities, illustrated in the figure above. Based on the production points in the figure, Germany is most likely to expand its PPF to
A)PPF2.
B)PPF1. or PPF2.
C)PPF3 or PPF2.
D)PPF3.
E)PPF1.
Question
Question
Question
Question
Question
Question
Question
Question
Question
Question
Question
Question
Question
Question
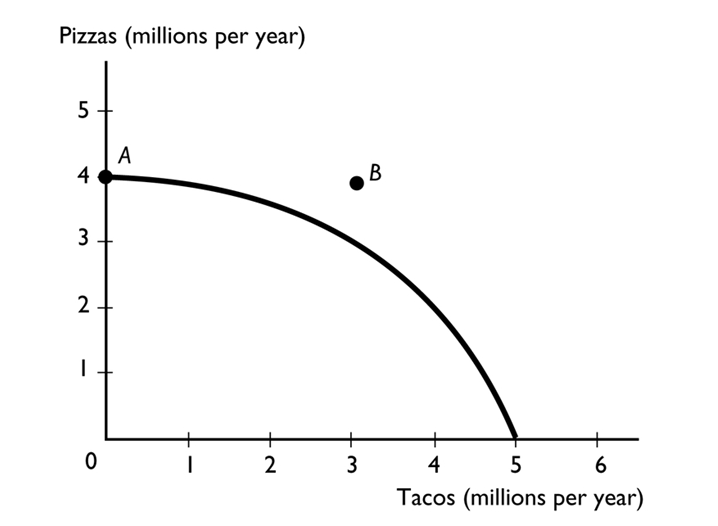
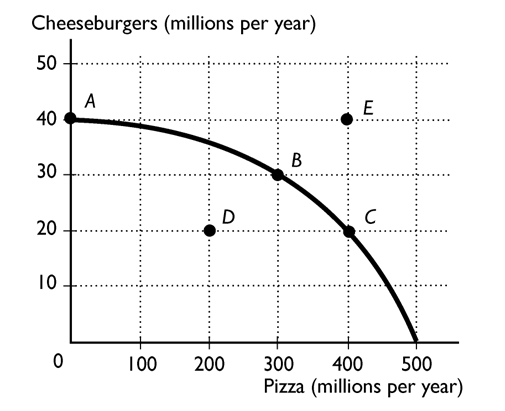
The figure above shows a nation's production possibilities frontier. In the figure, point A shows
A)an attainable point with unemployed resources.
B)an unattainable point.
C)the minimum quantity of pizza that the society must produce.
D)the maximum quantity of pizza that can be produced.
E)More information is needed to determine which of the above answers is correct.
Question
-
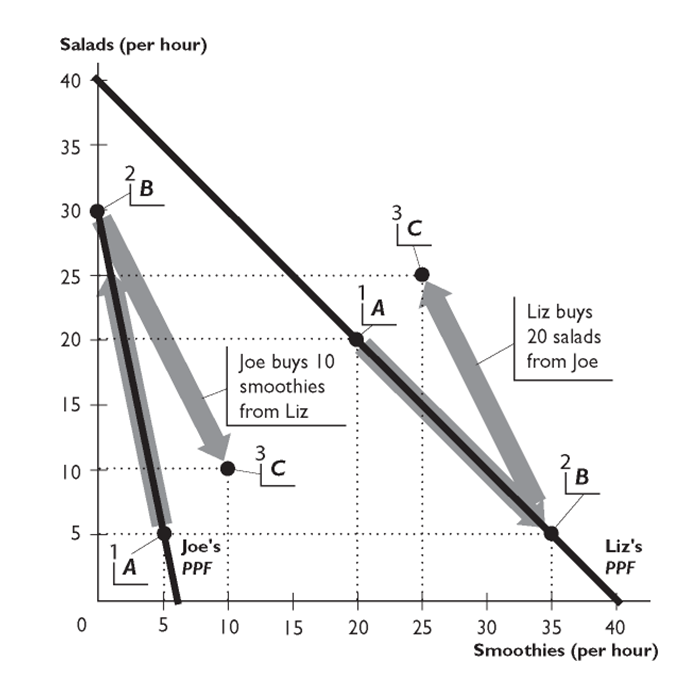
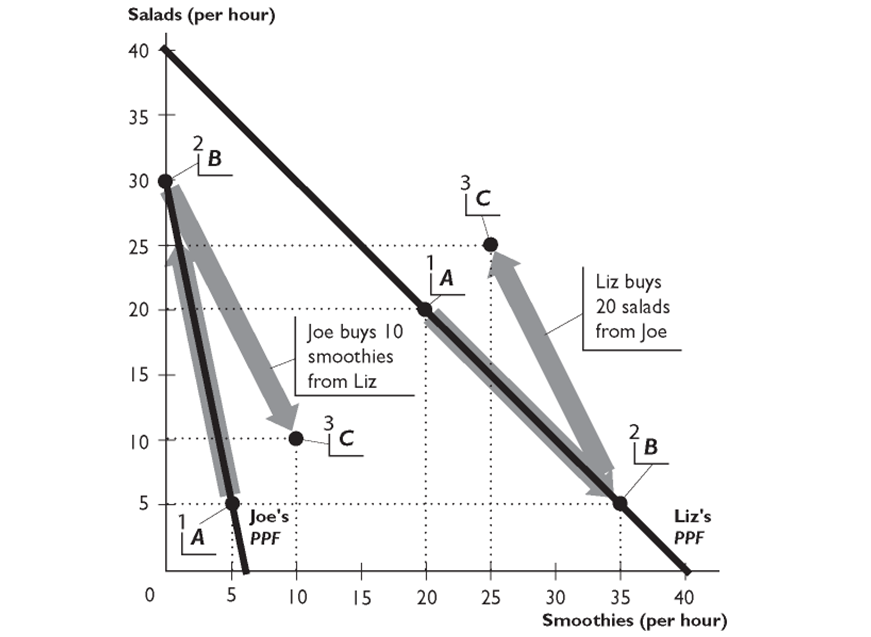
The figure above show Liz's and Joe's production possibilities for Salads and Smoothies.
Given the information in the figure above, Liz-------------------- benefit from trade with Joe because--------------------
.
A)cannot; she has an absolute advantage in both goods
B)can; Joe is more productive in producing one of the goods
C)can; each of them has an absolute advantage in one of the goods
D)can; each of them has a comparative advantage in one of the goods
E)cannot; she has a comparative advantage in both goods
Question
-
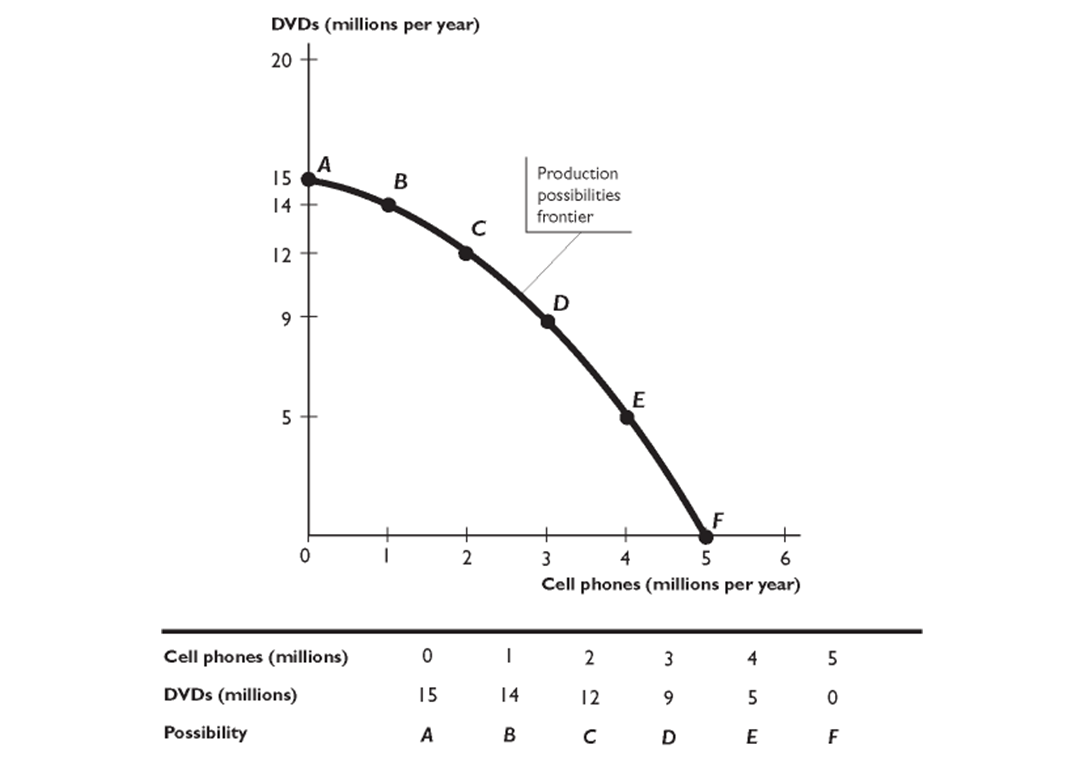
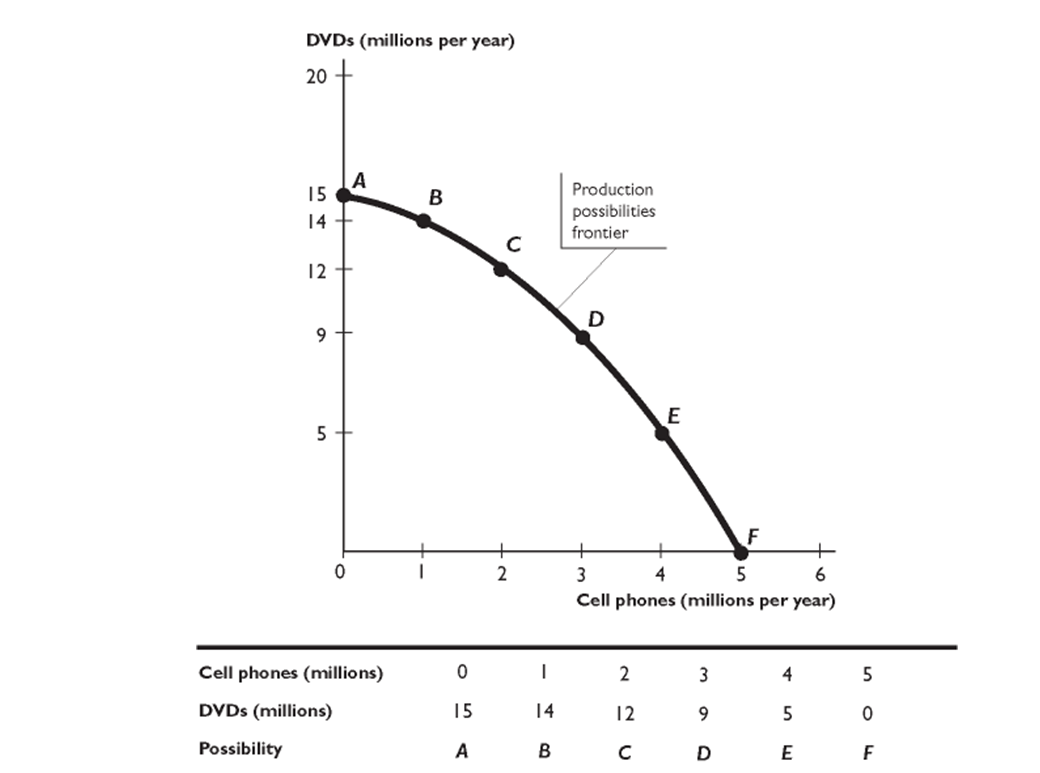
The figure above shows a production possibilities frontier. In the figure, the economy faces a tradeoff when -------------cell phones and -------------DVDs. are produced.
A)4.5 million; no
B)3 million; 9 million
C)5 million; 15 million
D)3 million; 8 million
E)2 million; 9 million
Question
Question
Question
-
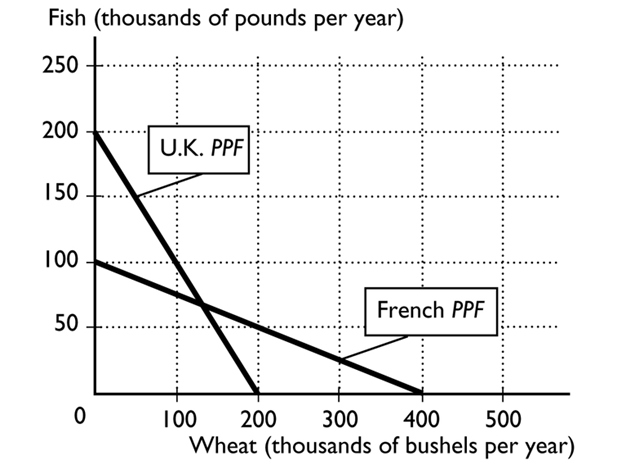
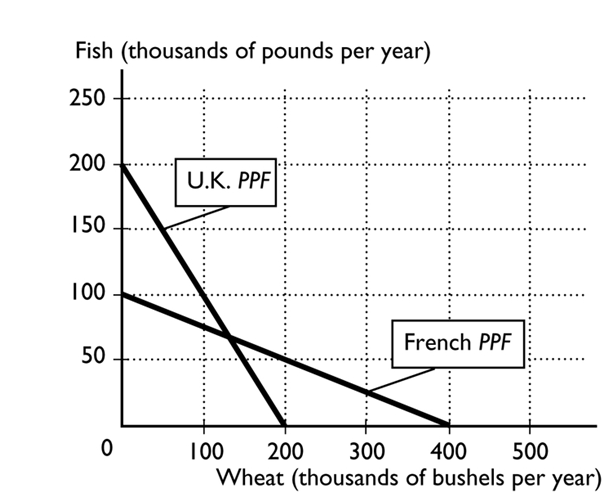
The figure above shows the production possibilities frontiers for the United Kingdom and France. What is the opportunity cost of one bushel of wheat for the United Kingdom?
A)1/2 of a pound of fish
B)1 pound of fish
C)200 pounds of fish
D)1/4 of a pound of fish
E)2 pounds of fish
Question
Question
Question
-
The above figure shows the production possibility frontier for a country. Suppose the country is producing at point A. What would be the opportunity cost to increase the production of rice to 12 tons?
A)15 thousand bottles of wine
B)6 tons of rice
C)9 thousand bottles of wine
D)6 thousand bottles of wine
E)Nothing, it is a free lunch
Question
-
The above figure shows the production possibility frontier for an economy. The point or points that are not attainable are
A)point E.
B)points B and C.
C)points A, B, C, and D.
D)points A, B, and C.
E)points A and D.
Question
-
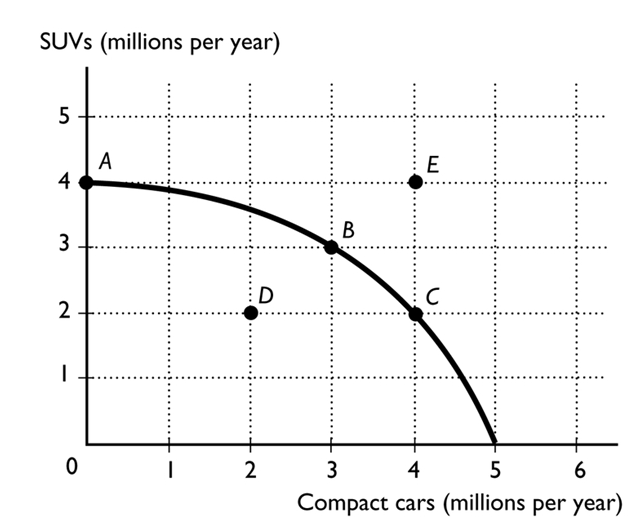
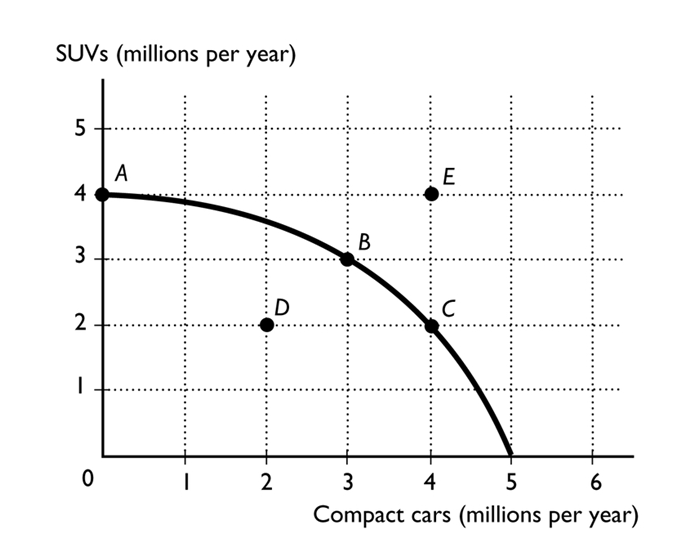
The figure above shows the production possibilities frontier for a country. In order for it to move from producing at point A to producing at point B, the country would need to incur an opportunity cost of
A)1 million SUVs.
B)3 million compact cars.
C)3 million SUVs.
D)4 million SUVs.
E)0 because the gain in compact cars exceeds the loss in SUVs.
Question
Question
Question
-
The figure above show Liz's and Joe's production possibilities for Salads and Smoothies.
Liz has a comparative advantage in--------------------because--------------------
A)smoothies; she can produce more smoothies per hour than Joe can
B)smoothies; her opportunity cost of producing smoothies is lower than Joe's
C)salads; she can produce more salads per hour than Joe can
D)both goods; she can produce more of both goods per hour than Joe can
E)salads; her opportunity cost of producing salads is lower than Joe's
Question
Question
-
The above figure shows the production possibility frontier for a country. What is the opportunity cost to move from point D to point E?
A)6 tons of rice
B)15 thousand bottles of wine
C)6 thousand bottles of wine
D)9 thousand bottles of wine
E)Nothing, it is a free lunch
Question
Question
-
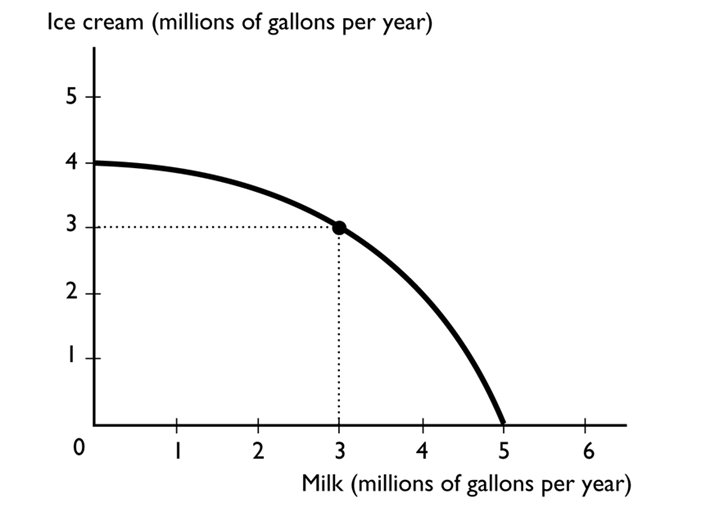
The figure above shows the production possibilities frontier for a country. A combination of 3 million gallons of milk and 3 million gallons of ice cream is
A)attainable and production efficient.
B)attainable and production inefficient.
C)unattainable.
D)unattainable and production efficient.
E)More information is needed to determine if the point is attainable or not.
Question
-
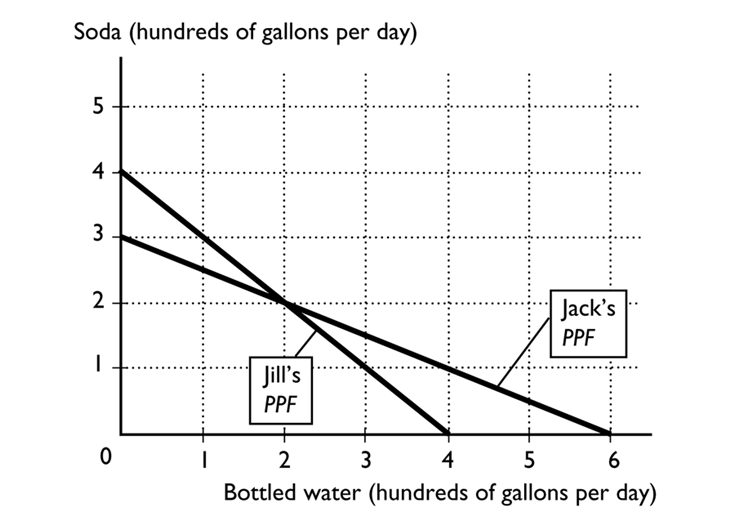
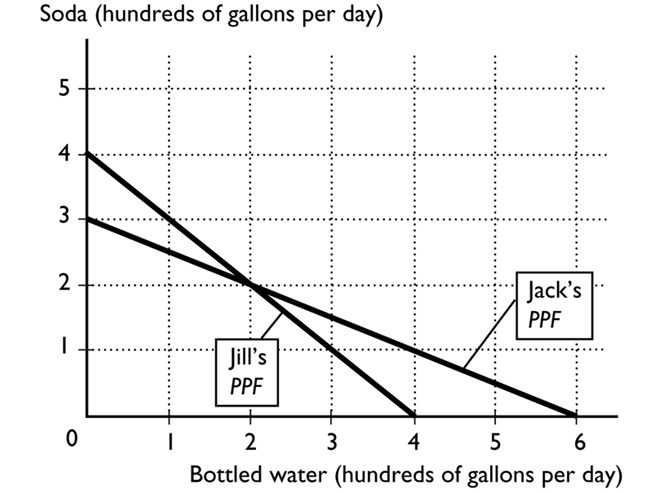
In the above figure, Jill's opportunity cost of producing 1 gallon of soda is --------------------of bottled water.
A)1/4 of a gallon
B)1 gallon
C)1/2 of a gallon
D)4 gallons
E)2 gallons
Question
Question
Question
Question
-
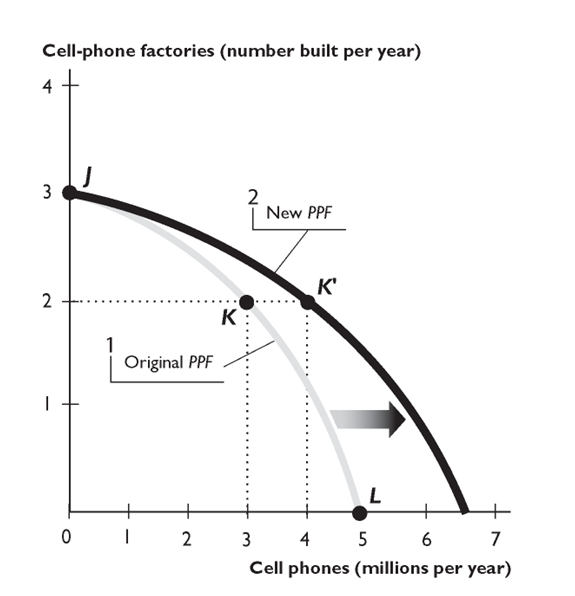
The figure above shows how the PPF for cell phones and new cell-phone factories can expand. In the figure, if the economy chose the point on this year's PPF that is above point K, the next year's PPF would
A)shift outward along the horizontal axis farther than the new PPF shown in the figure.
B)shift inward along the horizontal axis.
C)shift outward along the vertical axis, not along the horizontal axis.
D)shift outward along the horizontal axis, but not as far as the new PPF shown in the figure.
E)shift inward along the vertical axis.
Question
Question
Question
Question
Question
Question
-
The above figure shows the production possibility frontier for a country. Suppose the country is producing at point A. What is the opportunity cost of increasing the production of rice to 12 tons?
A)15 thousand bottles of wine
B)12 tons of rice
C)9 thousand bottles of wine
D)6 thousand bottles of wine
E)Nothing, it is a free lunch
Question
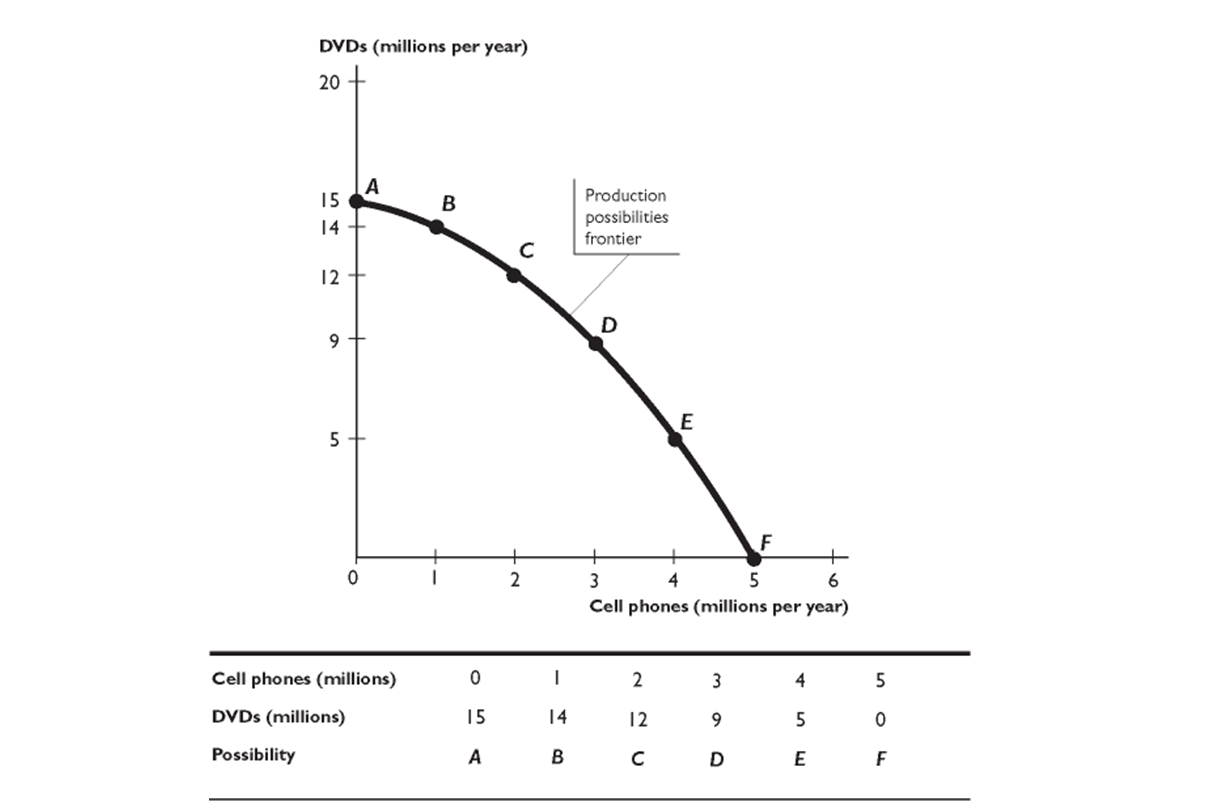
The figure above shows a production possibilities frontier. In the figure, when the economy moves from point E to point D, what is the opportunity cost of a DVD?
A)zero
B)1 cell phone
C)0.25 cell phones
D)4 cell phones
E)0.5 cell phones
Question
-
The above figure shows the production possibility frontier for a country. Suppose the country is producing at point D. What would be the opportunity cost to move to point C?
A)6 thousand bottles of wine
B)12 tons of rice
C)15 thousand bottles of wine
D)Nothing, it is a free lunch
E)This movement is not possible without economic growth.
Question
-
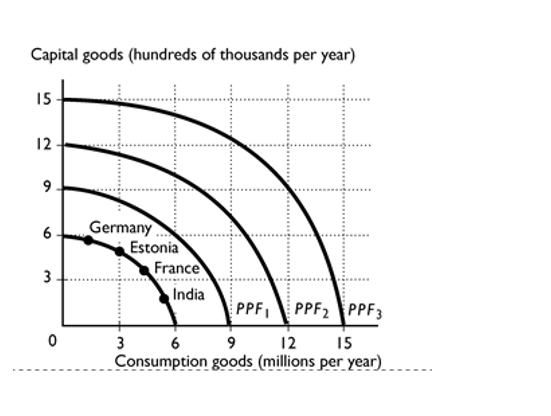
Suppose India and France have the same PPF, shown in the figure above. Based on their current production points, India's most likely future PPF is --------------------and France's most likely future PPF is--------------------
.
A)PPF1; PPF1
B)PPF1; PPF2
C)PPF0; PPF0
D)PPF2; PPF2
E)PPF2; PPF1
Question
-
The figure above shows the production possibilities frontier for a country. In order for it to produce at point E, the
A)production of SUVs would need to decrease.
B)country would need to use its resources more efficiently.
C)production of compact cars would need to decrease.
D)country would need to determine that compact cars and SUVs are equally important to it.
E)country would need to acquire more resources and/or more advanced technology.
Question
-
The figure above shows the production possibilities frontiers for the United Kingdom and France. If the United Kingdom and France specialize and engage in trade, the United Kingdom will produce--------------------
And France will produce-------------------- .
A)fish; fish
B)both wheat and fish; both wheat and fish
C)wheat; wheat
D)wheat; fish
E)fish; wheat
Question
Question
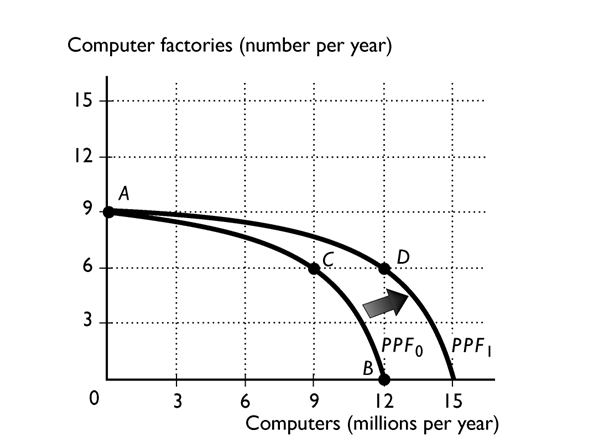
The above figure shows the PPF for a country that produces computers and computer factories. The nation's production possibilities frontier is PPF0 . At which of the following production points would the economy grow most rapidly?
A)Point A
B)Point B
C)Point C
D)It makes no difference among the three points because they are all production efficient.
E)More information is needed to answer the question.
Question
Question
Question
-
In the above figure, Jill's opportunity cost of producing 1 gallon of bottled water is --------------------of soda.
A)4 gallons
B)1/2 of a gallon
C)1/4 of a gallon
D)2 gallons
E)1 gallon
Question
-
The figure above shows a production possibilities frontier. In the figure, when the economy moves from point C to point B, what is the opportunity cost of a DVD?
A)2 million cell phones
B)2 cell phones
C)0.5 cell phones
D)zero
E)0.5 million cell phones
Question
Question
Question
Question
Question
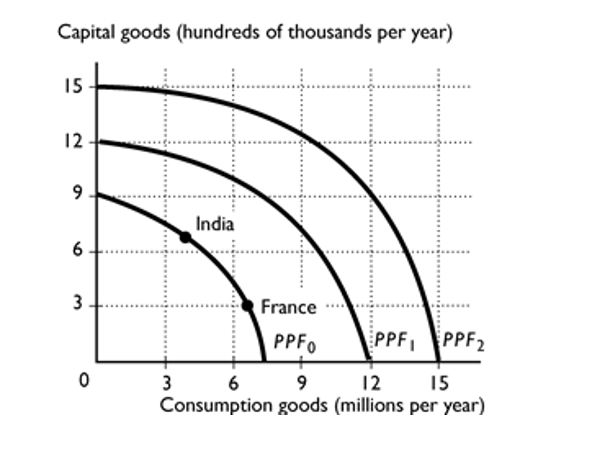
Suppose India and France have the same PPF, shown in the figure above. Based on their current production points, which is France's most likely future PPF?
A)PPF0.
B)PPF1.
C)PPF2.
D)Either PPF0 or PPF1.
E)None of the above because economic growth will not happen in India.
Question
Question
Question

Unlock Deck
Sign up to unlock the cards in this deck!
Unlock Deck
Unlock Deck
1/99
Play
Full screen (f)
Deck 3: The Economic Problem
1
The figure above shows the production possibilities frontier for a country. The opportunity cost of a gallon of milk between combination point A and B is
A)3 gallons of ice cream for a gallon of milk.
B)1/3 of a gallon of ice cream for a gallon of milk.
C)4 gallons of ice cream for a gallon of milk.
D)1 gallon of ice cream for a gallon of milk.
E)zero because at point A zero milk is being produced.
1/3 of a gallon of ice cream for a gallon of milk.
2
-
The above figure shows the production possibility frontier for an economy. The point or points that are attainable and production efficient are
A)points A and D.
B)points A, B, C, and D.
C)points A, B, and C.
D)point E.
E)points B and C.
points A, B, and C.
3
Hank requires 1 hour to cut the grass and 3 hours to clean the house. His sister Holly requires 1 hour to cut the grass and 4 hours to clean the house. Which of the following statements is true?
A)Hank has a lower opportunity cost of cutting the grass.
B)Hank has a comparative advantage in both cutting the grass and cleaning the house.
C)Hank has an absolute advantage in both cutting the grass and cleaning the house.
D)Hank and Holly both have a comparative advantage in cutting the grass.
E)Holly has a comparative advantage in cutting the grass.
E
4
-
In the table above, Jill's opportunity cost for 1 pound of food is-------------------- and her opportunity cost for 1 pound of clothing is--------------------.
A)1/2 of a pound of clothing; 2 pounds of food
B)1 pound of food; 1 pound of clothing
C)1/3 of a pound of clothing; 3 pounds of food
D)2 pounds of clothing; 2 pounds of food
E)1 pound of clothing; 4 pounds of food
Unlock Deck
Unlock for access to all 99 flashcards in this deck.
Unlock Deck
k this deck
5
When a country's production possibilities frontier shifts outward over time, the country is experiencing
A)no opportunity cost.
B)higher unemployment of resources.
C)economic growth.
D)a decrease in unemployment of resources.
E)an end to opportunity cost.
A)no opportunity cost.
B)higher unemployment of resources.
C)economic growth.
D)a decrease in unemployment of resources.
E)an end to opportunity cost.
Unlock Deck
Unlock for access to all 99 flashcards in this deck.
Unlock Deck
k this deck
6
Moving between two points on a PPF, a country gains 8 desktop computers and forgoes 4 laptop Computers. The opportunity cost of 1 desktop computer is
A)8 desktops.
B)1/2 of a laptop.
C)2 laptops.
D)1 desktop.
E)4 laptops.
A)8 desktops.
B)1/2 of a laptop.
C)2 laptops.
D)1 desktop.
E)4 laptops.
Unlock Deck
Unlock for access to all 99 flashcards in this deck.
Unlock Deck
k this deck
7
-
The figure above shows the production possibilities frontier for a country. A combination of 2 Million gallons of milk and 2 million gallons of ice cream is
A)unattainable.
B)attainable but more than production efficient.
C)attainable and production inefficient.
D)attainable and production efficient.
E)More information is needed to determine if the point is attainable or not.
Unlock Deck
Unlock for access to all 99 flashcards in this deck.
Unlock Deck
k this deck
8
If John can produce 10 chairs or 20 lamps during a week while Mary can produce 12 chairs or 22 lamps in the same time, who has the absolute advantage in producing each good?
A)John in producing chairs, Mary in producing lamps
B)John in producing both goods
C)Mary in producing both goods
D)Mary in producing chairs, John in producing lamps
E)Both Mary and John in both goods
A)John in producing chairs, Mary in producing lamps
B)John in producing both goods
C)Mary in producing both goods
D)Mary in producing chairs, John in producing lamps
E)Both Mary and John in both goods
Unlock Deck
Unlock for access to all 99 flashcards in this deck.
Unlock Deck
k this deck
9
To find the opportunity cost of producing one more unit of any product while on the production possibilities frontier requires
A)subtracting the change in the product whose production increased from the change in the product whose production decreased.
B)dividing the amount of the product forgone by the amount of the product gained.
C)setting the change in one product equal to the change in the other product.
D)setting the amounts of the two products equal to each other.
E)None of these describe how to find opportunity cost.
Unlock Deck
Unlock for access to all 99 flashcards in this deck.
Unlock Deck
k this deck
10
-
The above figure shows the production possibility frontier for a country. What is the opportunity cost to move from point D to point B?
A)6 thousand bottles of wine
B)9 thousand bottles of wine
C)15 thousand bottles of wine
D)12 tons of rice
E)Nothing, it is a free lunch
Unlock Deck
Unlock for access to all 99 flashcards in this deck.
Unlock Deck
k this deck
11
When a person has a comparative advantage in producing a good or service, the person has
A)an increasing marginal benefit in producing the good.
B)a decreasing opportunity cost in producing that product.
C)a constant opportunity cost in producing that product.
D)a higher opportunity cost in producing that product than someone else.
E)a lower opportunity cost in producing that product than someone else.
Unlock Deck
Unlock for access to all 99 flashcards in this deck.
Unlock Deck
k this deck
12
If an economy cannot produce more of one good without producing less of another good, this implies that which of the following has been achieved?
A)maximum marginal benefit
B)allocative efficiency
C)production efficiency
D)PPF efficiency
E)minimum marginal cost
A)maximum marginal benefit
B)allocative efficiency
C)production efficiency
D)PPF efficiency
E)minimum marginal cost
Unlock Deck
Unlock for access to all 99 flashcards in this deck.
Unlock Deck
k this deck
13
Once you find the opportunity cost of producing one unit of a good, to find the opportunity cost of Producing the other good, you must
A)multiply by the total amount produced of the second good.
B)take the inverse.
C)do nothing because the opportunity cost for the first good is the same as the opportunity cost for the second good.
D)divide by the total amount produced of the second good.
E)None of the answers is correct.
A)multiply by the total amount produced of the second good.
B)take the inverse.
C)do nothing because the opportunity cost for the first good is the same as the opportunity cost for the second good.
D)divide by the total amount produced of the second good.
E)None of the answers is correct.
Unlock Deck
Unlock for access to all 99 flashcards in this deck.
Unlock Deck
k this deck
14
-
Huey and Steve can grow potatoes or tomatoes. The table above shows the pounds of potatoes and tomatoes Huey and Steve can grow in a week. Based on the table, Huey's opportunity cost of producing one pound of tomatoes is
A)0.66 pound of potatoes.
B)0, because he has an absolute advantage in it.
C)1.0 pound of potatoes.
D)1.5 pounds of potatoes.
E)0, because he has a comparative advantage in it.
Unlock Deck
Unlock for access to all 99 flashcards in this deck.
Unlock Deck
k this deck
15
For country North, the opportunity cost incurred when 3 tractors are produced is 21 watches. Forcountry South, the opportunity cost incurred when 5 tractors are produced is 100 watches. Which country has the comparative advantage in the production of tractors?
A)North
B)South
C)Both have the comparative advantage in the production of tractors.
D)Neither country has the comparative advantage in the production of tractors.
E)More information is needed about which country has the comparative advantage in the production of watches.
A)North
B)South
C)Both have the comparative advantage in the production of tractors.
D)Neither country has the comparative advantage in the production of tractors.
E)More information is needed about which country has the comparative advantage in the production of watches.
Unlock Deck
Unlock for access to all 99 flashcards in this deck.
Unlock Deck
k this deck
16
-
The table above gives four production possibilities for airplanes and cruise ships. In possibility A, how many resources are devoted to the production of airplanes?
A)few
B)all
C)0
D)most
E)It is impossible to tell without more information about the prices of airplanes and cruise ships.
Unlock Deck
Unlock for access to all 99 flashcards in this deck.
Unlock Deck
k this deck
17
If Country A can produce an extra plane by giving up two boats, and Country B can produce an extra plane by giving up three boats, then
A)Country A has an absolute advantage in producing planes and a comparative advantage in producing boats.
B)Country A would like to trade with B, but B cannot gain by trading with A.
C)Country A has a comparative advantage over Country B in the production of planes.
D)the two countries have no incentive to trade with one another.
E)Country B has a comparative advantage over Country A in the production of planes.
Unlock Deck
Unlock for access to all 99 flashcards in this deck.
Unlock Deck
k this deck
18
-
The above figure shows the production possibility frontier for an economy. The point or points that are attainable and production efficient are
A)points A and D.
B)points A, B, C, and D.
C)points A, B, and C.
D)point E.
E)points B and C.
Unlock Deck
Unlock for access to all 99 flashcards in this deck.
Unlock Deck
k this deck
19
-
Suppose that Germany, France, Estonia, and India all have the same production possibilities, illustrated in the figure above. Based on the production points in the figure, Germany is most likely to expand its PPF to
A)PPF2.
B)PPF1. or PPF2.
C)PPF3 or PPF2.
D)PPF3.
E)PPF1.
Unlock Deck
Unlock for access to all 99 flashcards in this deck.
Unlock Deck
k this deck
20
Suppose a country operates on its production possibility frontier when it produces 1000 books and 1000 tables. The combination of -------------------- reflects --------------------
A)500 books and 500 tables; an attainable and efficient point.
B)1000 books and 1500 tables; a free lunch.
C)1000 books and 500 tables; an efficient point.
D)500 books and 1000 tables; an inefficient but attainable point.
E)1000 books and 1000 tables; a free lunch.
A)500 books and 500 tables; an attainable and efficient point.
B)1000 books and 1500 tables; a free lunch.
C)1000 books and 500 tables; an efficient point.
D)500 books and 1000 tables; an inefficient but attainable point.
E)1000 books and 1000 tables; a free lunch.
Unlock Deck
Unlock for access to all 99 flashcards in this deck.
Unlock Deck
k this deck
21
To increase its economic growth, a nation should
A)increase current consumption.
B)encourage spending on goods and services.
C)eliminate expenditure on capital goods.
D)encourage education because that increases the quality of labor.
E)limit the number of people in college because they produce nothing.
A)increase current consumption.
B)encourage spending on goods and services.
C)eliminate expenditure on capital goods.
D)encourage education because that increases the quality of labor.
E)limit the number of people in college because they produce nothing.
Unlock Deck
Unlock for access to all 99 flashcards in this deck.
Unlock Deck
k this deck
22
Economic growth depends upon which of the following?
i. Increasing the quantity of labor
ii. Lowering the prices of goods and services
iii. Advancing technology
A)iii only
B)ii only
C)i and iii
D)i only
E)i, ii, and iii
i. Increasing the quantity of labor
ii. Lowering the prices of goods and services
iii. Advancing technology
A)iii only
B)ii only
C)i and iii
D)i only
E)i, ii, and iii
Unlock Deck
Unlock for access to all 99 flashcards in this deck.
Unlock Deck
k this deck
23
With no international trade, a country-------------------- consume at a point outside of its PPF; with international trade, a country --------------------consume at a point outside of its PPF.
A)can; cannot
B)cannot; cannot
C)cannot; can
D)can; can
E)None of the above answers is correct because the presence or absence of international trade has nothing to do with where a country consumes in comparison to its PPF.
A)can; cannot
B)cannot; cannot
C)cannot; can
D)can; can
E)None of the above answers is correct because the presence or absence of international trade has nothing to do with where a country consumes in comparison to its PPF.
Unlock Deck
Unlock for access to all 99 flashcards in this deck.
Unlock Deck
k this deck
24
Mac can bake more cookies than Monica per hour. It must be true that
A)Monica has an absolute advantage in cookie baking.
B)Mac has an absolute advantage in baking cookies.
C)Mac cannot benefit by trade between the two of them.
D)Mac has a comparative advantage in baking cookies.
E)Monica has a comparative advantage in baking cookies.
A)Monica has an absolute advantage in cookie baking.
B)Mac has an absolute advantage in baking cookies.
C)Mac cannot benefit by trade between the two of them.
D)Mac has a comparative advantage in baking cookies.
E)Monica has a comparative advantage in baking cookies.
Unlock Deck
Unlock for access to all 99 flashcards in this deck.
Unlock Deck
k this deck
25
If there is increasing opportunity cost, then when moving downward on a production possibilities frontier, the opportunity cost of the good on the horizontal axis --------------------as more of the good is produced.
A)increases and the PPF gets steeper
B)does not change and the PPF gets steeper
C)increases and the PPF gets flatter
D)decreases and the PPF gets flatter
E)decreases and the PPF gets steeper
A)increases and the PPF gets steeper
B)does not change and the PPF gets steeper
C)increases and the PPF gets flatter
D)decreases and the PPF gets flatter
E)decreases and the PPF gets steeper
Unlock Deck
Unlock for access to all 99 flashcards in this deck.
Unlock Deck
k this deck
26
As an economy produces more of one of the goods on a bowed out production possibilities frontier, What happens to the opportunity cost of producing the good?
A)It increases.
B)It decreases.
C)It remains constant.
D)It might increase, decrease, or remain constant depending on how much people value the additional units of the good.
E)None of these depict what happens to opportunity cost.
A)It increases.
B)It decreases.
C)It remains constant.
D)It might increase, decrease, or remain constant depending on how much people value the additional units of the good.
E)None of these depict what happens to opportunity cost.
Unlock Deck
Unlock for access to all 99 flashcards in this deck.
Unlock Deck
k this deck
27
The production possibilities frontier is a graph showing the
A)minimum combinations of goods and services that can be produced.
B)resources available for the economy's production use.
C)maximum combinations of goods and services that can be produced.
D)tradeoff between free lunches.
E)exact point of greatest efficiency for producing goods and services.
A)minimum combinations of goods and services that can be produced.
B)resources available for the economy's production use.
C)maximum combinations of goods and services that can be produced.
D)tradeoff between free lunches.
E)exact point of greatest efficiency for producing goods and services.
Unlock Deck
Unlock for access to all 99 flashcards in this deck.
Unlock Deck
k this deck
28
As an economy grows,
A)it can eliminate scarcity.
B)the opportunity cost of production will increase.
C)the opportunity cost of production will approach 0.
D)its PPF shifts outward.
E)its PPF does not shift; instead, the production point moves from inside the PPF to be closer to the PPF.
A)it can eliminate scarcity.
B)the opportunity cost of production will increase.
C)the opportunity cost of production will approach 0.
D)its PPF shifts outward.
E)its PPF does not shift; instead, the production point moves from inside the PPF to be closer to the PPF.
Unlock Deck
Unlock for access to all 99 flashcards in this deck.
Unlock Deck
k this deck
29
Relative to Al, Joe has-------------if Joe can produce a good at a lower opportunity cost than Al.
A)more production efficiency
B)a comparative benefit
C)a marginal benefit
D)a free lunch
E)a comparative advantage
A)more production efficiency
B)a comparative benefit
C)a marginal benefit
D)a free lunch
E)a comparative advantage
Unlock Deck
Unlock for access to all 99 flashcards in this deck.
Unlock Deck
k this deck
30
Which of the following statements is correct?
i. As the economy grows, the opportunity costs of economic growth decrease.
ii. Economic growth has no opportunity cost.
iii. The opportunity cost of economic growth is current consumption forgone.
A)ii only
B)i and iii
C)iii only
D)i and ii
E)i only
i. As the economy grows, the opportunity costs of economic growth decrease.
ii. Economic growth has no opportunity cost.
iii. The opportunity cost of economic growth is current consumption forgone.
A)ii only
B)i and iii
C)iii only
D)i and ii
E)i only
Unlock Deck
Unlock for access to all 99 flashcards in this deck.
Unlock Deck
k this deck
31
Consider a production possibility frontier with jeans on the vertical axis and shoes on the Horizontal axis. As a country moves along the frontier closer to the vertical axis,
A)inefficient production occurs.
B)the opportunity cost of producing jeans increases.
C)there are fewer tradeoffs.
D)the opportunity cost of producing shoes increases.
E)the opportunity cost of producing jeans decreases.
A)inefficient production occurs.
B)the opportunity cost of producing jeans increases.
C)there are fewer tradeoffs.
D)the opportunity cost of producing shoes increases.
E)the opportunity cost of producing jeans decreases.
Unlock Deck
Unlock for access to all 99 flashcards in this deck.
Unlock Deck
k this deck
32
-
In the table above, Jack's opportunity cost for 1 pound of food is --------------------and his opportunity cost for 1 pound of clothing is --------------------.
A)1 pound of clothing; 4 pounds of food
B)2 pounds of clothing; 2 pounds of food
C)1/2 of a pound of clothing; 2 pounds of food
D)1/3 of a pound of clothing; 3 pounds of food
E)1 pound of food; 1 pound of clothing
Unlock Deck
Unlock for access to all 99 flashcards in this deck.
Unlock Deck
k this deck
33
The figure above shows a nation's production possibilities frontier. In the figure, point A shows
A)an attainable point with unemployed resources.
B)an unattainable point.
C)the minimum quantity of pizza that the society must produce.
D)the maximum quantity of pizza that can be produced.
E)More information is needed to determine which of the above answers is correct.
Unlock Deck
Unlock for access to all 99 flashcards in this deck.
Unlock Deck
k this deck
34
-
The figure above show Liz's and Joe's production possibilities for Salads and Smoothies.
Given the information in the figure above, Liz-------------------- benefit from trade with Joe because--------------------
.
A)cannot; she has an absolute advantage in both goods
B)can; Joe is more productive in producing one of the goods
C)can; each of them has an absolute advantage in one of the goods
D)can; each of them has a comparative advantage in one of the goods
E)cannot; she has a comparative advantage in both goods
Unlock Deck
Unlock for access to all 99 flashcards in this deck.
Unlock Deck
k this deck
35
-
The figure above shows a production possibilities frontier. In the figure, the economy faces a tradeoff when -------------cell phones and -------------DVDs. are produced.
A)4.5 million; no
B)3 million; 9 million
C)5 million; 15 million
D)3 million; 8 million
E)2 million; 9 million
Unlock Deck
Unlock for access to all 99 flashcards in this deck.
Unlock Deck
k this deck
36
In the production possibilities model, the vertical axis measures --------------------and the horizontal axis measures--------------------.
A)people's wants; the quantity of a good or service
B)the quantity of a good or service; the quantity of another good or service
C)the price of a good or service; the price of another good or service
D)the quantity of a good or service; time
E)the price of a good or service; the quantity of the good or service
Unlock Deck
Unlock for access to all 99 flashcards in this deck.
Unlock Deck
k this deck
37
In a production possibilities frontier graph, the cost of producing more units of a good is measured by the
A)dollar value of the additional output.
B)area in the arc between the PPF and a straight line drawn between the starting point and the ending point.
C)dollar value of the resources used to produce the good.
D)amount of the other good or service that must be forgone.
E)None of the above answers is correct.
Unlock Deck
Unlock for access to all 99 flashcards in this deck.
Unlock Deck
k this deck
38
-
The figure above shows the production possibilities frontiers for the United Kingdom and France. What is the opportunity cost of one bushel of wheat for the United Kingdom?
A)1/2 of a pound of fish
B)1 pound of fish
C)200 pounds of fish
D)1/4 of a pound of fish
E)2 pounds of fish
Unlock Deck
Unlock for access to all 99 flashcards in this deck.
Unlock Deck
k this deck
39
When drawing a production possibilities frontier, which of the following is held constant?
A)the amount of money in the economy
B)the prices of goods and services
C)the quantity of the goods and services that are produced
D)the available factors of production and the state of technology
E)None of the above because nothing is held constant when drawing the production possibilities frontier.
Unlock Deck
Unlock for access to all 99 flashcards in this deck.
Unlock Deck
k this deck
40
Rika's opportunity cost of producing 100 t-shirts is 50 jackets. Jeff's opportunity cost of producing 75 t-shirts is 25 jackets. Who should specialize in jackets?
A)Jeff
B)Rika
C)neither
D)both
E)More information is needed about their production possibilities frontiers to determine who should specialize in jackets.
A)Jeff
B)Rika
C)neither
D)both
E)More information is needed about their production possibilities frontiers to determine who should specialize in jackets.
Unlock Deck
Unlock for access to all 99 flashcards in this deck.
Unlock Deck
k this deck
41
-
The above figure shows the production possibility frontier for a country. Suppose the country is producing at point A. What would be the opportunity cost to increase the production of rice to 12 tons?
A)15 thousand bottles of wine
B)6 tons of rice
C)9 thousand bottles of wine
D)6 thousand bottles of wine
E)Nothing, it is a free lunch
Unlock Deck
Unlock for access to all 99 flashcards in this deck.
Unlock Deck
k this deck
42
-
The above figure shows the production possibility frontier for an economy. The point or points that are not attainable are
A)point E.
B)points B and C.
C)points A, B, C, and D.
D)points A, B, and C.
E)points A and D.
Unlock Deck
Unlock for access to all 99 flashcards in this deck.
Unlock Deck
k this deck
43
-
The figure above shows the production possibilities frontier for a country. In order for it to move from producing at point A to producing at point B, the country would need to incur an opportunity cost of
A)1 million SUVs.
B)3 million compact cars.
C)3 million SUVs.
D)4 million SUVs.
E)0 because the gain in compact cars exceeds the loss in SUVs.
Unlock Deck
Unlock for access to all 99 flashcards in this deck.
Unlock Deck
k this deck
44
The opportunity cost of a good increases as more of it is produced because
A)producing more of a good requires additional resources.
B)resources are not equally productive in all activities.
C)the number of forgone alternatives also increases.
D)people want the good less as more is produced.
E)there is no such thing as a free lunch.
A)producing more of a good requires additional resources.
B)resources are not equally productive in all activities.
C)the number of forgone alternatives also increases.
D)people want the good less as more is produced.
E)there is no such thing as a free lunch.
Unlock Deck
Unlock for access to all 99 flashcards in this deck.
Unlock Deck
k this deck
45
The opportunity cost of producing one more unit of a good is calculated by dividing the
A)decrease in the quantity of the other good by the increase in the quantity of the good whose opportunity cost we're calculating.
B)total quantity of that good by the total quantity of other good.
C)increase in the quantity of that good by the decrease in the quantity of other good.
D)total quantity of the other good by the total quantity of the good whose opportunity cost we're calculating.
E)price of the good whose opportunity cost we are calculating by the number of units of the other good that are forgone.
Unlock Deck
Unlock for access to all 99 flashcards in this deck.
Unlock Deck
k this deck
46
-
The figure above show Liz's and Joe's production possibilities for Salads and Smoothies.
Liz has a comparative advantage in--------------------because--------------------
A)smoothies; she can produce more smoothies per hour than Joe can
B)smoothies; her opportunity cost of producing smoothies is lower than Joe's
C)salads; she can produce more salads per hour than Joe can
D)both goods; she can produce more of both goods per hour than Joe can
E)salads; her opportunity cost of producing salads is lower than Joe's
Unlock Deck
Unlock for access to all 99 flashcards in this deck.
Unlock Deck
k this deck
47
-
The table above gives the production possibilities frontier for two countries, Anaconda and Bear.
The opportunity cost of moving from production point B to production point C for Anaconda Equals ------------- and for Bear equals------------- .
A)100 pairs of shoes; 200 pairs of shoes
B)50 pairs of shoes; 100 pairs of shoes
C)1 ton of corn; 1 ton of corn
D)550 pairs of shoes; 700 pairs of shoes
E)650 pairs of shoes; 900 pairs of shoes
Unlock Deck
Unlock for access to all 99 flashcards in this deck.
Unlock Deck
k this deck
48
-
The above figure shows the production possibility frontier for a country. What is the opportunity cost to move from point D to point E?
A)6 tons of rice
B)15 thousand bottles of wine
C)6 thousand bottles of wine
D)9 thousand bottles of wine
E)Nothing, it is a free lunch
Unlock Deck
Unlock for access to all 99 flashcards in this deck.
Unlock Deck
k this deck
49
A country has a comparative advantage in the production of a good if it can
A)tradeoff producing the good for another good.
B)produce the good on and remain on its production possibilities frontier.
C)produce the good at the lowest opportunity cost.
D)produce more of the good most efficiently.
E)produce more of the good than another country.
A)tradeoff producing the good for another good.
B)produce the good on and remain on its production possibilities frontier.
C)produce the good at the lowest opportunity cost.
D)produce more of the good most efficiently.
E)produce more of the good than another country.
Unlock Deck
Unlock for access to all 99 flashcards in this deck.
Unlock Deck
k this deck
50
-
The figure above shows the production possibilities frontier for a country. A combination of 3 million gallons of milk and 3 million gallons of ice cream is
A)attainable and production efficient.
B)attainable and production inefficient.
C)unattainable.
D)unattainable and production efficient.
E)More information is needed to determine if the point is attainable or not.
Unlock Deck
Unlock for access to all 99 flashcards in this deck.
Unlock Deck
k this deck
51
-
In the above figure, Jill's opportunity cost of producing 1 gallon of soda is --------------------of bottled water.
A)1/4 of a gallon
B)1 gallon
C)1/2 of a gallon
D)4 gallons
E)2 gallons
Unlock Deck
Unlock for access to all 99 flashcards in this deck.
Unlock Deck
k this deck
52
Moving from one point to another on a production possibilities frontier implies
A)changing the amount of factors of production that are employed.
B)decreasing the production of both goods.
C)holding the production levels of both goods constant.
D)increasing the production of both goods.
E)increasing the production of one good and decreasing the production of another.
A)changing the amount of factors of production that are employed.
B)decreasing the production of both goods.
C)holding the production levels of both goods constant.
D)increasing the production of both goods.
E)increasing the production of one good and decreasing the production of another.
Unlock Deck
Unlock for access to all 99 flashcards in this deck.
Unlock Deck
k this deck
53
What is gained when people engage in specialization and trade?
A)Specialization and trade allow people to produce outside their individual production possibilities frontiers.
B)Specialization and trade allow people to consume inside their production possibilities frontiers.
C)Specialization and trade allow people to consume outside their individual production possibilities frontiers.
D)Specialization and trade allow people to consume at a point on their production possibilities frontiers.
E)There are no gains from specialization and trade.
Unlock Deck
Unlock for access to all 99 flashcards in this deck.
Unlock Deck
k this deck
54
The idea of increasing opportunity cost is reflected in the
A)bowed out shape of the production possibilities frontier.
B)fact that the PPF shows there are unattainable production points.
C)positive slope of the production possibilities frontier.
D)linear shape of the production possibilities frontier.
E)bowed in shape of the production possibilities frontier.
Unlock Deck
Unlock for access to all 99 flashcards in this deck.
Unlock Deck
k this deck
55
-
The figure above shows how the PPF for cell phones and new cell-phone factories can expand. In the figure, if the economy chose the point on this year's PPF that is above point K, the next year's PPF would
A)shift outward along the horizontal axis farther than the new PPF shown in the figure.
B)shift inward along the horizontal axis.
C)shift outward along the vertical axis, not along the horizontal axis.
D)shift outward along the horizontal axis, but not as far as the new PPF shown in the figure.
E)shift inward along the vertical axis.
Unlock Deck
Unlock for access to all 99 flashcards in this deck.
Unlock Deck
k this deck
56
The table above shows a nation's production possibilities frontier. The opportunity cost of a robot between combination D and E is
A)30 pizzas.
B)4 pizzas.
C)1/4 of a pizza.
D)34 pizzas.
E)undefined because neither point is production efficient.
Unlock Deck
Unlock for access to all 99 flashcards in this deck.
Unlock Deck
k this deck
57
Why is a production possibilities frontier bowed out (concave)?
A)The bowed shape reflects increasing opportunity cost.
B)The bowed shape indicates that opportunity cost at first decreases at a decreasing rate, and then begins to decrease at an increasing rate.
C)The bowed shape indicates that opportunity cost at first increases at a decreasing rate, and then begins to increase at an increasing rate.
D)The bowed shape reflects constant opportunity cost.
E)The bowed shape reflects decreasing opportunity cost.
Unlock Deck
Unlock for access to all 99 flashcards in this deck.
Unlock Deck
k this deck
58
Points on the PPF are all
A)inefficient.
B)production efficient.
C)free lunches.
D)unattainable and have fully employed resources.
E)attainable and have some unemployed resources.
A)inefficient.
B)production efficient.
C)free lunches.
D)unattainable and have fully employed resources.
E)attainable and have some unemployed resources.
Unlock Deck
Unlock for access to all 99 flashcards in this deck.
Unlock Deck
k this deck
59
The United States produced approximately--------------------worth of goods and services in 2011.
A)$150 billion
B)$15 trillion
C)$150 trillion
D)$1,500 trillion
E)$15 billion
A)$150 billion
B)$15 trillion
C)$150 trillion
D)$1,500 trillion
E)$15 billion
Unlock Deck
Unlock for access to all 99 flashcards in this deck.
Unlock Deck
k this deck
60
-
The table above gives the production possibilities frontier for two countries, Anaconda and Bear. The table shows that
A)Bear has an absolute advantage in the production of both goods.
B)Anaconda has a comparative advantage in the production of corn.
C)Bear achieves production efficiency only at its production point A.
D)Anaconda achieves production efficiency only at its production point A.
E)Both answers A and B are correct.
Unlock Deck
Unlock for access to all 99 flashcards in this deck.
Unlock Deck
k this deck
61
-
The above figure shows the production possibility frontier for a country. Suppose the country is producing at point A. What is the opportunity cost of increasing the production of rice to 12 tons?
A)15 thousand bottles of wine
B)12 tons of rice
C)9 thousand bottles of wine
D)6 thousand bottles of wine
E)Nothing, it is a free lunch
Unlock Deck
Unlock for access to all 99 flashcards in this deck.
Unlock Deck
k this deck
62
The figure above shows a production possibilities frontier. In the figure, when the economy moves from point E to point D, what is the opportunity cost of a DVD?
A)zero
B)1 cell phone
C)0.25 cell phones
D)4 cell phones
E)0.5 cell phones
Unlock Deck
Unlock for access to all 99 flashcards in this deck.
Unlock Deck
k this deck
63
-
The above figure shows the production possibility frontier for a country. Suppose the country is producing at point D. What would be the opportunity cost to move to point C?
A)6 thousand bottles of wine
B)12 tons of rice
C)15 thousand bottles of wine
D)Nothing, it is a free lunch
E)This movement is not possible without economic growth.
Unlock Deck
Unlock for access to all 99 flashcards in this deck.
Unlock Deck
k this deck
64
-
Suppose India and France have the same PPF, shown in the figure above. Based on their current production points, India's most likely future PPF is --------------------and France's most likely future PPF is--------------------
.
A)PPF1; PPF1
B)PPF1; PPF2
C)PPF0; PPF0
D)PPF2; PPF2
E)PPF2; PPF1
Unlock Deck
Unlock for access to all 99 flashcards in this deck.
Unlock Deck
k this deck
65
-
The figure above shows the production possibilities frontier for a country. In order for it to produce at point E, the
A)production of SUVs would need to decrease.
B)country would need to use its resources more efficiently.
C)production of compact cars would need to decrease.
D)country would need to determine that compact cars and SUVs are equally important to it.
E)country would need to acquire more resources and/or more advanced technology.
Unlock Deck
Unlock for access to all 99 flashcards in this deck.
Unlock Deck
k this deck
66
-
The figure above shows the production possibilities frontiers for the United Kingdom and France. If the United Kingdom and France specialize and engage in trade, the United Kingdom will produce--------------------
And France will produce-------------------- .
A)fish; fish
B)both wheat and fish; both wheat and fish
C)wheat; wheat
D)wheat; fish
E)fish; wheat
Unlock Deck
Unlock for access to all 99 flashcards in this deck.
Unlock Deck
k this deck
67
The United States can use all its resources to produce 250 DVDs or 500 shoes. China can use all of its resources to produce 30 DVDs or 300 shoes. The opportunity cost of producing a DVD in the United States is
A)500 shoes.
B)1 DVD.
C)2 shoes.
D)20 shoes.
E)1/2 of a shoe.
A)500 shoes.
B)1 DVD.
C)2 shoes.
D)20 shoes.
E)1/2 of a shoe.
Unlock Deck
Unlock for access to all 99 flashcards in this deck.
Unlock Deck
k this deck
68
The above figure shows the PPF for a country that produces computers and computer factories. The nation's production possibilities frontier is PPF0 . At which of the following production points would the economy grow most rapidly?
A)Point A
B)Point B
C)Point C
D)It makes no difference among the three points because they are all production efficient.
E)More information is needed to answer the question.
Unlock Deck
Unlock for access to all 99 flashcards in this deck.
Unlock Deck
k this deck
69
-
The table above shows a production possibilities frontier for an economy. Which of the following combinations is unattainable?
A)0 loaves of bread and 800 books
B)100 loaves of bread and 800 books
C)300 loaves of bread and 200 books
D)200 loaves of bread and 800 books
E)0 loaves of bread and 0 books
Unlock Deck
Unlock for access to all 99 flashcards in this deck.
Unlock Deck
k this deck
70
-
The table above shows the production possibilities for an economy. The opportunity cost of a loaf of bread is --------------------when moving from possibility B to possibility C.
A)100 loaves of bread
B)1/2 of a book
C)200 books
D)1 loaf of bread
E)2 books
Unlock Deck
Unlock for access to all 99 flashcards in this deck.
Unlock Deck
k this deck
71
-
In the above figure, Jill's opportunity cost of producing 1 gallon of bottled water is --------------------of soda.
A)4 gallons
B)1/2 of a gallon
C)1/4 of a gallon
D)2 gallons
E)1 gallon
Unlock Deck
Unlock for access to all 99 flashcards in this deck.
Unlock Deck
k this deck
72
-
The figure above shows a production possibilities frontier. In the figure, when the economy moves from point C to point B, what is the opportunity cost of a DVD?
A)2 million cell phones
B)2 cell phones
C)0.5 cell phones
D)zero
E)0.5 million cell phones
Unlock Deck
Unlock for access to all 99 flashcards in this deck.
Unlock Deck
k this deck
73
Suppose that Germany, France, Estonia, and India all have the same production possibilities, illustrated in the figure above. Based on the production points in the figure, which country is most likely to expand its PPF to PPF1?
A)Germany
B)France
C)France and Germany equally.
D)Estonia
E)India
A)Germany
B)France
C)France and Germany equally.
D)Estonia
E)India
Unlock Deck
Unlock for access to all 99 flashcards in this deck.
Unlock Deck
k this deck
74
-
Huey and Steve can grow potatoes or tomatoes. The table above shows the pounds of potatoes and tomatoes Huey and Steve can grow in a week. Based on the table, which of the following statements is correct?
A)Steve has a comparative advantage in both potatoes and tomatoes.
B)Huey has an absolute advantage in potatoes only.
C)Huey has an absolute advantage in both potatoes and tomatoes.
D)Steve has an absolute advantage in both potatoes and tomatoes.
E)Steve has an absolute advantage in potatoes only.
Unlock Deck
Unlock for access to all 99 flashcards in this deck.
Unlock Deck
k this deck
75
Which of the following best describes comparative advantage?
A)being able to produce more output than any other country
B)using the fewest number of resources to produce a given amount of output
C)forgoing the fewest units of one product to produce a unit of another product
D)having the largest number of resources compared to other countries
E)It is the same as absolute advantage.
Unlock Deck
Unlock for access to all 99 flashcards in this deck.
Unlock Deck
k this deck
76
Why does a nation experience increasing opportunity cost?
A)When the amount of resources increases, the opportunity cost of all goods and services increases.
B)Resources are not equally productive in producing different kinds of goods and services.
C)Because the nation cannot produce at the unattainable production points that lie beyond the PPF.
D)As the nation moves from a production point within the PPF to another point also within the PPF, opportunity costs increase.
E)As the nation moves from a production point within the PPF to one on the PPF, opportunity costs increase.
Unlock Deck
Unlock for access to all 99 flashcards in this deck.
Unlock Deck
k this deck
77
Suppose India and France have the same PPF, shown in the figure above. Based on their current production points, which is France's most likely future PPF?
A)PPF0.
B)PPF1.
C)PPF2.
D)Either PPF0 or PPF1.
E)None of the above because economic growth will not happen in India.
Unlock Deck
Unlock for access to all 99 flashcards in this deck.
Unlock Deck
k this deck
78
In one hour John can produce 20 loaves of bread or 8 cakes. In one hour Phyllis can produce 30 loaves of bread or 15 cakes. Which of the following statements is true?
A)Phyllis has an absolute advantage in both goods.
B)Phyllis has a comparative advantage in producing bread.
C)Phyllis has a comparative advantage in producing both cakes and bread.
D)John has a comparative advantage in producing cakes.
E)John has an absolute advantage in both goods.
A)Phyllis has an absolute advantage in both goods.
B)Phyllis has a comparative advantage in producing bread.
C)Phyllis has a comparative advantage in producing both cakes and bread.
D)John has a comparative advantage in producing cakes.
E)John has an absolute advantage in both goods.
Unlock Deck
Unlock for access to all 99 flashcards in this deck.
Unlock Deck
k this deck
79
A bowed out PPF reflects which of the following ideas?
i. increasing opportunity cost
ii. resources are not equally productive in all activities
iii. prices of goods increase over time
A)i, ii, and iii
B)i and iii
C)i and ii
D)i only
E)ii and iii
i. increasing opportunity cost
ii. resources are not equally productive in all activities
iii. prices of goods increase over time
A)i, ii, and iii
B)i and iii
C)i and ii
D)i only
E)ii and iii
Unlock Deck
Unlock for access to all 99 flashcards in this deck.
Unlock Deck
k this deck
80
Suppose that in a PPF graph, wheat is on the vertical axis and jets are on the horizontal axis. moving down along the PPF, the
A)number of jets increases and the opportunity cost of jets decreases.
B)opportunity cost of jets and wheat both increase.
C)amount of wheat increases and the opportunity cost of wheat increases.
D)number of jets increases and the opportunity cost of jets increases.
E)amount of wheat increases and opportunity cost of wheat decreases.
Unlock Deck
Unlock for access to all 99 flashcards in this deck.
Unlock Deck
k this deck
Unlock Deck
Unlock for access to all 99 flashcards in this deck.


