Deck 3: Data Visualization
Full screen (f)
Question
Question
Question
Question
Question
Question
Question
Question
Question
Question
Use the data given below to answer the following questions).
Following is the purchase order database of 'The Chef Says So', a restaurant in New York, over the last quarter April-June).
Describe how to and construct a line chart exhibiting the purchase order of ceramic plates over the three months.
Following is the purchase order database of 'The Chef Says So', a restaurant in New York, over the last quarter April-June).
Describe how to and construct a line chart exhibiting the purchase order of ceramic plates over the three months.
Question
Question
Question
Question
Question
Question
Question
Question
Question
Question
Question
Question
Question
Question
Question
Question
Question
Question
Question
Question

Unlock Deck
Sign up to unlock the cards in this deck!
Unlock Deck
Unlock Deck
1/30
Play
Full screen (f)
Deck 3: Data Visualization
1
To select a chart type in Excel from the Charts group, which tab has to be accessed?
A) Design tab
B) Layout tab
C) Insert tab
D) Format tab
A) Design tab
B) Layout tab
C) Insert tab
D) Format tab
Insert tab
2
Philip wishes to understand the relative proportion of each data source to the total. Which of the following charts must Philip use?
A) Pie chart
B) Bar chart
C) Scatter chart
D) Column chart
A) Pie chart
B) Bar chart
C) Scatter chart
D) Column chart
Pie chart
3
Describe how to and construct a pie chart exhibiting the count of purchase orders by item.
Identify all the outcomes for the variable Item. Create a frequency table of the counts of purchase orders by each outcome of the variable Item using the Excel formula COUNTIF$B$2:$B$44, criteria), where criteria represents each outcome of the variable Item. Select the entire table and choose the type of chart Pie Chart) from the Charts group under the Insert tab. Change the title and make data and formatting changes where necessary. 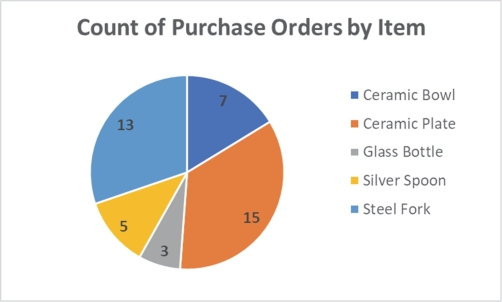
4
Elaborate on the use of geographic data mapping in business analytics.
Unlock Deck
Unlock for access to all 30 flashcards in this deck.
Unlock Deck
k this deck
5
To select data bars in Excel from the Home tab, which command would have to be accessed?
A) Find & Select under Editing group
B) Conditional Formatting under Styles group
C) Format under Cell group
D) None of the above
A) Find & Select under Editing group
B) Conditional Formatting under Styles group
C) Format under Cell group
D) None of the above
Unlock Deck
Unlock for access to all 30 flashcards in this deck.
Unlock Deck
k this deck
6
After choosing the PivotTable, the PivotChart can be found on the tab.
A) Design
B) View
C) Analyze
D) Layout
A) Design
B) View
C) Analyze
D) Layout
Unlock Deck
Unlock for access to all 30 flashcards in this deck.
Unlock Deck
k this deck
7
Observations consisting of pairs of variable data are required to construct a chart.
A) doughnut
B) scatter
C) radar
D) line
A) doughnut
B) scatter
C) radar
D) line
Unlock Deck
Unlock for access to all 30 flashcards in this deck.
Unlock Deck
k this deck
8
Roger wants to compare values across categories using vertical rectangles. Which of the following charts must Roger use?
A) Line chart
B) Clustered column chart
C) Pie chart
D) Stacked column chart
A) Line chart
B) Clustered column chart
C) Pie chart
D) Stacked column chart
Unlock Deck
Unlock for access to all 30 flashcards in this deck.
Unlock Deck
k this deck
9
Which of the following charts provides a useful means for displaying data over time?
A) Scatter chart
B) A doughnut chart
C) Pie chart
D) Line chart
A) Scatter chart
B) A doughnut chart
C) Pie chart
D) Line chart
Unlock Deck
Unlock for access to all 30 flashcards in this deck.
Unlock Deck
k this deck
10
Use the data given below to answer the following questions).
Following is the purchase order database of 'The Chef Says So', a restaurant in New York, over the last quarter April-June).
Describe how to and construct a line chart exhibiting the purchase order of ceramic plates over the three months.
Following is the purchase order database of 'The Chef Says So', a restaurant in New York, over the last quarter April-June).
Describe how to and construct a line chart exhibiting the purchase order of ceramic plates over the three months.
Unlock Deck
Unlock for access to all 30 flashcards in this deck.
Unlock Deck
k this deck
11
Which of the following charts shows three-dimensional data?
A) Surface chart
B) Column chart
C) Stock chart
D) Doughnut chart
A) Surface chart
B) Column chart
C) Stock chart
D) Doughnut chart
Unlock Deck
Unlock for access to all 30 flashcards in this deck.
Unlock Deck
k this deck
12
Use the data given below to answer the following questions).
Following is the purchase order database of 'The Chef Says So', a restaurant in New York, over the last quarter April-June).
-Changes to the type of chart, data included in the chart, and chart layout and styles can be made from the Layout tab.
Following is the purchase order database of 'The Chef Says So', a restaurant in New York, over the last quarter April-June).
-Changes to the type of chart, data included in the chart, and chart layout and styles can be made from the Layout tab.
Unlock Deck
Unlock for access to all 30 flashcards in this deck.
Unlock Deck
k this deck
13
Describe how to and construct an area chart exhibiting the units ordered by the region of Puitoria over the three months.
Unlock Deck
Unlock for access to all 30 flashcards in this deck.
Unlock Deck
k this deck
14
Describe how to and construct a scatter chart exhibiting the relationship between the unit cost and the number of units for the purchase of steel forks.
Unlock Deck
Unlock for access to all 30 flashcards in this deck.
Unlock Deck
k this deck
15
Describe how to and construct a column chart exhibiting the total units purchased by region.
Unlock Deck
Unlock for access to all 30 flashcards in this deck.
Unlock Deck
k this deck
16
Peige, a stock broker, has data consisting of price, price/earnings ratio, and market capitalization for seven different stocks on one particular day. She wishes to plot these three variables in two dimensions. Which of the following charts must Peige use?
A) Stock chart
B) Surface chart
C) Bubble chart
D) Line chart
A) Stock chart
B) Surface chart
C) Bubble chart
D) Line chart
Unlock Deck
Unlock for access to all 30 flashcards in this deck.
Unlock Deck
k this deck
17
Describe how to and construct a combination chart exhibiting the purchase order of ceramic plates as a line, and the unit cost as columns on the secondary axis over the three months.
Unlock Deck
Unlock for access to all 30 flashcards in this deck.
Unlock Deck
k this deck
18
Construct a PivotChart to visualize the purchase order total units for steel forks and ceramic bowls within each region.
Unlock Deck
Unlock for access to all 30 flashcards in this deck.
Unlock Deck
k this deck
19
How does Excel distinguish between vertical and horizontal bar charts?
Unlock Deck
Unlock for access to all 30 flashcards in this deck.
Unlock Deck
k this deck
20
Which of the following charts allows plotting of multiple dimensions of several data series?
A) Doughnut chart
B) Bubble chart
C) Radar chart
D) Area chart
A) Doughnut chart
B) Bubble chart
C) Radar chart
D) Area chart
Unlock Deck
Unlock for access to all 30 flashcards in this deck.
Unlock Deck
k this deck
21
What is a Key Performance Indicator?
A) A chart located in the bottom right of a dashboard.
B) An unnecessarily cluttered chart or table.
C) An important business metric.
D) None of the above.
A) A chart located in the bottom right of a dashboard.
B) An unnecessarily cluttered chart or table.
C) An important business metric.
D) None of the above.
Unlock Deck
Unlock for access to all 30 flashcards in this deck.
Unlock Deck
k this deck
22
Let's suppose you have a data set reporting the sales of five different product categories across the columns, and for each of the past four quarters, listed across the rows. Which of the following use of Sparklines would be the most appropriate?
A) Column Sparklines to compare quarterly sales across product categories and time series for each product category.
B) Line Sparklines to visualize quarterly sales across product categories and time series for each product category.
C) Line Sparklines to visualize quarterly sales across product categories, and Column Sparklines to compare time series for each product category.
D) Column Sparklines to compare quarterly sales across product categories, and Line Sparklines to visualize time series for each product category.
Unlock Deck
Unlock for access to all 30 flashcards in this deck.
Unlock Deck
k this deck
23
How many types of Sparklines are available?
A) 2
B) 3
C) 4
D) 5
A) 2
B) 3
C) 4
D) 5
Unlock Deck
Unlock for access to all 30 flashcards in this deck.
Unlock Deck
k this deck
24
Icon Sets can provide more information than Color Scales because they allow you to combine shapes and arrows.
Unlock Deck
Unlock for access to all 30 flashcards in this deck.
Unlock Deck
k this deck
25
Dashboards may include tabular as well as visual data to help a manager to quickly locate key information.
Unlock Deck
Unlock for access to all 30 flashcards in this deck.
Unlock Deck
k this deck
26
Win/Loss Sparklines can only be used on quantitative data.
Unlock Deck
Unlock for access to all 30 flashcards in this deck.
Unlock Deck
k this deck
27
Complete the following sentence: a Dashboard…
A) is a visual representation of a set of key business measures.
B) is derived from the analogy of an automobile's control panel.
C) provides important summaries of key business information.
D) is all of the above.
A) is a visual representation of a set of key business measures.
B) is derived from the analogy of an automobile's control panel.
C) provides important summaries of key business information.
D) is all of the above.
Unlock Deck
Unlock for access to all 30 flashcards in this deck.
Unlock Deck
k this deck
28
You may not display data bars without the data in the cells.
Unlock Deck
Unlock for access to all 30 flashcards in this deck.
Unlock Deck
k this deck
29
How is the color-coding of quantitative data commonly called?
A) Heatmap
B) Rainbow
C) Scaling
D) Hot & Cold
A) Heatmap
B) Rainbow
C) Scaling
D) Hot & Cold
Unlock Deck
Unlock for access to all 30 flashcards in this deck.
Unlock Deck
k this deck
30
Color Scales are one of the options under Conditional Formatting.
Unlock Deck
Unlock for access to all 30 flashcards in this deck.
Unlock Deck
k this deck
Unlock Deck
Unlock for access to all 30 flashcards in this deck.


