Deck 1: Empirical Perspectives on the Financial Characteristics of Publicly Traded Us Nonfinancial Firms
Full screen (f)
Question
Question
Question
Question
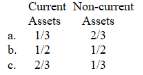
For public U.S.nonfinancial firms in composite, the fractions of current assets and non-current assets (all in book values; year-end 2000) are approximately:
Question
Question
Question
Question
Question
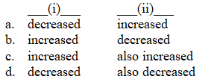
Throughout the period 1980-2000, the composite proportion of the TA of U.S.nonfinancial firms accounted for by net PP&E generally ___
(i)____, and the proportion of TA financed by equity ___(ii)fairly steadily.
(i)____, and the proportion of TA financed by equity ___(ii)fairly steadily.
Question
Question
Question
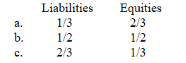
For public U.S.nonfinancial firms in composite, the fractions of liabilities (current plus non- current), and equities (all in book values, year-end 2000) are approximately:

Unlock Deck
Sign up to unlock the cards in this deck!
Unlock Deck
Unlock Deck
1/12
Play
Full screen (f)
Deck 1: Empirical Perspectives on the Financial Characteristics of Publicly Traded Us Nonfinancial Firms
1
What average annual proportion of the total number of public U.S.nonfinancial firms at year-end 1980 exited over the years 1981-2000 (i.e., the average attrition rate)?
A)5.9%
B)15.9%
C)25.9%
D)35.9%
A)5.9%
B)15.9%
C)25.9%
D)35.9%
5.9%
2
Which category of liabilities & equities had the smallest proportion in every year from 1980- 2000?
A)current liabilities
B)debt
C)other non-current liabilities
D)common stock
E)preferred stock
A)current liabilities
B)debt
C)other non-current liabilities
D)common stock
E)preferred stock
preferred stock
3
Over the years 1981-2000, 4,770 nonfinancial firms exited the U.S.markets for publicly traded equity.Which of the following was the most frequent reason for a firm's exit?
A)Merger or acquisition
B)Bankruptcy or liquidation
C)The firm reverted to private equity ownership
D)The firm changed its listing to a foreign stock exchange
A)Merger or acquisition
B)Bankruptcy or liquidation
C)The firm reverted to private equity ownership
D)The firm changed its listing to a foreign stock exchange
Merger or acquisition
4
For public U.S.nonfinancial firms in composite, the fractions of current assets and non-current assets (all in book values; year-end 2000) are approximately:
Unlock Deck
Unlock for access to all 12 flashcards in this deck.
Unlock Deck
k this deck
5
For public U.S.nonfinancial firms over the years 1980-2000, the composite market-to-book equity ratio generally:
A)increased from 1980-2000.
B)decreased from 1980-2000.
C)remained stable from 1980-2000.
A)increased from 1980-2000.
B)decreased from 1980-2000.
C)remained stable from 1980-2000.
Unlock Deck
Unlock for access to all 12 flashcards in this deck.
Unlock Deck
k this deck
6
Which groups of U.S.nonfinancial firms have the highest composite proportions of PP&E to TA?
A)S&P Industrials
B)S&P MidCaps
C)S&P SmallCaps
D)S&P Transports and Utilities
A)S&P Industrials
B)S&P MidCaps
C)S&P SmallCaps
D)S&P Transports and Utilities
Unlock Deck
Unlock for access to all 12 flashcards in this deck.
Unlock Deck
k this deck
7
Over the 20-year period of 1980-2000, the composite dividend yield of public U.S.nonfinancial firms has generally:
A)increased.
B)decreased.
C)remained.
A)increased.
B)decreased.
C)remained.
Unlock Deck
Unlock for access to all 12 flashcards in this deck.
Unlock Deck
k this deck
8
According to the composite sources-and-uses data presented in Chapter 1, the main net source of funds for U.S.nonfinancial firms over the years 1980-2000 is:
A)proceeds from debt offerings.
B)proceeds from equity offerings.
C)retained earnings (net cash flow from operations).
D)sales of investments (net of increases in investments).
A)proceeds from debt offerings.
B)proceeds from equity offerings.
C)retained earnings (net cash flow from operations).
D)sales of investments (net of increases in investments).
Unlock Deck
Unlock for access to all 12 flashcards in this deck.
Unlock Deck
k this deck
9
Throughout the period 1980-2000, the composite proportion of the TA of U.S.nonfinancial firms accounted for by net PP&E generally ___
(i)____, and the proportion of TA financed by equity ___(ii)fairly steadily.
(i)____, and the proportion of TA financed by equity ___(ii)fairly steadily.
Unlock Deck
Unlock for access to all 12 flashcards in this deck.
Unlock Deck
k this deck
10
Which category of composite assets (for public U.S.nonfinancial firms) showed the largest proportional decrease over the years 1980-2000?
A)cash and equivalents
B)inventories
C)net PP&E
D)other non-current assets
A)cash and equivalents
B)inventories
C)net PP&E
D)other non-current assets
Unlock Deck
Unlock for access to all 12 flashcards in this deck.
Unlock Deck
k this deck
11
The ownership structures of most publicly traded U.S.nonfinancial firms is better characterized by the term:
A)closely held
B)diffuse
A)closely held
B)diffuse
Unlock Deck
Unlock for access to all 12 flashcards in this deck.
Unlock Deck
k this deck
12
For public U.S.nonfinancial firms in composite, the fractions of liabilities (current plus non- current), and equities (all in book values, year-end 2000) are approximately:
Unlock Deck
Unlock for access to all 12 flashcards in this deck.
Unlock Deck
k this deck
Unlock Deck
Unlock for access to all 12 flashcards in this deck.


