Deck 11: Correlation and Regression
Full screen (f)
Question
The following display from a TI-84 Plus calculator presents the results of a hypothesis test for the difference between two proportions. The sample sizes are  and
and 
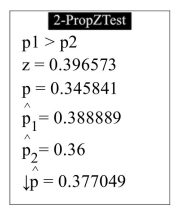
Is this a left-tailed test, a right-tailed test, or a two-tailed test?
A) Right-tailed test
B) Two-tailed test
C) Left-tailed test
and Is this a left-tailed test, a right-tailed test, or a two-tailed test?
A) Right-tailed test
B) Two-tailed test
C) Left-tailed test
Question
A amateur golfer wishes to determine if there is a difference between the drive distances 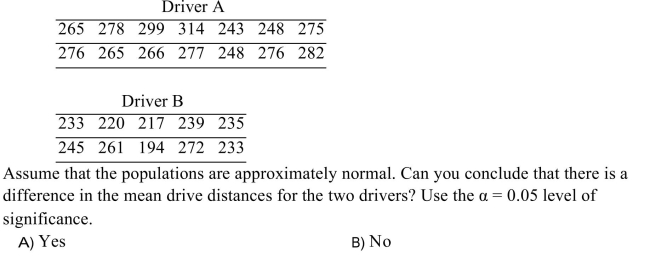
Question
The concentration of hexane (a common solvent)was measured in units of micrograms 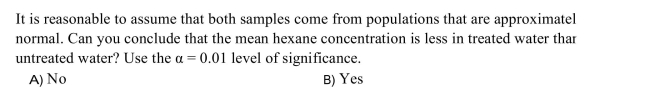
Question
A study reported that in a sample of 104 people who watch television news,) 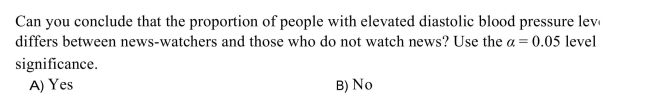
Question
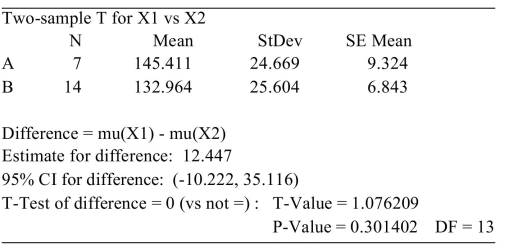
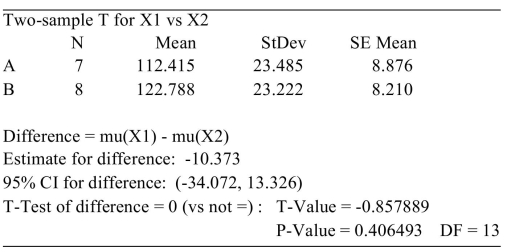
The following MINITAB output display presents the results of a hypothesis test for the difference  between two population means.
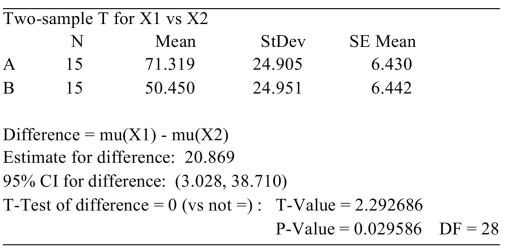
How many degrees of freedom are there for the test statistic?
A) 27
B) 0.029586
C) 28
D) 20.869
between two population means.How many degrees of freedom are there for the test statistic?
A) 27
B) 0.029586
C) 28
D) 20.869
Question
In an agricultural experiment,) 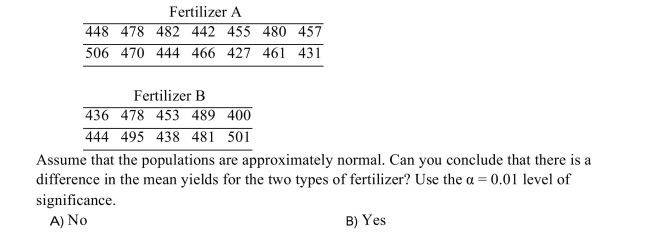
Question
An automobile manufacturer wishes to test that claim that synthetic motor oil can improve gas 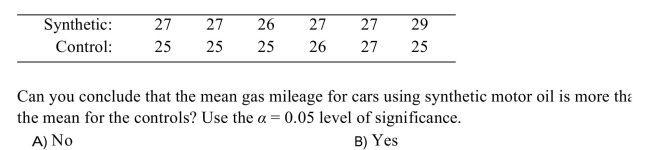
Question
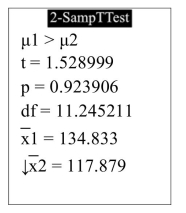
The following display from a TI-84 Plus calculator presents the results of a hypothesis test for the difference between two means. The sample sizes are 
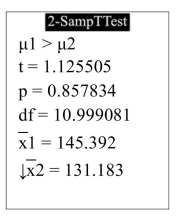
What is the P -value?
A) 0.142166
B) 1.125505
C) 10.999081
D) 0.857834
What is the P -value?
A) 0.142166
B) 1.125505
C) 10.999081
D) 0.857834
Question
A test was made of 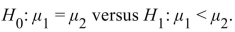
The sample means were and
and  the sample standard deviations were
 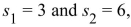 and the sample sizes were
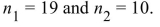
Is rejected at the 0.05 level? (Hint: First compute the value of the test statistic.)
A) No
B) Yes
The sample means were
and the sample standard deviations were and the sample sizes were Is
rejected at the 0.05 level? (Hint: First compute the value of the test statistic.)A) No
B) Yes
Question
In a test for the difference between two proportions, the sample sizes were  and
and  and the numbers of events were
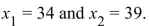
A test is made of the hypothesis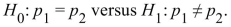
Can you reject rejected at the
  level?
A) Yes
B) No
and and the numbers of events were A test is made of the hypothesis
Can you reject
rejected at the level?A) Yes
B) No
Question
A study reported that in a sample of 81 men,) 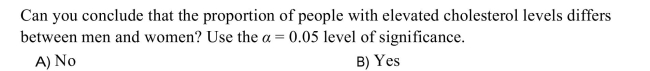
Question
A test was made of 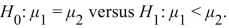 The sample means
  and
and  the sample standard deviations were
 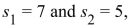 and the sample sizes
were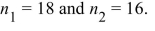
Compute the value of the test statistic.
A) -0.697
B) -4.067
C) -7.164
D) -2.899
The sample means and the sample standard deviations were and the sample sizeswere
Compute the value of the test statistic.
A) -0.697
B) -4.067
C) -7.164
D) -2.899
Question
The following display from a TI-84 Plus calculator presents the results of a hypothesis test for the difference between two proportions. The sample sizes are  and
and 
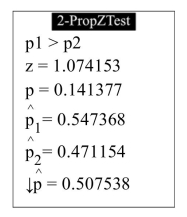
What is the P -value?
A) 0.141377
B) 0.507538
C) 1.074153
D) 0.547368
and What is the P -value?
A) 0.141377
B) 0.507538
C) 1.074153
D) 0.547368
Question
A garden seed wholesaler wishes to test the claim that tomato seeds germinate faster when each 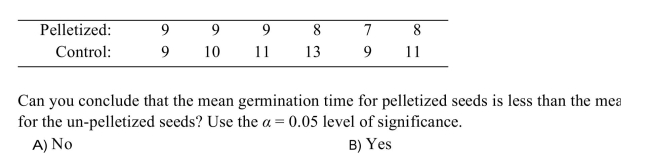
Question
The following MINITAB output display presents the results of a hypothesis test for the difference  between two population means.
What is the alternate hypothesis?
A)
B)
C)
D)
between two population means.What is the alternate hypothesis?
A)
B)
C)
D)
Question
In a test for the difference between two proportions, the sample sizes were  and
and  and the numbers of events were
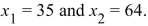
A test is made of the hypothesis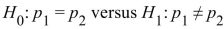
Compute the value of the test statistic.
A) -2.87
B) -2.80
C) -2.93
D) -2.70
and and the numbers of events were A test is made of the hypothesis
Compute the value of the test statistic.
A) -2.87
B) -2.80
C) -2.93
D) -2.70
Question
The following display from a TI-84 Plus calculator presents the results of a hypothesis test for the difference between two means. The sample sizes are 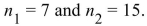
Can you reject rejected at the
  level?
A) No
B) Yes
Can you reject
rejected at the level?A) No
B) Yes
Question
The following MINITAB output display presents the results of a hypothesis test for the difference  between two population means.
Can you reject rejected at the
  level?
A) Yes
B) No
between two population means.Can you reject
rejected at the level?A) Yes
B) No
Question
A test was made of 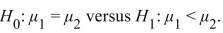
The sample means were and
and  the sample standard deviations were
 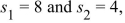 and the sample sizes were
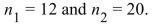
How many degrees of freedom are there for the test statistic, using the simple method?
A) 12
B) 11
C) 13
D) 10
The sample means were
and the sample standard deviations were and the sample sizes were How many degrees of freedom are there for the test statistic, using the simple method?
A) 12
B) 11
C) 13
D) 10
Question
The following display from a TI-84 Plus calculator presents the results of a hypothesis test for the difference between two means. The sample sizes are 
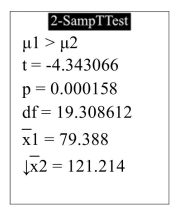
How many degrees of freedom did the calculator use?
A) 20.308612
B) -4.343066
C) 19.308612
D) 0.000158
How many degrees of freedom did the calculator use?
A) 20.308612
B) -4.343066
C) 19.308612
D) 0.000158
Question
Find the critical value 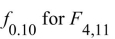
A) 2.73
B) 3.71
C) 3.36
D) 2.54
A) 2.73
B) 3.71
C) 3.36
D) 2.54
Question
Following is a sample of five matched pairs. ) 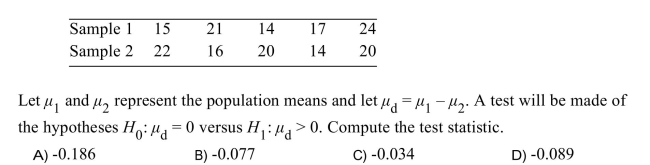
Question
The bowling scores of a professional bowler during a two-day tournament are shown below. 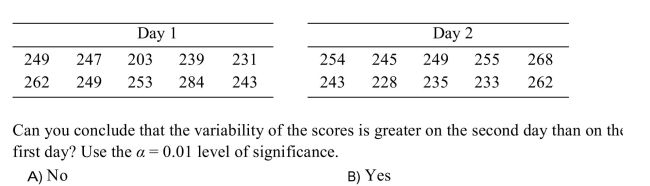
Question
Following is a sample of five matched pairs. ) 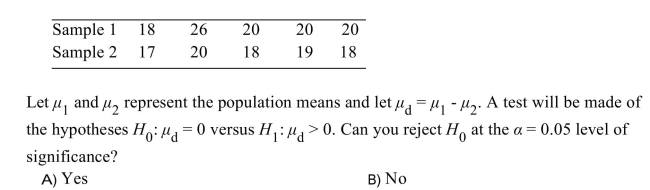
Question
The following MINITAB output display presents the results of a hypothesis test on the difference 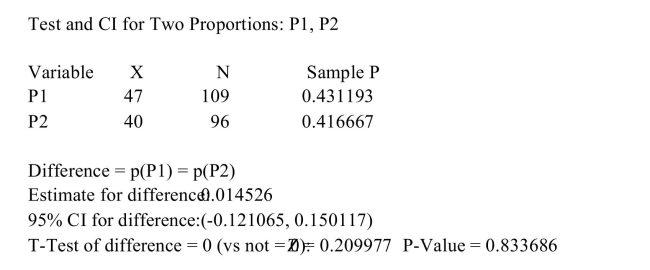 Is this a left-tailed test, a right-tailed test, or a two tailed test?
A)Two-tailed test
B)Left-tailed test
C)Right-tailed test
Is this a left-tailed test, a right-tailed test, or a two tailed test?A)Two-tailed test
B)Left-tailed test
C)Right-tailed test
Question
Question
An F -test with 13 degrees of freedom in the numerator and 9 degrees of freedom in the denominator produced a test statistic whose value was 3.36 . The null and alternate hypotheses were 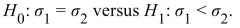
Do you reject at the
  level?
A) Yes
B) No
Do you reject
at the level?A) Yes
B) No
Question
The football coach at State University wishes to determine if there is a change in offensive 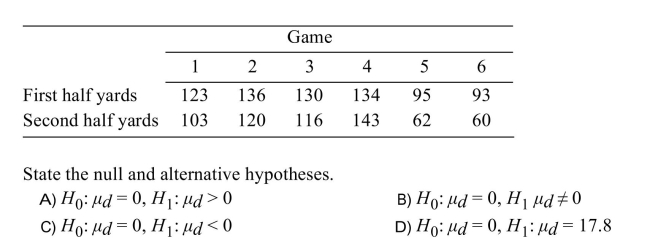
Question
The following display from a TI-84 Plus calculator presents the results of a hypothesis test for the difference between two proportions. The sample sizes are  and
and 
Can you reject rejected at the
  level?
A) No
B) Yes
and Can you reject
rejected at the level?A) No
B) Yes
Question
Question
A broth used to manufacture a pharmaceutical product has its sugar content,) 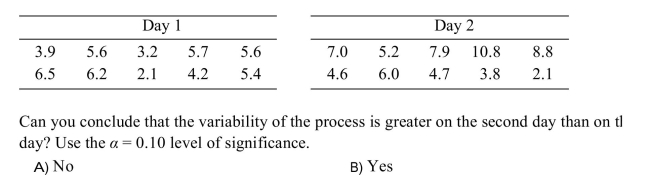
Question
The following MINITAB output display presents the results of a hypothesis test on the difference 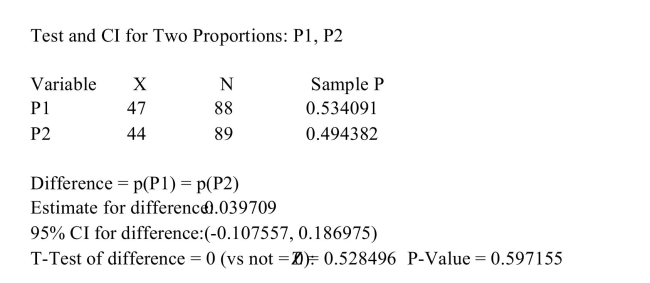 What is the P-value?
A)0.528496
B)0.51412429
C)0.597155
D)0.534091
What is the P-value?A)0.528496
B)0.51412429
C)0.597155
D)0.534091
Question
The football coach at State University wishes to determine if there is a decrease in offensive 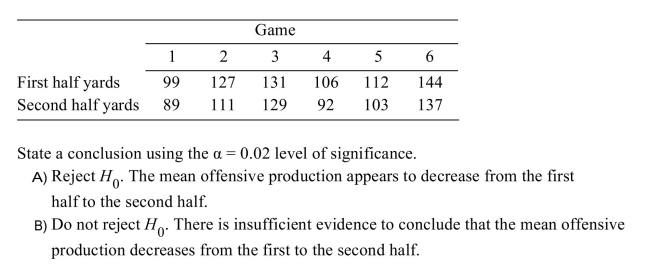
Question
The football coach at State University wishes to determine if there is a decrease in offensive 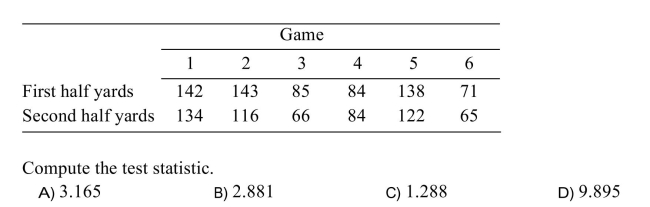
Question
In an experiment to determine whether there is a systematic difference between the weights 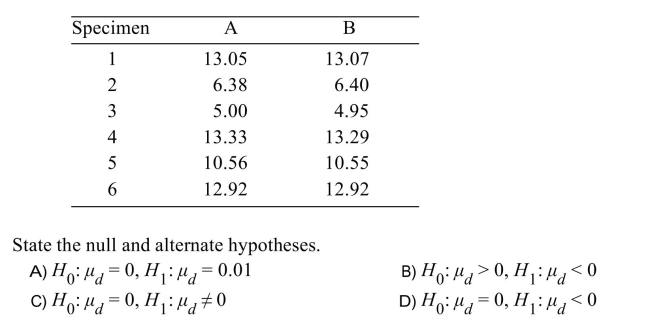
Question
Five null hypotheses were tested,) 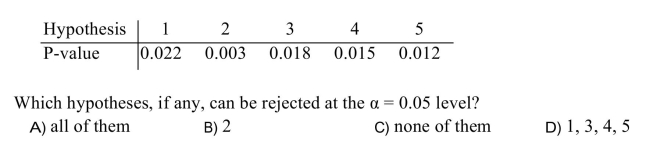
Question
The following MINITAB output display presents the results of a hypothesis test on the difference 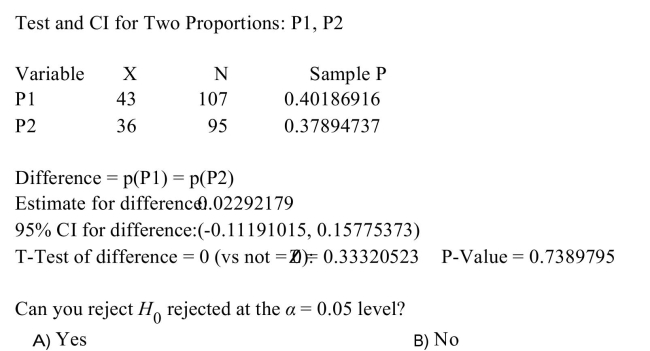
Question
In an experiment to determine whether there is a systematic difference between the weights 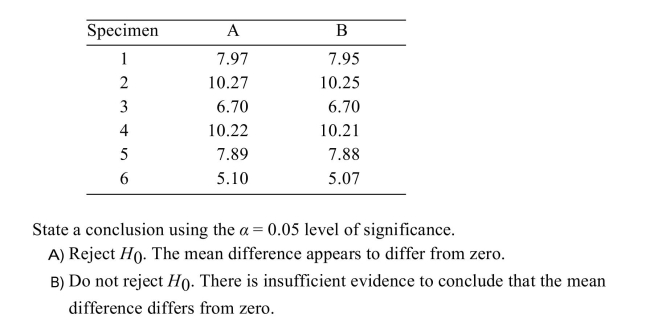
Question
In an experiment to determine whether there is a systematic difference between the weights 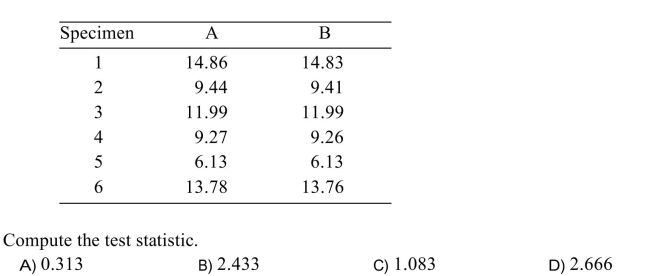

Unlock Deck
Sign up to unlock the cards in this deck!
Unlock Deck
Unlock Deck
1/39
Play
Full screen (f)
Deck 11: Correlation and Regression
1
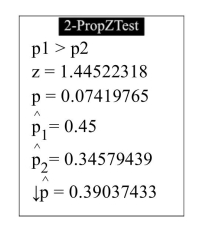
The following display from a TI-84 Plus calculator presents the results of a hypothesis test for the difference between two proportions. The sample sizes are and
Is this a left-tailed test, a right-tailed test, or a two-tailed test?
A) Right-tailed test
B) Two-tailed test
C) Left-tailed test
and Is this a left-tailed test, a right-tailed test, or a two-tailed test?
A) Right-tailed test
B) Two-tailed test
C) Left-tailed test
Right-tailed test
2
A amateur golfer wishes to determine if there is a difference between the drive distances
A
3
The concentration of hexane (a common solvent)was measured in units of micrograms
A
4
A study reported that in a sample of 104 people who watch television news,)
Unlock Deck
Unlock for access to all 39 flashcards in this deck.
Unlock Deck
k this deck
5
The following MINITAB output display presents the results of a hypothesis test for the difference between two population means.
How many degrees of freedom are there for the test statistic?
A) 27
B) 0.029586
C) 28
D) 20.869
between two population means.How many degrees of freedom are there for the test statistic?
A) 27
B) 0.029586
C) 28
D) 20.869
Unlock Deck
Unlock for access to all 39 flashcards in this deck.
Unlock Deck
k this deck
6
In an agricultural experiment,)
Unlock Deck
Unlock for access to all 39 flashcards in this deck.
Unlock Deck
k this deck
7
An automobile manufacturer wishes to test that claim that synthetic motor oil can improve gas
Unlock Deck
Unlock for access to all 39 flashcards in this deck.
Unlock Deck
k this deck
8
The following display from a TI-84 Plus calculator presents the results of a hypothesis test for the difference between two means. The sample sizes are
What is the P -value?
A) 0.142166
B) 1.125505
C) 10.999081
D) 0.857834
What is the P -value?
A) 0.142166
B) 1.125505
C) 10.999081
D) 0.857834
Unlock Deck
Unlock for access to all 39 flashcards in this deck.
Unlock Deck
k this deck
9
A test was made of
The sample means were and the sample standard deviations were and the sample sizes were
Is rejected at the 0.05 level? (Hint: First compute the value of the test statistic.)
A) No
B) Yes
The sample means were
and the sample standard deviations were and the sample sizes were Is
rejected at the 0.05 level? (Hint: First compute the value of the test statistic.)A) No
B) Yes
Unlock Deck
Unlock for access to all 39 flashcards in this deck.
Unlock Deck
k this deck
10
In a test for the difference between two proportions, the sample sizes were and and the numbers of events were
A test is made of the hypothesis
Can you reject rejected at the level?
A) Yes
B) No
and and the numbers of events were A test is made of the hypothesis
Can you reject
rejected at the level?A) Yes
B) No
Unlock Deck
Unlock for access to all 39 flashcards in this deck.
Unlock Deck
k this deck
11
A study reported that in a sample of 81 men,)
Unlock Deck
Unlock for access to all 39 flashcards in this deck.
Unlock Deck
k this deck
12
A test was made of The sample means and the sample standard deviations were and the sample sizes
were
Compute the value of the test statistic.
A) -0.697
B) -4.067
C) -7.164
D) -2.899
The sample means and the sample standard deviations were and the sample sizeswere
Compute the value of the test statistic.
A) -0.697
B) -4.067
C) -7.164
D) -2.899
Unlock Deck
Unlock for access to all 39 flashcards in this deck.
Unlock Deck
k this deck
13
The following display from a TI-84 Plus calculator presents the results of a hypothesis test for the difference between two proportions. The sample sizes are and
What is the P -value?
A) 0.141377
B) 0.507538
C) 1.074153
D) 0.547368
and What is the P -value?
A) 0.141377
B) 0.507538
C) 1.074153
D) 0.547368
Unlock Deck
Unlock for access to all 39 flashcards in this deck.
Unlock Deck
k this deck
14
A garden seed wholesaler wishes to test the claim that tomato seeds germinate faster when each
Unlock Deck
Unlock for access to all 39 flashcards in this deck.
Unlock Deck
k this deck
15
The following MINITAB output display presents the results of a hypothesis test for the difference between two population means.
What is the alternate hypothesis?
A)
B)
C)
D)
between two population means.What is the alternate hypothesis?
A)
B)
C)
D)
Unlock Deck
Unlock for access to all 39 flashcards in this deck.
Unlock Deck
k this deck
16
In a test for the difference between two proportions, the sample sizes were and and the numbers of events were
A test is made of the hypothesis
Compute the value of the test statistic.
A) -2.87
B) -2.80
C) -2.93
D) -2.70
and and the numbers of events were A test is made of the hypothesis
Compute the value of the test statistic.
A) -2.87
B) -2.80
C) -2.93
D) -2.70
Unlock Deck
Unlock for access to all 39 flashcards in this deck.
Unlock Deck
k this deck
17
The following display from a TI-84 Plus calculator presents the results of a hypothesis test for the difference between two means. The sample sizes are
Can you reject rejected at the level?
A) No
B) Yes
Can you reject
rejected at the level?A) No
B) Yes
Unlock Deck
Unlock for access to all 39 flashcards in this deck.
Unlock Deck
k this deck
18
The following MINITAB output display presents the results of a hypothesis test for the difference between two population means.
Can you reject rejected at the level?
A) Yes
B) No
between two population means.Can you reject
rejected at the level?A) Yes
B) No
Unlock Deck
Unlock for access to all 39 flashcards in this deck.
Unlock Deck
k this deck
19
A test was made of
The sample means were and the sample standard deviations were and the sample sizes were
How many degrees of freedom are there for the test statistic, using the simple method?
A) 12
B) 11
C) 13
D) 10
The sample means were
and the sample standard deviations were and the sample sizes were How many degrees of freedom are there for the test statistic, using the simple method?
A) 12
B) 11
C) 13
D) 10
Unlock Deck
Unlock for access to all 39 flashcards in this deck.
Unlock Deck
k this deck
20
The following display from a TI-84 Plus calculator presents the results of a hypothesis test for the difference between two means. The sample sizes are
How many degrees of freedom did the calculator use?
A) 20.308612
B) -4.343066
C) 19.308612
D) 0.000158
How many degrees of freedom did the calculator use?
A) 20.308612
B) -4.343066
C) 19.308612
D) 0.000158
Unlock Deck
Unlock for access to all 39 flashcards in this deck.
Unlock Deck
k this deck
21
Find the critical value
A) 2.73
B) 3.71
C) 3.36
D) 2.54
A) 2.73
B) 3.71
C) 3.36
D) 2.54
Unlock Deck
Unlock for access to all 39 flashcards in this deck.
Unlock Deck
k this deck
22
Following is a sample of five matched pairs. )
Unlock Deck
Unlock for access to all 39 flashcards in this deck.
Unlock Deck
k this deck
23
The bowling scores of a professional bowler during a two-day tournament are shown below.
Unlock Deck
Unlock for access to all 39 flashcards in this deck.
Unlock Deck
k this deck
24
Following is a sample of five matched pairs. )
Unlock Deck
Unlock for access to all 39 flashcards in this deck.
Unlock Deck
k this deck
25
The following MINITAB output display presents the results of a hypothesis test on the difference Is this a left-tailed test, a right-tailed test, or a two tailed test?
A)Two-tailed test
B)Left-tailed test
C)Right-tailed test
Is this a left-tailed test, a right-tailed test, or a two tailed test?A)Two-tailed test
B)Left-tailed test
C)Right-tailed test
Unlock Deck
Unlock for access to all 39 flashcards in this deck.
Unlock Deck
k this deck
26
The football coach at State University wishes to determine if there is a decrease in
Unlock Deck
Unlock for access to all 39 flashcards in this deck.
Unlock Deck
k this deck
27
An F -test with 13 degrees of freedom in the numerator and 9 degrees of freedom in the denominator produced a test statistic whose value was 3.36 . The null and alternate hypotheses were
Do you reject at the level?
A) Yes
B) No
Do you reject
at the level?A) Yes
B) No
Unlock Deck
Unlock for access to all 39 flashcards in this deck.
Unlock Deck
k this deck
28
The football coach at State University wishes to determine if there is a change in offensive
Unlock Deck
Unlock for access to all 39 flashcards in this deck.
Unlock Deck
k this deck
29
The following display from a TI-84 Plus calculator presents the results of a hypothesis test for the difference between two proportions. The sample sizes are and
Can you reject rejected at the level?
A) No
B) Yes
and Can you reject
rejected at the level?A) No
B) Yes
Unlock Deck
Unlock for access to all 39 flashcards in this deck.
Unlock Deck
k this deck
30
In an experiment to determine whether there is a systematic difference between the
Unlock Deck
Unlock for access to all 39 flashcards in this deck.
Unlock Deck
k this deck
31
A broth used to manufacture a pharmaceutical product has its sugar content,)
Unlock Deck
Unlock for access to all 39 flashcards in this deck.
Unlock Deck
k this deck
32
The following MINITAB output display presents the results of a hypothesis test on the difference What is the P-value?
A)0.528496
B)0.51412429
C)0.597155
D)0.534091
What is the P-value?A)0.528496
B)0.51412429
C)0.597155
D)0.534091
Unlock Deck
Unlock for access to all 39 flashcards in this deck.
Unlock Deck
k this deck
33
The football coach at State University wishes to determine if there is a decrease in offensive
Unlock Deck
Unlock for access to all 39 flashcards in this deck.
Unlock Deck
k this deck
34
The football coach at State University wishes to determine if there is a decrease in offensive
Unlock Deck
Unlock for access to all 39 flashcards in this deck.
Unlock Deck
k this deck
35
In an experiment to determine whether there is a systematic difference between the weights
Unlock Deck
Unlock for access to all 39 flashcards in this deck.
Unlock Deck
k this deck
36
Five null hypotheses were tested,)
Unlock Deck
Unlock for access to all 39 flashcards in this deck.
Unlock Deck
k this deck
37
The following MINITAB output display presents the results of a hypothesis test on the difference
Unlock Deck
Unlock for access to all 39 flashcards in this deck.
Unlock Deck
k this deck
38
In an experiment to determine whether there is a systematic difference between the weights
Unlock Deck
Unlock for access to all 39 flashcards in this deck.
Unlock Deck
k this deck
39
In an experiment to determine whether there is a systematic difference between the weights
Unlock Deck
Unlock for access to all 39 flashcards in this deck.
Unlock Deck
k this deck
Unlock Deck
Unlock for access to all 39 flashcards in this deck.


