Deck 3: Numerical Summaries of Data
Full screen (f)
Question
The table below lists the populations,) 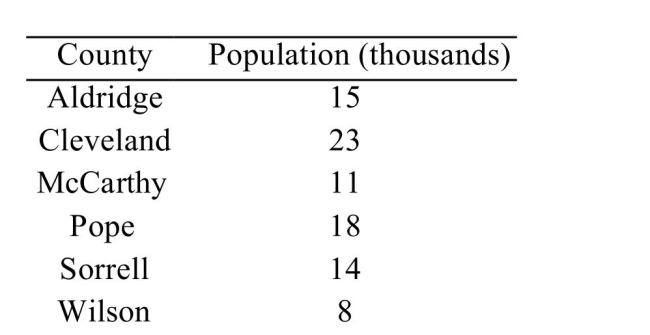
A)15.5 thousand
B)15 thousand
C)14.8 thousand
D)14.5 thousand
A)15.5 thousand
B)15 thousand
C)14.8 thousand
D)14.5 thousand
Question
Find the median of the data in the following stem-and-leaf plot. ) 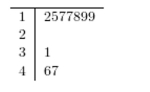
A)27.2
B)17
C)18.5
D)24.1
A)27.2
B)17
C)18.5
D)24.1
Question
Find the median for the following data set: ) 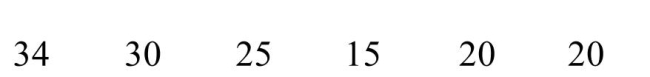
A)22.5
B)19
C)20
D)24.0
A)22.5
B)19
C)20
D)24.0
Question
Question
Question
Use the given frequency distribution to approximate the mean. ) 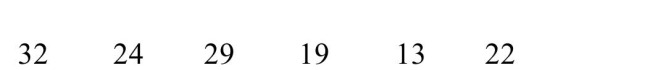
A)13.2
B)26.7
C)13.9
D)14
A)13.2
B)26.7
C)13.9
D)14
Question
Find the mean for the following data set: ) 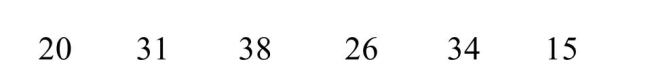
A)23
B)27.3
C)8.0
D)28.5
A)23
B)27.3
C)8.0
D)28.5
Question
For the data shown in the histogram,) 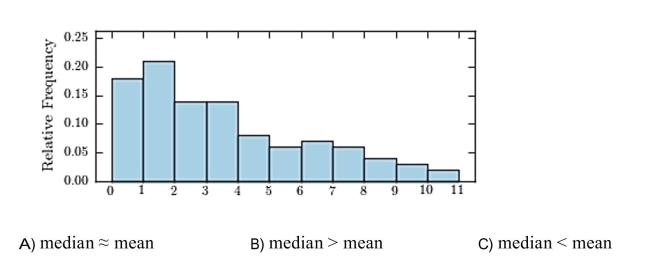
Question
Find the mean of the data in the following stem-and-leaf plot. ) 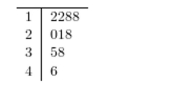
A)12
B)20.5
C)21
D)24.8
A)12
B)20.5
C)21
D)24.8
Question
The following data represent the total price,) 
A)$95.11
B)$38.84
C)$36.82
D)$37.40
A)$95.11
B)$38.84
C)$36.82
D)$37.40
Question
Following are heights,) 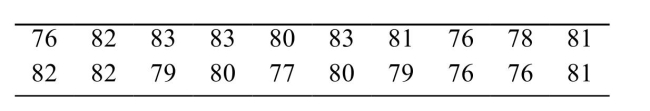
A)70 inches
B)6 inches
C)79.5 inches
D)79.8 inches
A)70 inches
B)6 inches
C)79.5 inches
D)79.8 inches
Question
Find the mode for the following data set: 
A)24
B)16
C)21
D)23.7
A)24
B)16
C)21
D)23.7
Question
The table below lists the populations,) 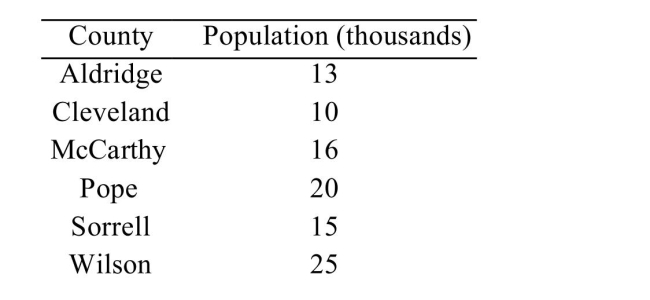
A)15.5 thousand
B)16.5 thousand
C)15 thousand
D)17.5 thousand
A)15.5 thousand
B)16.5 thousand
C)15 thousand
D)17.5 thousand
Question
Find the mean for the following data set: 
A)21.2
B)4.9
C)20
D)14
A)21.2
B)4.9
C)20
D)14
Question
Find the median for the following data set: ) 
A)17.6
B)17
C)15
D)8
A)17.6
B)17
C)15
D)8
Question
Find the mode for the following data set: ) 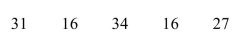
A)16
B)18
C)24.8
D)27
A)16
B)18
C)24.8
D)27
Question
Find the median for the following data set: ) 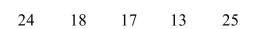
A)19.4
B)12
C)18
D)4.5
A)19.4
B)12
C)18
D)4.5
Question
Find the mean for the following data set: ) 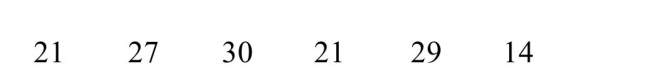
A)26.3
B)25
C)20
D)26
A)26.3
B)25
C)20
D)26
Question
Find the median for the following data set: ) 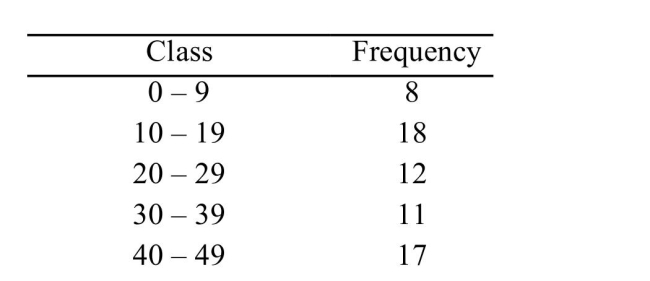
A)6.3
B)23
C)23.2
D)19
A)6.3
B)23
C)23.2
D)19
Question
Find the mode of the data in the following stem-and-leaf plot. ) 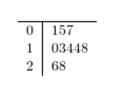
A)13.3
B)12.3
C)13.9
D)14
A)13.3
B)12.3
C)13.9
D)14
Question
Approximate the sample standard deviation given the following frequency distribution. ) 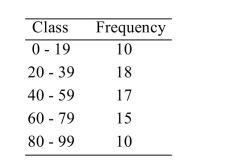
A)25.6
B)25.4
C)645.0
D)654.3
A)25.6
B)25.4
C)645.0
D)654.3
Question
Question
Question
The following data represent the ice cream flavor choices of 20 diners at a college cafeteria.Which flavor ice cream is the mode? 23) 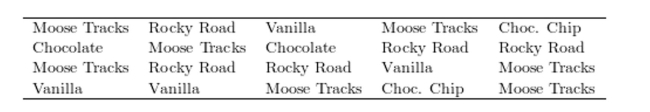
A)Rocky Road
B)Chocolate Chip
C)Chocolate
D)Moose Tracks
A)Rocky Road
B)Chocolate Chip
C)Chocolate
D)Moose Tracks
Question
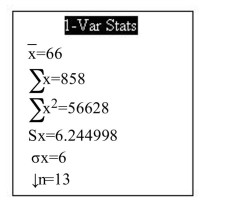
The following population parameters were obtained from a graphing calculator. Assuming the population is bell-shaped, between what two values will approximately 68% of the
Population be?
A)48 to 84
B)60 to 72
C)66 to 84
D)54 to 78
Question
Question
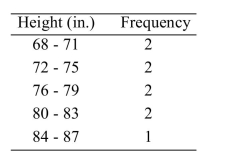
The following table presents the heights (in inches)of a sample of college basketball players. Considering the data to be a population, approximate the variance of the heights.
A)27.7
B)5.6
C)5.3
D)31.1
Question
The following data represent the total price,) 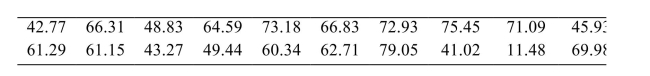
A)$69.98
B)$79.05
C)$67.57
D)$11.48
A)$69.98
B)$79.05
C)$67.57
D)$11.48
Question
Question
Question
Approximate the sample variance given the following frequency distribution. ) 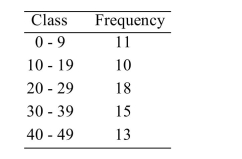
A)13.5
B)181.5
C)178.8
D)13.4
A)13.5
B)181.5
C)178.8
D)13.4
Question
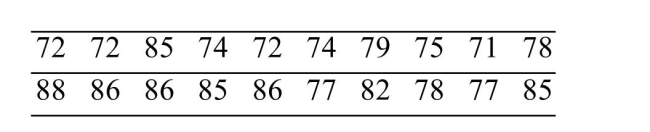
Following are the closing prices (in dollars)of a certain stock for the past 20 trading days.Find the population standard deviation for the closing prices.
A)$9.30
B)$32.99
C)$9.06
D)$138.51
Question
Find the population standard deviation for the following data set: ) 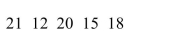
A)3.3
B)11
C)13.7
D)3.7
A)3.3
B)11
C)13.7
D)3.7
Question
Following are heights, in inches, for a sample of college basketball players.Find the sample standard deviation for the heights of the basketball players.
A)17
B)5.8
C)5.6
D)79.1
Question
Find the sample standard deviation for the following data set: ) 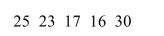
A)27
B)5.8
C)5.2
D)33.7
A)27
B)5.8
C)5.2
D)33.7
Question
Approximate the population variance given the following frequency distribution. ) 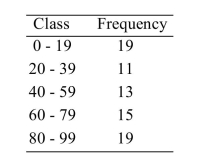
A)923.6
B)30.6
C)935.8
D)30.4
A)923.6
B)30.6
C)935.8
D)30.4
Question
The following data represent the total price,) 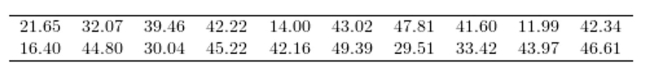
A)$41.88
B)$35.88
C)$130.84
D)$37.40
A)$41.88
B)$35.88
C)$130.84
D)$37.40
Question
Approximate the population standard deviation given the following frequency distribution. ) 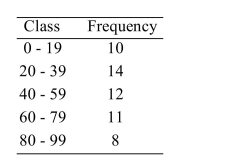
A)26.7
B)699.0
C)711.9
D)26.4
A)26.7
B)699.0
C)711.9
D)26.4
Question
Find the population variance for the following data set: ) 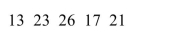
A)5.1
B)13
C)26
D)20.8
A)5.1
B)13
C)26
D)20.8
Question
Find the sample variance for the following data set: ) 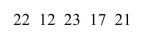
A)4.5
B)20.5
C)11
D)16.4
A)4.5
B)20.5
C)11
D)16.4
Question
A soft-drink bottling company fills and ships soda in plastic bottles with a target volume of 354 milliliters. The filling machinery does not deliver a perfectly consistent volume of liquid to each bottle, and the three quartiles for the fill volume are 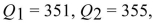 and
and 
A fill volume of 353 mL is considered low. Would a fill volume of 353 \mathrm{~mL} be considered an outlier?
A) No
B) Yes
and A fill volume of 353 mL is considered low. Would a fill volume of 353 \mathrm{~mL} be considered an outlier?
A) No
B) Yes
Question
For which of the following histograms is it appropriate to use the Empirical Rule? 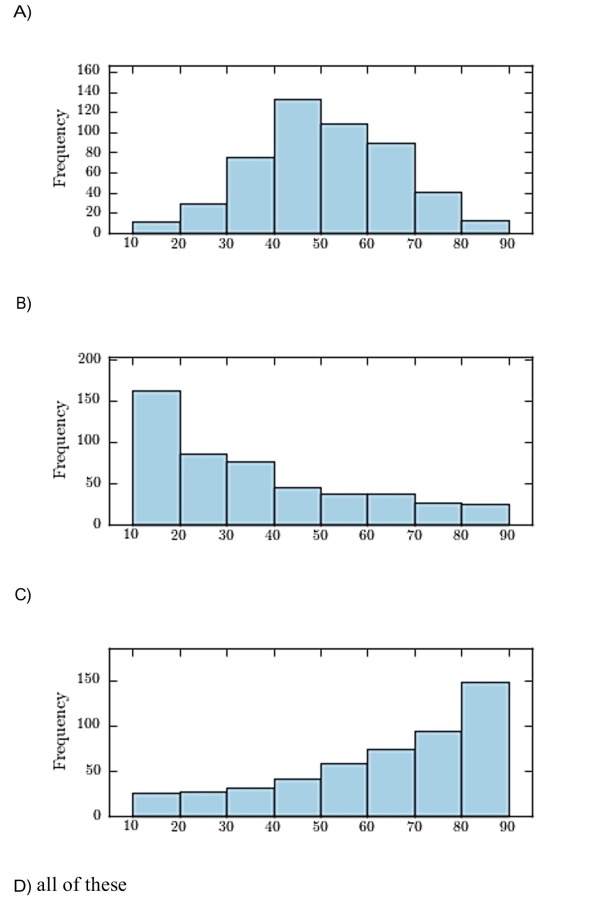
Question
For the data set below,) 
A)65
B)74
C)19
D)9
A)65
B)74
C)19
D)9
Question
A population has a mean  and standard deviation
  What number has a z -score of -0.5 ?
A) -59.5
B) 50.5
C) -6.2
D) -4.5
and standard deviation What number has a z -score of -0.5 ? A) -59.5
B) 50.5
C) -6.2
D) -4.5
Question
For the data set below,) 
A)221
B)176
C)30
D)193
A)221
B)176
C)30
D)193
Question
For the data set below,) 
A)76
B)43.5
C)63
D)61
A)76
B)43.5
C)63
D)61
Question
A soft-drink bottling company fills and ships soda in plastic bottles with a target volume of 354 milliliters. The filling machinery does not deliver a perfectly consistent volume of liquid to each bottle, and the three quartiles for the fill volume are 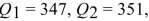 and
and 
Find the IQR.
A) 10.8
B) 5
C) 13.5
D) 9
and Find the IQR.
A) 10.8
B) 5
C) 13.5
D) 9
Question
Question
Question
For the data set below,) 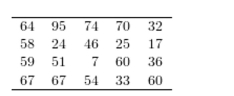
A)34.5
B)30
C)36
D)33
A)34.5
B)30
C)36
D)33
Question
For the data set below,) 
A)206
B)134
C)204 and 206
D)None are outliers.
A)206
B)134
C)204 and 206
D)None are outliers.
Question
Question
Question
Question
Question
Question
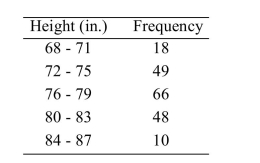
The following table presents the heights (in inches)of a sample of college basketball players. Considering the data to be a population, approximate the standard deviation of the heights.
A)77.6
B)4
C)17.4
D)4.2
Question
For the data set below,) 
A)65
B)68
C)57.5
D)75
A)65
B)68
C)57.5
D)75
Question
For the data set below,) 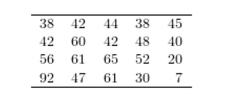
A)7
B)7 and 92
C)7 and 20
D)There are no outliers.
A)7
B)7 and 92
C)7 and 20
D)There are no outliers.
Question
A population has a mean  and standard deviation
  Find the z -score for a population value of 29 .
A) 0.5
B) 7.3
C) 2
D) 8
and standard deviation Find the z -score for a population value of 29 .A) 0.5
B) 7.3
C) 2
D) 8
Question
Construct a boxplot for the data set below. ) 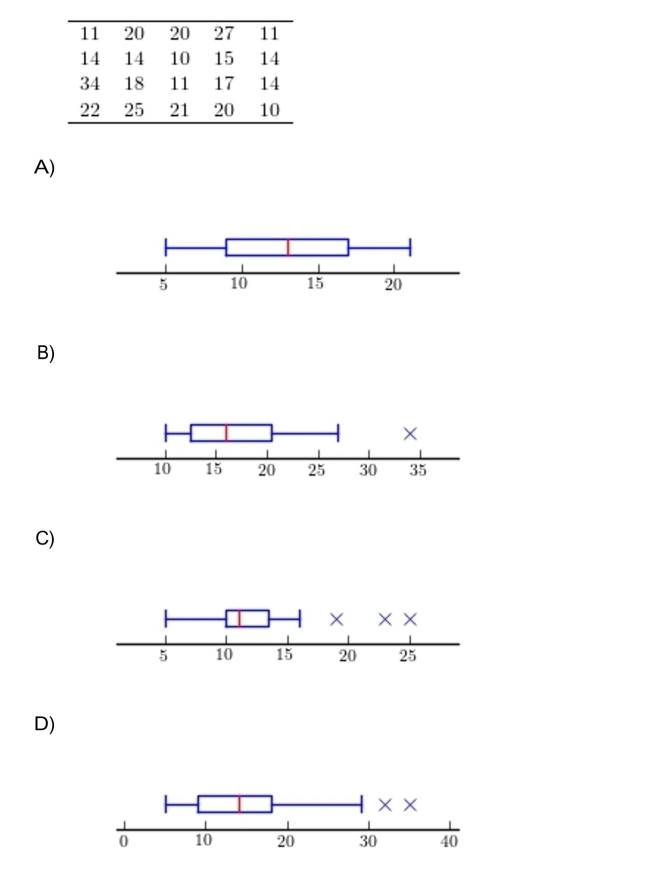
Question
Construct a boxplot for the data set below. ) 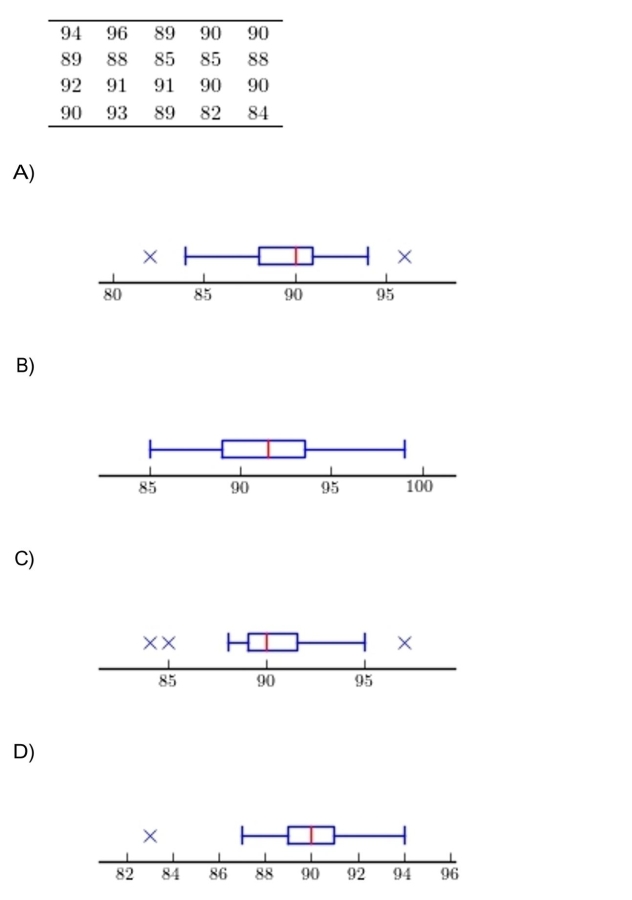

Unlock Deck
Sign up to unlock the cards in this deck!
Unlock Deck
Unlock Deck
1/62
Play
Full screen (f)
Deck 3: Numerical Summaries of Data
1
The table below lists the populations,)
A)15.5 thousand
B)15 thousand
C)14.8 thousand
D)14.5 thousand
A)15.5 thousand
B)15 thousand
C)14.8 thousand
D)14.5 thousand
C
2
Find the median of the data in the following stem-and-leaf plot. )
A)27.2
B)17
C)18.5
D)24.1
A)27.2
B)17
C)18.5
D)24.1
C
3
Find the median for the following data set: )
A)22.5
B)19
C)20
D)24.0
A)22.5
B)19
C)20
D)24.0
A
4
A report states that the mean household income last year for a certain rural county was$46,200 and the median was $54,500. If a histogram were constructed for the incomes of allhouseholds in the county, would you expect it to be skewed to the right, to the left, orapproximately symmetric?
A)approximately symmetric
B)skewed left
C)skewed right
A)approximately symmetric
B)skewed left
C)skewed right
Unlock Deck
Unlock for access to all 62 flashcards in this deck.
Unlock Deck
k this deck
5
Find the mean for the following data set:16 16 26 23 31
A)15
B)22.4
C)16
D)23
A)15
B)22.4
C)16
D)23
Unlock Deck
Unlock for access to all 62 flashcards in this deck.
Unlock Deck
k this deck
6
Use the given frequency distribution to approximate the mean. )
A)13.2
B)26.7
C)13.9
D)14
A)13.2
B)26.7
C)13.9
D)14
Unlock Deck
Unlock for access to all 62 flashcards in this deck.
Unlock Deck
k this deck
7
Find the mean for the following data set: )
A)23
B)27.3
C)8.0
D)28.5
A)23
B)27.3
C)8.0
D)28.5
Unlock Deck
Unlock for access to all 62 flashcards in this deck.
Unlock Deck
k this deck
8
For the data shown in the histogram,)
Unlock Deck
Unlock for access to all 62 flashcards in this deck.
Unlock Deck
k this deck
9
Find the mean of the data in the following stem-and-leaf plot. )
A)12
B)20.5
C)21
D)24.8
A)12
B)20.5
C)21
D)24.8
Unlock Deck
Unlock for access to all 62 flashcards in this deck.
Unlock Deck
k this deck
10
The following data represent the total price,)
A)$95.11
B)$38.84
C)$36.82
D)$37.40
A)$95.11
B)$38.84
C)$36.82
D)$37.40
Unlock Deck
Unlock for access to all 62 flashcards in this deck.
Unlock Deck
k this deck
11
Following are heights,)
A)70 inches
B)6 inches
C)79.5 inches
D)79.8 inches
A)70 inches
B)6 inches
C)79.5 inches
D)79.8 inches
Unlock Deck
Unlock for access to all 62 flashcards in this deck.
Unlock Deck
k this deck
12
Find the mode for the following data set:
A)24
B)16
C)21
D)23.7
A)24
B)16
C)21
D)23.7
Unlock Deck
Unlock for access to all 62 flashcards in this deck.
Unlock Deck
k this deck
13
The table below lists the populations,)
A)15.5 thousand
B)16.5 thousand
C)15 thousand
D)17.5 thousand
A)15.5 thousand
B)16.5 thousand
C)15 thousand
D)17.5 thousand
Unlock Deck
Unlock for access to all 62 flashcards in this deck.
Unlock Deck
k this deck
14
Find the mean for the following data set:
A)21.2
B)4.9
C)20
D)14
A)21.2
B)4.9
C)20
D)14
Unlock Deck
Unlock for access to all 62 flashcards in this deck.
Unlock Deck
k this deck
15
Find the median for the following data set: )
A)17.6
B)17
C)15
D)8
A)17.6
B)17
C)15
D)8
Unlock Deck
Unlock for access to all 62 flashcards in this deck.
Unlock Deck
k this deck
16
Find the mode for the following data set: )
A)16
B)18
C)24.8
D)27
A)16
B)18
C)24.8
D)27
Unlock Deck
Unlock for access to all 62 flashcards in this deck.
Unlock Deck
k this deck
17
Find the median for the following data set: )
A)19.4
B)12
C)18
D)4.5
A)19.4
B)12
C)18
D)4.5
Unlock Deck
Unlock for access to all 62 flashcards in this deck.
Unlock Deck
k this deck
18
Find the mean for the following data set: )
A)26.3
B)25
C)20
D)26
A)26.3
B)25
C)20
D)26
Unlock Deck
Unlock for access to all 62 flashcards in this deck.
Unlock Deck
k this deck
19
Find the median for the following data set: )
A)6.3
B)23
C)23.2
D)19
A)6.3
B)23
C)23.2
D)19
Unlock Deck
Unlock for access to all 62 flashcards in this deck.
Unlock Deck
k this deck
20
Find the mode of the data in the following stem-and-leaf plot. )
A)13.3
B)12.3
C)13.9
D)14
A)13.3
B)12.3
C)13.9
D)14
Unlock Deck
Unlock for access to all 62 flashcards in this deck.
Unlock Deck
k this deck
21
Approximate the sample standard deviation given the following frequency distribution. )
A)25.6
B)25.4
C)645.0
D)654.3
A)25.6
B)25.4
C)645.0
D)654.3
Unlock Deck
Unlock for access to all 62 flashcards in this deck.
Unlock Deck
k this deck
22
A data set contains three unique values. Which of the following must be true?
A)mean = median = midrange
B)median = midrange
C)mean = median
D)none of these
A)mean = median = midrange
B)median = midrange
C)mean = median
D)none of these
Unlock Deck
Unlock for access to all 62 flashcards in this deck.
Unlock Deck
k this deck
23
The following population parameters were obtained from a graphing calculator. Assuming the population is bell-shaped, approximately what percentage of the population values
Are between 43 and 67?
A)68%
B)95%
C)almost all (greater than 95%)
D)32%
Are between 43 and 67?
A)68%
B)95%
C)almost all (greater than 95%)
D)32%
Unlock Deck
Unlock for access to all 62 flashcards in this deck.
Unlock Deck
k this deck
24
The following data represent the ice cream flavor choices of 20 diners at a college cafeteria.Which flavor ice cream is the mode? 23)
A)Rocky Road
B)Chocolate Chip
C)Chocolate
D)Moose Tracks
A)Rocky Road
B)Chocolate Chip
C)Chocolate
D)Moose Tracks
Unlock Deck
Unlock for access to all 62 flashcards in this deck.
Unlock Deck
k this deck
25
The following population parameters were obtained from a graphing calculator. Assuming the population is bell-shaped, between what two values will approximately 68% of the
Population be?
A)48 to 84
B)60 to 72
C)66 to 84
D)54 to 78
Unlock Deck
Unlock for access to all 62 flashcards in this deck.
Unlock Deck
k this deck
26
A student has an average of 88 on seven chapter tests. If the student's scores on six of thetests are 91, 91, 92, 82, 91, and 70, what was the score on the remaining test?
A)88
B)99
C)81
D)86
A)88
B)99
C)81
D)86
Unlock Deck
Unlock for access to all 62 flashcards in this deck.
Unlock Deck
k this deck
27
The following table presents the heights (in inches)of a sample of college basketball players. Considering the data to be a population, approximate the variance of the heights.
A)27.7
B)5.6
C)5.3
D)31.1
Unlock Deck
Unlock for access to all 62 flashcards in this deck.
Unlock Deck
k this deck
28
The following data represent the total price,)
A)$69.98
B)$79.05
C)$67.57
D)$11.48
A)$69.98
B)$79.05
C)$67.57
D)$11.48
Unlock Deck
Unlock for access to all 62 flashcards in this deck.
Unlock Deck
k this deck
29
A data set has a median of 43, and four of the numbers in the data set are less thanmedian. The data set contains a total of n numbers.If n is even, and none of the numbers in the data set are equal to 43, what is the value ofn?
A)9
B)12
C)6
D)8
A)9
B)12
C)6
D)8
Unlock Deck
Unlock for access to all 62 flashcards in this deck.
Unlock Deck
k this deck
30
A data set has a median of 41, and four of the numbers in the data set are less thanmedian. The data set contains a total of n numbers.If n is odd, and exactly one number in the data set is equal to 41, what is the value of n?
A)9
B)13
C)12
D)11
A)9
B)13
C)12
D)11
Unlock Deck
Unlock for access to all 62 flashcards in this deck.
Unlock Deck
k this deck
31
Approximate the sample variance given the following frequency distribution. )
A)13.5
B)181.5
C)178.8
D)13.4
A)13.5
B)181.5
C)178.8
D)13.4
Unlock Deck
Unlock for access to all 62 flashcards in this deck.
Unlock Deck
k this deck
32
Following are the closing prices (in dollars)of a certain stock for the past 20 trading days.Find the population standard deviation for the closing prices.
A)$9.30
B)$32.99
C)$9.06
D)$138.51
Unlock Deck
Unlock for access to all 62 flashcards in this deck.
Unlock Deck
k this deck
33
Find the population standard deviation for the following data set: )
A)3.3
B)11
C)13.7
D)3.7
A)3.3
B)11
C)13.7
D)3.7
Unlock Deck
Unlock for access to all 62 flashcards in this deck.
Unlock Deck
k this deck
34
Following are heights, in inches, for a sample of college basketball players.Find the sample standard deviation for the heights of the basketball players.
A)17
B)5.8
C)5.6
D)79.1
Unlock Deck
Unlock for access to all 62 flashcards in this deck.
Unlock Deck
k this deck
35
Find the sample standard deviation for the following data set: )
A)27
B)5.8
C)5.2
D)33.7
A)27
B)5.8
C)5.2
D)33.7
Unlock Deck
Unlock for access to all 62 flashcards in this deck.
Unlock Deck
k this deck
36
Approximate the population variance given the following frequency distribution. )
A)923.6
B)30.6
C)935.8
D)30.4
A)923.6
B)30.6
C)935.8
D)30.4
Unlock Deck
Unlock for access to all 62 flashcards in this deck.
Unlock Deck
k this deck
37
The following data represent the total price,)
A)$41.88
B)$35.88
C)$130.84
D)$37.40
A)$41.88
B)$35.88
C)$130.84
D)$37.40
Unlock Deck
Unlock for access to all 62 flashcards in this deck.
Unlock Deck
k this deck
38
Approximate the population standard deviation given the following frequency distribution. )
A)26.7
B)699.0
C)711.9
D)26.4
A)26.7
B)699.0
C)711.9
D)26.4
Unlock Deck
Unlock for access to all 62 flashcards in this deck.
Unlock Deck
k this deck
39
Find the population variance for the following data set: )
A)5.1
B)13
C)26
D)20.8
A)5.1
B)13
C)26
D)20.8
Unlock Deck
Unlock for access to all 62 flashcards in this deck.
Unlock Deck
k this deck
40
Find the sample variance for the following data set: )
A)4.5
B)20.5
C)11
D)16.4
A)4.5
B)20.5
C)11
D)16.4
Unlock Deck
Unlock for access to all 62 flashcards in this deck.
Unlock Deck
k this deck
41
A soft-drink bottling company fills and ships soda in plastic bottles with a target volume of 354 milliliters. The filling machinery does not deliver a perfectly consistent volume of liquid to each bottle, and the three quartiles for the fill volume are and
A fill volume of 353 mL is considered low. Would a fill volume of 353 \mathrm{~mL} be considered an outlier?
A) No
B) Yes
and A fill volume of 353 mL is considered low. Would a fill volume of 353 \mathrm{~mL} be considered an outlier?
A) No
B) Yes
Unlock Deck
Unlock for access to all 62 flashcards in this deck.
Unlock Deck
k this deck
42
For which of the following histograms is it appropriate to use the Empirical Rule?
Unlock Deck
Unlock for access to all 62 flashcards in this deck.
Unlock Deck
k this deck
43
For the data set below,)
A)65
B)74
C)19
D)9
A)65
B)74
C)19
D)9
Unlock Deck
Unlock for access to all 62 flashcards in this deck.
Unlock Deck
k this deck
44
A population has a mean and standard deviation What number has a z -score of -0.5 ?
A) -59.5
B) 50.5
C) -6.2
D) -4.5
and standard deviation What number has a z -score of -0.5 ? A) -59.5
B) 50.5
C) -6.2
D) -4.5
Unlock Deck
Unlock for access to all 62 flashcards in this deck.
Unlock Deck
k this deck
45
For the data set below,)
A)221
B)176
C)30
D)193
A)221
B)176
C)30
D)193
Unlock Deck
Unlock for access to all 62 flashcards in this deck.
Unlock Deck
k this deck
46
For the data set below,)
A)76
B)43.5
C)63
D)61
A)76
B)43.5
C)63
D)61
Unlock Deck
Unlock for access to all 62 flashcards in this deck.
Unlock Deck
k this deck
47
A soft-drink bottling company fills and ships soda in plastic bottles with a target volume of 354 milliliters. The filling machinery does not deliver a perfectly consistent volume of liquid to each bottle, and the three quartiles for the fill volume are and
Find the IQR.
A) 10.8
B) 5
C) 13.5
D) 9
and Find the IQR.
A) 10.8
B) 5
C) 13.5
D) 9
Unlock Deck
Unlock for access to all 62 flashcards in this deck.
Unlock Deck
k this deck
48
A consumer advocacy group tested the "on-air" lifetimes of a random sample of 162 cellphone batteries. The mean lifetime was 2.9 hours with a standard deviation of 0.4 hours.The lifetimes are approximately bell-shaped. Estimate the number of batteries withlifetimes between 2.1 hours and 3.7 hours.
A)110
B)8
C)almost all (greater than 154)
D)154
A)110
B)8
C)almost all (greater than 154)
D)154
Unlock Deck
Unlock for access to all 62 flashcards in this deck.
Unlock Deck
k this deck
49
A data set has a mean of 129 and a standard deviation of 24. Compute the coefficient ofvariation.
A)4.47
B)24.00
C)5.26
D)0.19
A)4.47
B)24.00
C)5.26
D)0.19
Unlock Deck
Unlock for access to all 62 flashcards in this deck.
Unlock Deck
k this deck
50
For the data set below,)
A)34.5
B)30
C)36
D)33
A)34.5
B)30
C)36
D)33
Unlock Deck
Unlock for access to all 62 flashcards in this deck.
Unlock Deck
k this deck
51
For the data set below,)
A)206
B)134
C)204 and 206
D)None are outliers.
A)206
B)134
C)204 and 206
D)None are outliers.
Unlock Deck
Unlock for access to all 62 flashcards in this deck.
Unlock Deck
k this deck
52
A data set has a mean of 60 and a standard deviation of 5. Which of the following mightpossibly be true?
A)More than 90% of the data values are between 45 and 75.
B)No less than 30% of the data values are less than 50 or greater than 70.
C)No more than 50% of the data values are between 50 and 70.
D)At least 15% of the data values are less than 45 or greater than 75.
A)More than 90% of the data values are between 45 and 75.
B)No less than 30% of the data values are less than 50 or greater than 70.
C)No more than 50% of the data values are between 50 and 70.
D)At least 15% of the data values are less than 45 or greater than 75.
Unlock Deck
Unlock for access to all 62 flashcards in this deck.
Unlock Deck
k this deck
53
Gina and Stewart are surf-fishing on the Atlantic coast, where both bluefish andpompano are common catches. The mean length of a bluefish is 288 millimeters with astandard deviation of 51 mm. For pompano, the mean is 129 mm with a standarddeviation of 40 mm.Stewart caught a bluefish that was 321 mm long. What was the z-score for this length?
A)0.65
B)321
C)6.29
D)4.8
A)0.65
B)321
C)6.29
D)4.8
Unlock Deck
Unlock for access to all 62 flashcards in this deck.
Unlock Deck
k this deck
54
The completion times for a certain marathon race was 2.9 hours with a standarddeviation of 0.5 hours. What can you determine about these data by using Chebyshev'sInequality with K = 3?
A)No more than 88.9% of the completion times are between 1.4 hours and 4.4 hours.
B)At most 75% of the completion times are between 1.4 hours and 4.4 hours.
C)At least 88.9% of the completion times are between 1.4 hours and 4.4 hours.
D)At least 75% of the completion times are between 1.4 hours and 4.4 hours.
Unlock Deck
Unlock for access to all 62 flashcards in this deck.
Unlock Deck
k this deck
55
A paint manufacturer discovers that the mean volume of paint in a gallon-sized pail is 1gallon with a standard deviation of 0.05 gallons. The paint volumes are approximatelybell-shaped. Estimate the percent of pails with volumes between 0.90 gallons and 1.10gallons.
A)95%
B)5%
C)almost all (greater than 95%)
D)68%
A)95%
B)5%
C)almost all (greater than 95%)
D)68%
Unlock Deck
Unlock for access to all 62 flashcards in this deck.
Unlock Deck
k this deck
56
Gina and Stewart are surf-fishing on the Atlantic coast, where both bluefish andpompano are common catches. The mean length of a bluefish is 261 millimeters with astandard deviation of 45 mm. For pompano, the mean is 156 mm with a standarddeviation of 24 mm.Stewart caught a bluefish that was 286 mm long, and Gina caught a pompano that was181 mm long. Who caught the longer fish, relative to fish of the same species?
A)Stewart
B)Neither. Relative to its respective species, the fish are the same length.
C)Gina
A)Stewart
B)Neither. Relative to its respective species, the fish are the same length.
C)Gina
Unlock Deck
Unlock for access to all 62 flashcards in this deck.
Unlock Deck
k this deck
57
The following table presents the heights (in inches)of a sample of college basketball players. Considering the data to be a population, approximate the standard deviation of the heights.
A)77.6
B)4
C)17.4
D)4.2
Unlock Deck
Unlock for access to all 62 flashcards in this deck.
Unlock Deck
k this deck
58
For the data set below,)
A)65
B)68
C)57.5
D)75
A)65
B)68
C)57.5
D)75
Unlock Deck
Unlock for access to all 62 flashcards in this deck.
Unlock Deck
k this deck
59
For the data set below,)
A)7
B)7 and 92
C)7 and 20
D)There are no outliers.
A)7
B)7 and 92
C)7 and 20
D)There are no outliers.
Unlock Deck
Unlock for access to all 62 flashcards in this deck.
Unlock Deck
k this deck
60
A population has a mean and standard deviation Find the z -score for a population value of 29 .
A) 0.5
B) 7.3
C) 2
D) 8
and standard deviation Find the z -score for a population value of 29 .A) 0.5
B) 7.3
C) 2
D) 8
Unlock Deck
Unlock for access to all 62 flashcards in this deck.
Unlock Deck
k this deck
61
Construct a boxplot for the data set below. )
Unlock Deck
Unlock for access to all 62 flashcards in this deck.
Unlock Deck
k this deck
62
Construct a boxplot for the data set below. )
Unlock Deck
Unlock for access to all 62 flashcards in this deck.
Unlock Deck
k this deck
Unlock Deck
Unlock for access to all 62 flashcards in this deck.


