Deck 8: Hypothesis Testing
Full screen (f)
Question
The following MINITAB output presents a 95% confidence interval. ) 
Question
A population has a standard deviation  How large a sample must be drawn so that a 98% confidence interval for
  will have a margin of error equal to 4.2 ?
A) 226
B) 126
C) 11
D) 5
How large a sample must be drawn so that a 98% confidence interval for will have a margin of error equal to 4.2 ?A) 226
B) 126
C) 11
D) 5
Question
The following MINITAB output presents a 95% confidence interval. ) 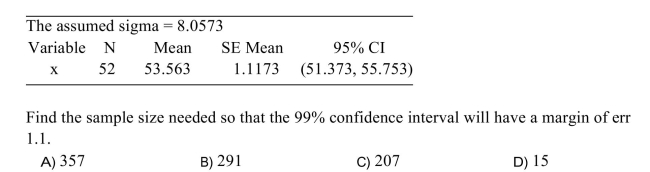
Question
The three confidence intervals below were constructed from the same sample. ) 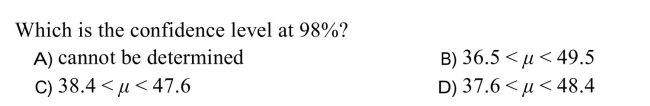
Question
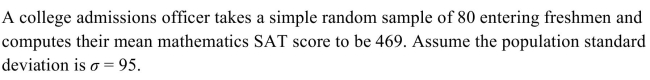
Assume the population standard deviation is
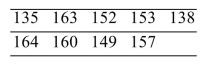
 and that the population is approximat normal. Construct a 95 % confidence interval for the mean price for all the TI-89's being sold over the internet.
A) (134.0,170.6)
B) (145.6,159.1)
C) (145.5,159.2)
D) (97.5,207.2)
Question
Question
Find the critical value  needed to construct a(n) 80% confidence interval.
A) 0.84
B) 1.08
C) 1.28
D) 2.10
needed to construct a(n) 80% confidence interval.A) 0.84
B) 1.08
C) 1.28
D) 2.10
Question
A sample of 132 tobacco smokers who recently completed a new smoking-cessationprogram were asked to rate the effectiveness of the program on a scale of 1 to 10 
Question
The following MINITAB output presents a 95% confidence interval. ) 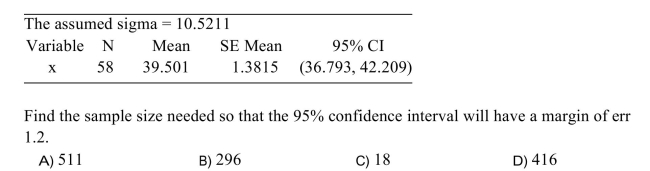
Question
A sample of size n=11 has a sample mean  and sample standard deviation s=2.4 . Construct a 95 % confidence interval for the population mean
A) (14.0,17.2)
B) (15.1,16.1)
C) (14.3,16.9)
D) (14.6,16.6)
and sample standard deviation s=2.4 . Construct a 95 % confidence interval for the population mean A) (14.0,17.2)
B) (15.1,16.1)
C) (14.3,16.9)
D) (14.6,16.6)
Question
A sample of 37 light bulbs had a mean lifetime of 584 hours. A 95 % confidence interval for the population mean was 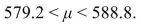
Which one of the following statements is the correct interpretation of the results?
A) None of these are true.
B) 95 % of the light bulbs in the sample had lifetimes between 579.2 hours and 588.8 hours
C) The probability that the population mean is between 579.2 hours and 588.8 hours is 0.95 .
D) We are 95 % confident that the mean lifetime of all the bulbs in the population is between 579.2 hours and 588.8 hours.
Question
Question
Find the critical value  needed to construct a(n) 99.5% confidence interval.
A) 2.81
B) 2.53
C) 3.71
D) 2.58
needed to construct a(n) 99.5% confidence interval.A) 2.81
B) 2.53
C) 3.71
D) 2.58
Question
Find the critical value  needed to construct a confidence interval of the given level with the given sample size.
Level 95 % , sample size 11
A) 1.812
B) 1.960
C) 2.228
D) 2.201
needed to construct a confidence interval of the given level with the given sample size.Level 95 % , sample size 11
A) 1.812
B) 1.960
C) 2.228
D) 2.201
Question
A sample of size n=15 is drawn from an approximately normal population whose standard deviation is  The sample mean is
  Construct a 90 % confidence interval for
A) (30.28,51.32)
B) (40.80,43.14)
C) (39.80,41.80)
D) 38.46,43.14
The sample mean is Construct a 90 % confidence interval for A) (30.28,51.32)
B) (40.80,43.14)
C) (39.80,41.80)
D) 38.46,43.14
Question
A sample of size n=22 is drawn from a normal population. Find the critical value  needed to construct a 98 % confidence interval.
A) 2.326
B) 2.508
C) 2.189
D) 2.518
needed to construct a 98 % confidence interval.A) 2.326
B) 2.508
C) 2.189
D) 2.518
Question
A random sample of 9 TI-89 Titanium calculators being sold over the internet had the following 
Question
The following MINITAB output presents a 95% confidence interval. ) 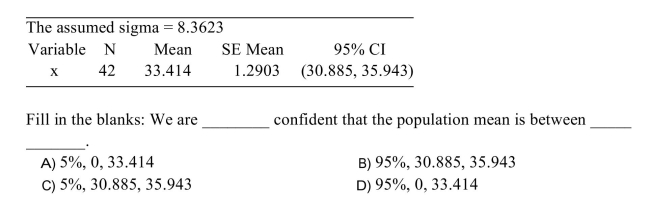
Question
A sample of size n=50 is drawn from a population whose standard deviation is  Find the margin of error for a 90 % confidence interval for
A) 3.37
B) 0.80
C) 0.89
D) 2.05
Find the margin of error for a 90 % confidence interval for A) 3.37
B) 0.80
C) 0.89
D) 2.05
Question
A simple random sample of kitchen toasters is to be taken to determine the mean operational lifetime in hours. Assume that the lifetimes are normally distributed with population standard deviation 
Find the sample size needed so that a 95 % confidence interval for the mean lifetime will have a margin of error of 4 .
A) 2
B) 385
C) 189
D) 14
Find the sample size needed so that a 95 % confidence interval for the mean lifetime will have a margin of error of 4 .
A) 2
B) 385
C) 189
D) 14
Question
The following MINITAB output presents a confidence interval for a population mean. ) 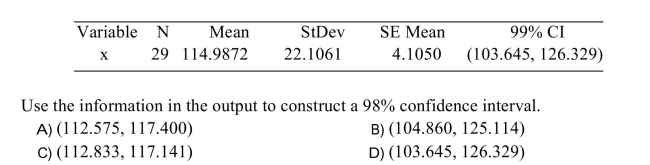
Question
The following display from a TI-84 Plus calculator presents a 95% confidence interval. ) 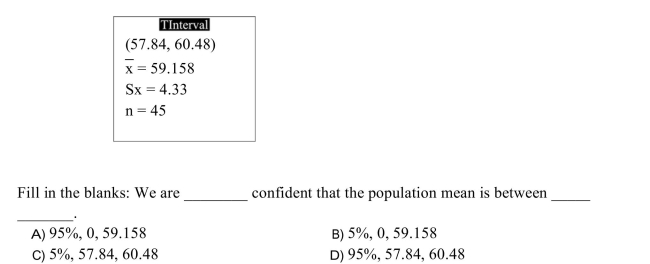
Question
Question
The following MINITAB output presents a confidence interval for a proportion. ) 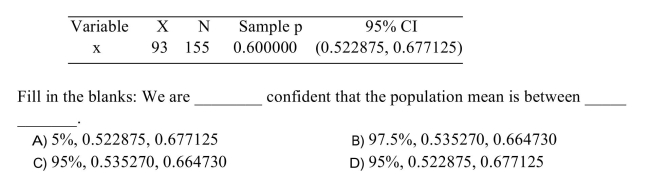
Question
Question
Question
The following display from a TI-84 Plus calculator presents a 99% confidence interval for a 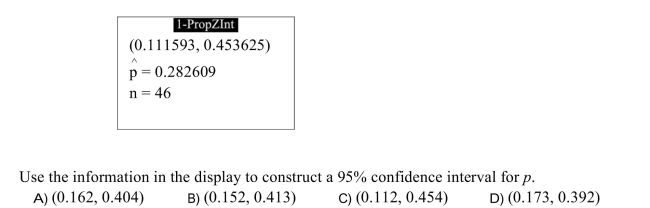
Question
Question
Six measurements were made of the magnesium ion concentration (in parts per million,) 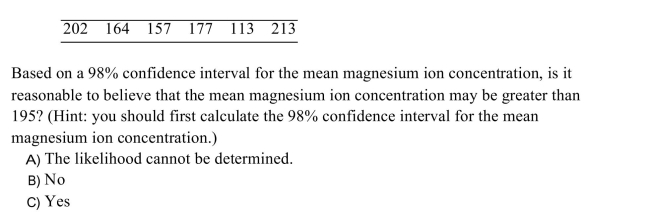
Question
Question
Question
Question
Boxes of raisins are labeled as containing 22 ounces. ) 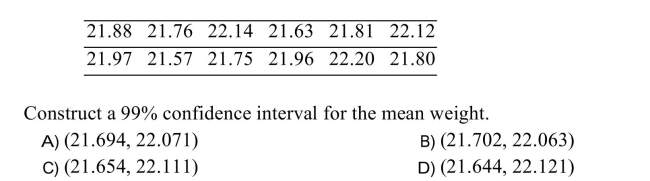
Question
Question
Question
The following MINITAB output presents a confidence interval for a population mean. ) 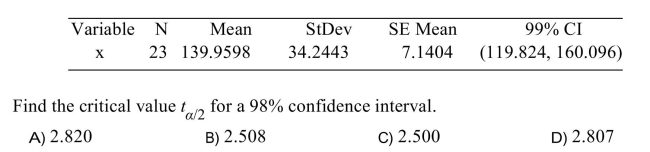
Question
Question
Six measurements were made of the magnesium ion concentration (in parts per million,) 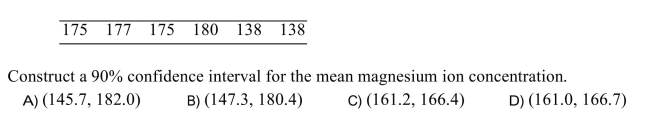
Question
The following display from a TI-84 Plus calculator presents a 99% confidence interval for a _ and 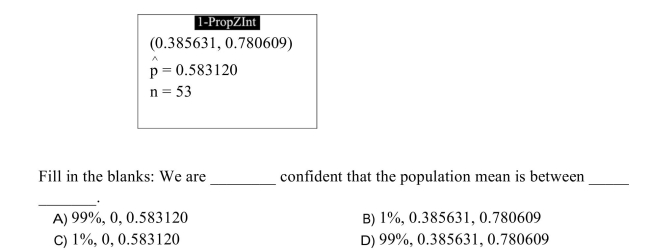
Question
The following MINITAB output presents a confidence interval for a population mean. ) 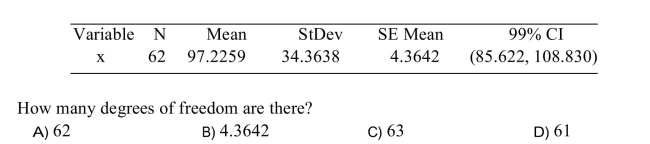
Question
The following MINITAB output presents a confidence interval for a proportion. ) 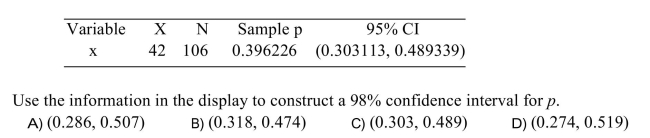
Question
Construct a 95% confidence interval for the population standard deviation  if a sample of size 18 has standard deviation s=20 .
A) (15.70,28.00)
B) (14.69,28.74)
C) (15.01,29.98)
D) (15.11,29.58)
if a sample of size 18 has standard deviation s=20 .A) (15.70,28.00)
B) (14.69,28.74)
C) (15.01,29.98)
D) (15.11,29.58)
Question
Question
Question
Scores on the math SAT are normally distributed. A sample of 23 SAT scores had a standard deviation s=79 . Construct a 95 % confidence interval for the population standard deviation 
A) (63.62,105.49)
B) (60.05,108.38)
C) (61.10,111.81)
D) (61.40,110.82)
A) (63.62,105.49)
B) (60.05,108.38)
C) (61.10,111.81)
D) (61.40,110.82)
Question
Following are the heights in inches of 12 two-year-old apple trees. ) 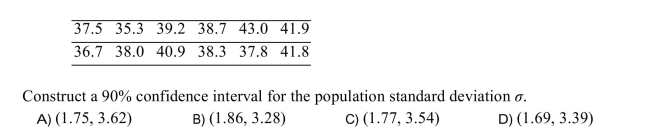

Unlock Deck
Sign up to unlock the cards in this deck!
Unlock Deck
Unlock Deck
1/46
Play
Full screen (f)
Deck 8: Hypothesis Testing
1
The following MINITAB output presents a 95% confidence interval. )
C
2
A population has a standard deviation How large a sample must be drawn so that a 98% confidence interval for will have a margin of error equal to 4.2 ?
A) 226
B) 126
C) 11
D) 5
How large a sample must be drawn so that a 98% confidence interval for will have a margin of error equal to 4.2 ?A) 226
B) 126
C) 11
D) 5
126
3
The following MINITAB output presents a 95% confidence interval. )
A
4
The three confidence intervals below were constructed from the same sample. )
Unlock Deck
Unlock for access to all 46 flashcards in this deck.
Unlock Deck
k this deck
5
Assume the population standard deviation is
and that the population is approximat normal. Construct a 95 % confidence interval for the mean price for all the TI-89's being sold over the internet.A) (134.0,170.6)
B) (145.6,159.1)
C) (145.5,159.2)
D) (97.5,207.2)
Unlock Deck
Unlock for access to all 46 flashcards in this deck.
Unlock Deck
k this deck
6
Find the level of the confidence interval that has the given critical value.1.53
A)93.7%
B)87.40%
C)12.6%
D)6.3%
A)93.7%
B)87.40%
C)12.6%
D)6.3%
Unlock Deck
Unlock for access to all 46 flashcards in this deck.
Unlock Deck
k this deck
7
Find the critical value needed to construct a(n) 80% confidence interval.
A) 0.84
B) 1.08
C) 1.28
D) 2.10
needed to construct a(n) 80% confidence interval.A) 0.84
B) 1.08
C) 1.28
D) 2.10
Unlock Deck
Unlock for access to all 46 flashcards in this deck.
Unlock Deck
k this deck
8
A sample of 132 tobacco smokers who recently completed a new smoking-cessationprogram were asked to rate the effectiveness of the program on a scale of 1 to 10
Unlock Deck
Unlock for access to all 46 flashcards in this deck.
Unlock Deck
k this deck
9
The following MINITAB output presents a 95% confidence interval. )
Unlock Deck
Unlock for access to all 46 flashcards in this deck.
Unlock Deck
k this deck
10
A sample of size n=11 has a sample mean and sample standard deviation s=2.4 . Construct a 95 % confidence interval for the population mean
A) (14.0,17.2)
B) (15.1,16.1)
C) (14.3,16.9)
D) (14.6,16.6)
and sample standard deviation s=2.4 . Construct a 95 % confidence interval for the population mean A) (14.0,17.2)
B) (15.1,16.1)
C) (14.3,16.9)
D) (14.6,16.6)
Unlock Deck
Unlock for access to all 46 flashcards in this deck.
Unlock Deck
k this deck
11
A sample of 37 light bulbs had a mean lifetime of 584 hours. A 95 % confidence interval for the population mean was
Which one of the following statements is the correct interpretation of the results?
A) None of these are true.
B) 95 % of the light bulbs in the sample had lifetimes between 579.2 hours and 588.8 hours
C) The probability that the population mean is between 579.2 hours and 588.8 hours is 0.95 .
D) We are 95 % confident that the mean lifetime of all the bulbs in the population is between 579.2 hours and 588.8 hours.
Unlock Deck
Unlock for access to all 46 flashcards in this deck.
Unlock Deck
k this deck
12
Unlock Deck
Unlock for access to all 46 flashcards in this deck.
Unlock Deck
k this deck
13
Find the critical value needed to construct a(n) 99.5% confidence interval.
A) 2.81
B) 2.53
C) 3.71
D) 2.58
needed to construct a(n) 99.5% confidence interval.A) 2.81
B) 2.53
C) 3.71
D) 2.58
Unlock Deck
Unlock for access to all 46 flashcards in this deck.
Unlock Deck
k this deck
14
Find the critical value needed to construct a confidence interval of the given level with the given sample size.
Level 95 % , sample size 11
A) 1.812
B) 1.960
C) 2.228
D) 2.201
needed to construct a confidence interval of the given level with the given sample size.Level 95 % , sample size 11
A) 1.812
B) 1.960
C) 2.228
D) 2.201
Unlock Deck
Unlock for access to all 46 flashcards in this deck.
Unlock Deck
k this deck
15
A sample of size n=15 is drawn from an approximately normal population whose standard deviation is The sample mean is Construct a 90 % confidence interval for
A) (30.28,51.32)
B) (40.80,43.14)
C) (39.80,41.80)
D) 38.46,43.14
The sample mean is Construct a 90 % confidence interval for A) (30.28,51.32)
B) (40.80,43.14)
C) (39.80,41.80)
D) 38.46,43.14
Unlock Deck
Unlock for access to all 46 flashcards in this deck.
Unlock Deck
k this deck
16
A sample of size n=22 is drawn from a normal population. Find the critical value needed to construct a 98 % confidence interval.
A) 2.326
B) 2.508
C) 2.189
D) 2.518
needed to construct a 98 % confidence interval.A) 2.326
B) 2.508
C) 2.189
D) 2.518
Unlock Deck
Unlock for access to all 46 flashcards in this deck.
Unlock Deck
k this deck
17
A random sample of 9 TI-89 Titanium calculators being sold over the internet had the following
Unlock Deck
Unlock for access to all 46 flashcards in this deck.
Unlock Deck
k this deck
18
The following MINITAB output presents a 95% confidence interval. )
Unlock Deck
Unlock for access to all 46 flashcards in this deck.
Unlock Deck
k this deck
19
A sample of size n=50 is drawn from a population whose standard deviation is Find the margin of error for a 90 % confidence interval for
A) 3.37
B) 0.80
C) 0.89
D) 2.05
Find the margin of error for a 90 % confidence interval for A) 3.37
B) 0.80
C) 0.89
D) 2.05
Unlock Deck
Unlock for access to all 46 flashcards in this deck.
Unlock Deck
k this deck
20
A simple random sample of kitchen toasters is to be taken to determine the mean operational lifetime in hours. Assume that the lifetimes are normally distributed with population standard deviation
Find the sample size needed so that a 95 % confidence interval for the mean lifetime will have a margin of error of 4 .
A) 2
B) 385
C) 189
D) 14
Find the sample size needed so that a 95 % confidence interval for the mean lifetime will have a margin of error of 4 .
A) 2
B) 385
C) 189
D) 14
Unlock Deck
Unlock for access to all 46 flashcards in this deck.
Unlock Deck
k this deck
21
The following MINITAB output presents a confidence interval for a population mean. )
Unlock Deck
Unlock for access to all 46 flashcards in this deck.
Unlock Deck
k this deck
22
The following display from a TI-84 Plus calculator presents a 95% confidence interval. )
Unlock Deck
Unlock for access to all 46 flashcards in this deck.
Unlock Deck
k this deck
23
Find the margin of error for the given confidence level and values of x and n . x=79, n=187 , confidence level 98%
A) 0.08402
B) 0.4225
C) 0.03612
D) 0.5775
A) 0.08402
B) 0.4225
C) 0.03612
D) 0.5775
Unlock Deck
Unlock for access to all 46 flashcards in this deck.
Unlock Deck
k this deck
24
The following MINITAB output presents a confidence interval for a proportion. )
Unlock Deck
Unlock for access to all 46 flashcards in this deck.
Unlock Deck
k this deck
25
A researcher wants to construct a 98% confidence interval for the proportion ofelementary school students in Seward County who receive free or reduced-price schoollunches. A state-wide survey indicates that the proportion is 0.45. Using this estimate,what sample size is needed so that the confidence interval will have a margin of error of0.08?
A)210
B)8
C)17
D)149
A)210
B)8
C)17
D)149
Unlock Deck
Unlock for access to all 46 flashcards in this deck.
Unlock Deck
k this deck
26
Twenty-three concrete blocks were sampled and tested for crushing strength in order toestimate the proportion that were sufficiently strong for a certain application. Eighteen ofthe 23 blocks were sufficiently strong. Use the small-sample method to construct a 95%confidence interval for the proportion of blocks that are sufficiently strong.
A)(0.575, 0.906)
B)(0.614, 0.951)
C)(0.562, 0.920)
D)(0.602, 0.879)
A)(0.575, 0.906)
B)(0.614, 0.951)
C)(0.562, 0.920)
D)(0.602, 0.879)
Unlock Deck
Unlock for access to all 46 flashcards in this deck.
Unlock Deck
k this deck
27
The following display from a TI-84 Plus calculator presents a 99% confidence interval for a
Unlock Deck
Unlock for access to all 46 flashcards in this deck.
Unlock Deck
k this deck
28
In a survey of 447 registered voters, 157 of them wished to see Mayor Waffleskate loseher next election. The Waffleskate campaign claims that no more than 27% of registeredvoters wish to see her defeated. Does the 98% confidence interval for the proportionsupport this claim? (Hint: you should first construct the 98% confidence interval for theproportion of registered voters who whish to see Waffleskate defeated.)(0.299, 0.404)
A)The reasonableness of the claim cannot be determined.
B)No
C)Yes
A)The reasonableness of the claim cannot be determined.
B)No
C)Yes
Unlock Deck
Unlock for access to all 46 flashcards in this deck.
Unlock Deck
k this deck
29
Six measurements were made of the magnesium ion concentration (in parts per million,)
Unlock Deck
Unlock for access to all 46 flashcards in this deck.
Unlock Deck
k this deck
30
Find the point estimate for the given values of x and n .
x=104, n=202
A) 104
B) 0.4851
C) 0.03516
D) 0.5149
x=104, n=202
A) 104
B) 0.4851
C) 0.03516
D) 0.5149
Unlock Deck
Unlock for access to all 46 flashcards in this deck.
Unlock Deck
k this deck
31
Find the standard error for the given values of x and n .
x=75, n=182
A) 0.03649
B) 75
C) 0.5879
D) 0.4121
x=75, n=182
A) 0.03649
B) 75
C) 0.5879
D) 0.4121
Unlock Deck
Unlock for access to all 46 flashcards in this deck.
Unlock Deck
k this deck
32
A researcher wants to construct a 98% confidence interval for the proportion ofelementary school students in Seward County who receive free or reduced-price schoollunches. What sample size is needed so that the confidence interval will have a margin oferror of 0.09?
A)119
B)7
C)167
D)16
A)119
B)7
C)167
D)16
Unlock Deck
Unlock for access to all 46 flashcards in this deck.
Unlock Deck
k this deck
33
Boxes of raisins are labeled as containing 22 ounces. )
Unlock Deck
Unlock for access to all 46 flashcards in this deck.
Unlock Deck
k this deck
34
Use the given data to construct a confidence interval of the requested level.
x=114, n=228 , confidence level 90%
A) (0.446,0.554)
B) (0.410,0.590)
C) (0.467,0.533)
D) (0.458,0.542)
x=114, n=228 , confidence level 90%
A) (0.446,0.554)
B) (0.410,0.590)
C) (0.467,0.533)
D) (0.458,0.542)
Unlock Deck
Unlock for access to all 46 flashcards in this deck.
Unlock Deck
k this deck
35
In a survey of 314 registered voters, 156 of them wished to see Mayor Waffleskate loseher next election. Construct a 95% confidence interval for the proportion of registeredvoter who want to see Mayor Waffleskate defeated.
A)0.450, 0.543)
B)(0.469, 0.525)
C)(0.441, 0.552)
D)(0.388, 0.605)
A)0.450, 0.543)
B)(0.469, 0.525)
C)(0.441, 0.552)
D)(0.388, 0.605)
Unlock Deck
Unlock for access to all 46 flashcards in this deck.
Unlock Deck
k this deck
36
The following MINITAB output presents a confidence interval for a population mean. )
Unlock Deck
Unlock for access to all 46 flashcards in this deck.
Unlock Deck
k this deck
37
In a survey of 302 registered voters, 167 of them wished to see Mayor Waffleskate loseher next election. Find a point estimate for the proportion of registered voters who wishto see Mayor Waffleskate defeated.
A)0.02861
B)0.5530
C)0.4470
D)167
A)0.02861
B)0.5530
C)0.4470
D)167
Unlock Deck
Unlock for access to all 46 flashcards in this deck.
Unlock Deck
k this deck
38
Six measurements were made of the magnesium ion concentration (in parts per million,)
Unlock Deck
Unlock for access to all 46 flashcards in this deck.
Unlock Deck
k this deck
39
The following display from a TI-84 Plus calculator presents a 99% confidence interval for a _ and
Unlock Deck
Unlock for access to all 46 flashcards in this deck.
Unlock Deck
k this deck
40
The following MINITAB output presents a confidence interval for a population mean. )
Unlock Deck
Unlock for access to all 46 flashcards in this deck.
Unlock Deck
k this deck
41
The following MINITAB output presents a confidence interval for a proportion. )
Unlock Deck
Unlock for access to all 46 flashcards in this deck.
Unlock Deck
k this deck
42
Construct a 95% confidence interval for the population standard deviation if a sample of size 18 has standard deviation s=20 .
A) (15.70,28.00)
B) (14.69,28.74)
C) (15.01,29.98)
D) (15.11,29.58)
if a sample of size 18 has standard deviation s=20 .A) (15.70,28.00)
B) (14.69,28.74)
C) (15.01,29.98)
D) (15.11,29.58)
Unlock Deck
Unlock for access to all 46 flashcards in this deck.
Unlock Deck
k this deck
43
There are no testbank questions for this section.
Unlock Deck
Unlock for access to all 46 flashcards in this deck.
Unlock Deck
k this deck
44
Find the critical values for a 95% confidence interval using the chi-square distributionwith 14 degrees of freedom.
A)5.009, 24.736
B)5.892, 22.362
C)6.571, 23.685
D)5.629, 26.119
A)5.009, 24.736
B)5.892, 22.362
C)6.571, 23.685
D)5.629, 26.119
Unlock Deck
Unlock for access to all 46 flashcards in this deck.
Unlock Deck
k this deck
45
Scores on the math SAT are normally distributed. A sample of 23 SAT scores had a standard deviation s=79 . Construct a 95 % confidence interval for the population standard deviation
A) (63.62,105.49)
B) (60.05,108.38)
C) (61.10,111.81)
D) (61.40,110.82)
A) (63.62,105.49)
B) (60.05,108.38)
C) (61.10,111.81)
D) (61.40,110.82)
Unlock Deck
Unlock for access to all 46 flashcards in this deck.
Unlock Deck
k this deck
46
Following are the heights in inches of 12 two-year-old apple trees. )
Unlock Deck
Unlock for access to all 46 flashcards in this deck.
Unlock Deck
k this deck
Unlock Deck
Unlock for access to all 46 flashcards in this deck.


