Deck 3: Review of Statistics
Full screen (f)
Question
Question
Question
Question
Question
Question
Question
Question
When you are testing a hypothesis against a two-sided alternative, then the alternative is written as 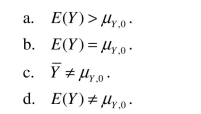
Question
Question
Question
Question
Question
Question
The power of the test is 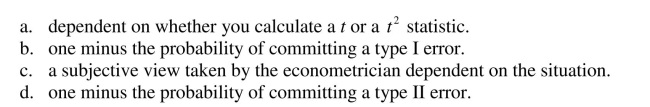
Question
A scatterplot 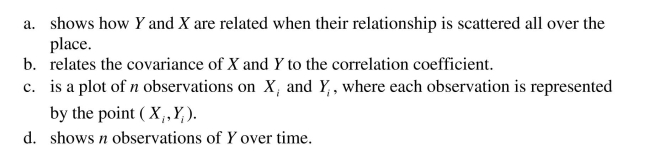
Question
Question
Question
A type II error 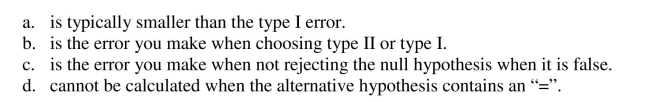
Question
Question
Question
Degrees of freedom 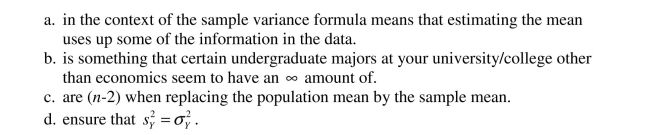
Question
The t-statistic has the following distribution: 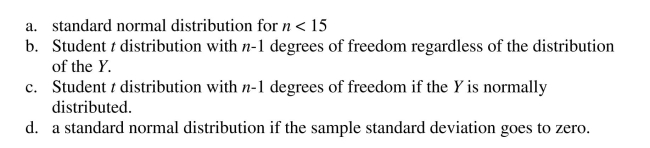
Question
Question
Question
The sample covariance can be calculated in any of the following ways, with the exception of: 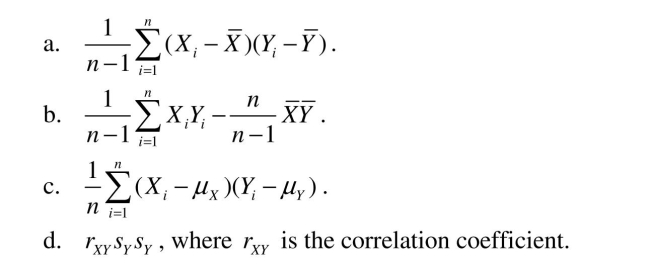
Question
The t-statistic is defined as follows: 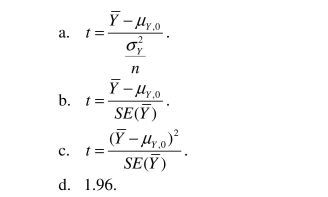
Question
Question
The standard error for the difference in means if two random variables M and W , when the two population variances are different, is 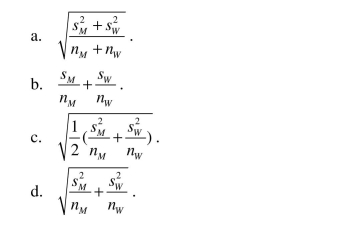
Question
Adult males are taller, on average, than adult females.Visiting two recent American
Youth Soccer Organization (AYSO)under 12 year old (U12)soccer matches on a
Saturday, you do not observe an obvious difference in the height of boys and girls of
that age.You suggest to your little sister that she collect data on height and gender of
children in 4th to 6th grade as part of her science project.The accompanying table shows
her findings.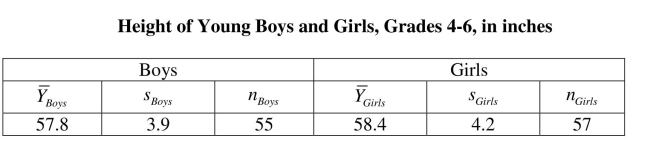 (a)Let your null hypothesis be that there is no difference in the height of females and
males at this age level.Specify the alternative hypothesis.
Youth Soccer Organization (AYSO)under 12 year old (U12)soccer matches on a
Saturday, you do not observe an obvious difference in the height of boys and girls of
that age.You suggest to your little sister that she collect data on height and gender of
children in 4th to 6th grade as part of her science project.The accompanying table shows
her findings.
(a)Let your null hypothesis be that there is no difference in the height of females andmales at this age level.Specify the alternative hypothesis.
Question
Your textbook defines the correlation coefficient as follows: 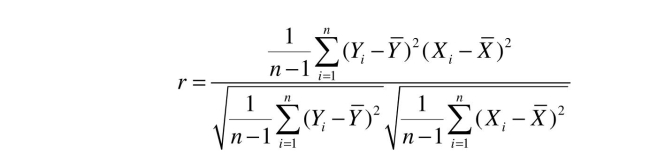 Another textbook gives an alternative formula:
 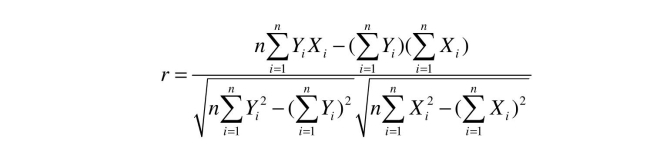 Prove that the two are the same.
22
Another textbook gives an alternative formula: Prove that the two are the same.22
Question
The following statement about the sample correlation coefficient is true. 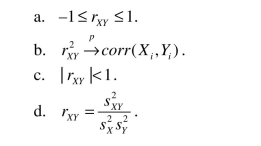
Question
For each of the accompanying scatterplots for several pairs of variables, indicate
whether you expect a positive or negative correlation coefficient between the two
variables, and the likely magnitude of it (you can use a small range).
(a)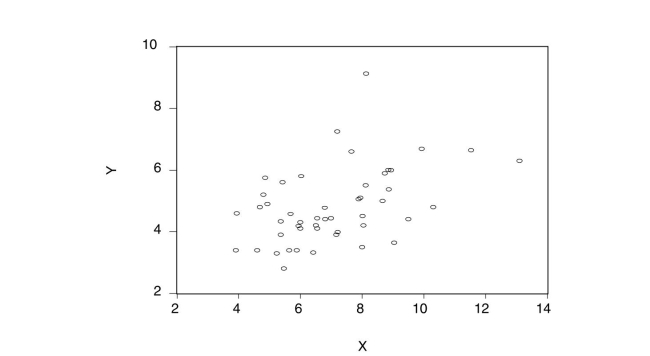
whether you expect a positive or negative correlation coefficient between the two
variables, and the likely magnitude of it (you can use a small range).
(a)
Question
Question
During the last few days before a presidential election, there is a frenzy of voting
intention surveys.On a given day, quite often there are conflicting results from three
major polls.
(a)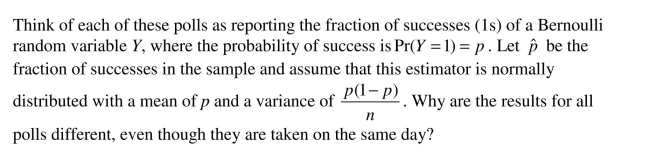
intention surveys.On a given day, quite often there are conflicting results from three
major polls.
(a)
Question
Your textbook defined the covariance between X and Y as follows: 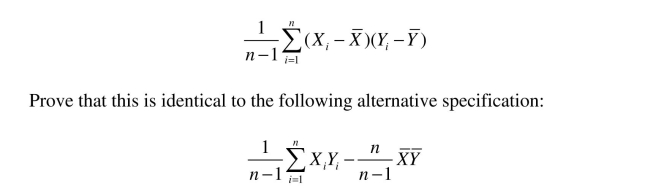
Question
The power of the test 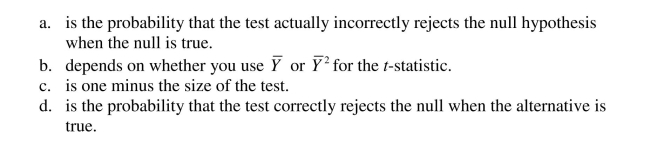
Question
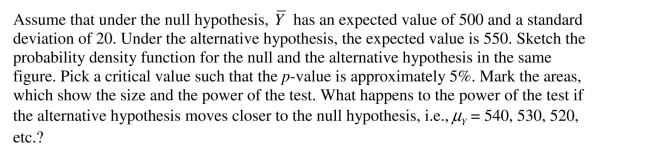
Question
 (a)Sketch the two distributions under the null hypothesis and the alternative hypothesis.
 Question
Question
Question
Question
Question
L 
Question
Some policy advisors have argued that education should be subsidized in developing
countries to reduce fertility rates.To investigate whether or not education and fertility
are correlated, you collect data on population growth rates (Y)and education (X)for 86
countries.Given the sums below, compute the sample correlation:
countries to reduce fertility rates.To investigate whether or not education and fertility
are correlated, you collect data on population growth rates (Y)and education (X)for 86
countries.Given the sums below, compute the sample correlation:
Question
Your textbook states that when you test for differences in means and you assume that
the two population variances are equal, then an estimator of the population variance is
the following "pooled" estimator: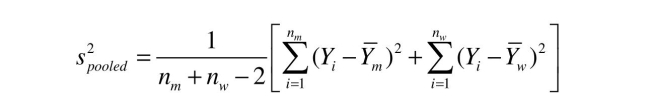 2
2
Explain why this pooled estimator can be looked at as the weighted average of the two
variances.
the two population variances are equal, then an estimator of the population variance is
the following "pooled" estimator:
2Explain why this pooled estimator can be looked at as the weighted average of the two
variances.
Question
The accompanying table lists the height (STUDHGHT)in inches and weight (WEIGHT)
in pounds of five college students.Calculate the correlation coefficient.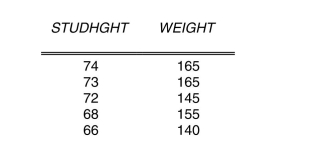
in pounds of five college students.Calculate the correlation coefficient.
Question
(Advanced) Unbiasedness and small variance are desirable properties of estimators. However, you can imagine situations where a trade-off exists between the two: one estimator may be have a small bias but a much smaller variance than another, unbiased estimator. The concept of "mean square error" estimator combines the two concepts. Let  be an estimator of
  Then the mean square error (MSE) is defined as follows:
(Hint: subtract and add
be an estimator of Then the mean square error (MSE) is defined as follows: (Hint: subtract and add
Question
Question
Question
IQs of individuals are normally distributed with a mean of 100 and a standard deviation
of 16.If you sampled students at your college and assumed, as the null hypothesis, that
they had the same IQ as the population, then in a random sample of size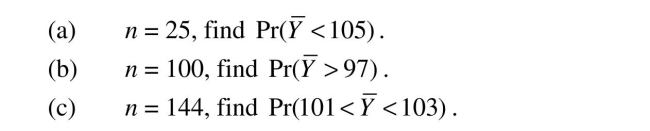
of 16.If you sampled students at your college and assumed, as the null hypothesis, that
they had the same IQ as the population, then in a random sample of size
Question
L 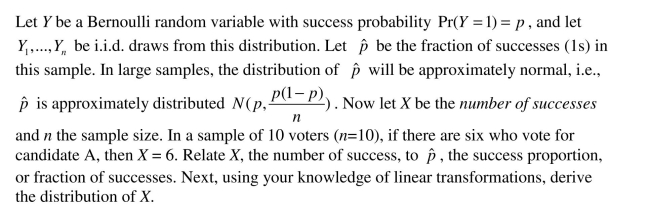 24
24
24 Question
 25
25 Question
Consider the following alternative estimator for the population mean: 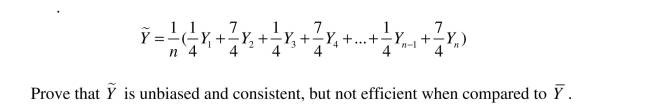
Question
When you perform hypothesis tests, you are faced with four possible outcomes
described in the accompanying table.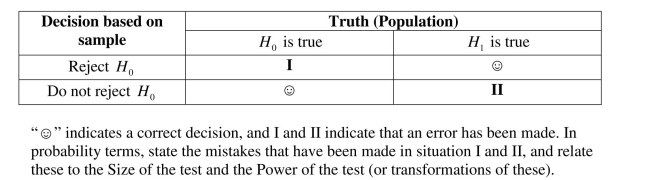
described in the accompanying table.
Question
Question
L 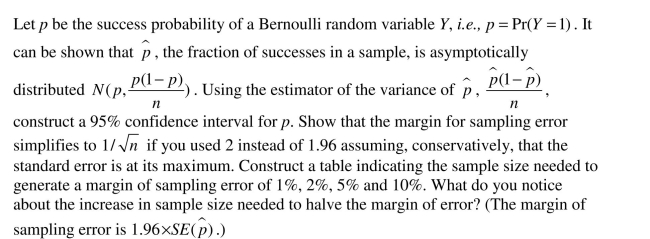

Unlock Deck
Sign up to unlock the cards in this deck!
Unlock Deck
Unlock Deck
1/56
Play
Full screen (f)
Deck 3: Review of Statistics
1
A large p -value implies
A) rejection of the null hypothesis.
B) a large t -statistic.
C) a large
D) that the observed value is consistent with the null hypothesis.
A) rejection of the null hypothesis.
B) a large t -statistic.
C) a large
D) that the observed value is consistent with the null hypothesis.
that the observed value is consistent with the null hypothesis.
2
The standard error of
is given by the following formula:
A)
B)
C)
D)
is given by the following formula:
A)
B)
C)
D)
3
An estimator of the population value is more efficient when compared to another estimator , if
A)
B) it has a smaller variance.
C) its c.d.f. is flatter than that of the other estimator.
D) both estimators are unbiased, and
A)
B) it has a smaller variance.
C) its c.d.f. is flatter than that of the other estimator.
D) both estimators are unbiased, and
both estimators are unbiased, and
4
An estimator of the population value is unbiased if
A)
B) has the smallest variance of all estimators.
C)
D)
A)
B) has the smallest variance of all estimators.
C)
D)
Unlock Deck
Unlock for access to all 56 flashcards in this deck.
Unlock Deck
k this deck
5
To derive the least squares estimator , you find the estimator m which minimizes
A)
B)
C)
D) .
A)
B)
C)
D) .
Unlock Deck
Unlock for access to all 56 flashcards in this deck.
Unlock Deck
k this deck
6
An estimator is
A)an estimate.
B)a formula that gives an efficient guess of the true population value.
C)a random variable.
D)a nonrandom number.
A)an estimate.
B)a formula that gives an efficient guess of the true population value.
C)a random variable.
D)a nonrandom number.
Unlock Deck
Unlock for access to all 56 flashcards in this deck.
Unlock Deck
k this deck
7
An estimator of the population value is consistent if
A)
B) its mean square error is the smallest possible.
C) Y is normally distributed.
D)
A)
B) its mean square error is the smallest possible.
C) Y is normally distributed.
D)
Unlock Deck
Unlock for access to all 56 flashcards in this deck.
Unlock Deck
k this deck
8
When you are testing a hypothesis against a two-sided alternative, then the alternative is written as
Unlock Deck
Unlock for access to all 56 flashcards in this deck.
Unlock Deck
k this deck
9
If the null hypothesis states , then a two-sided alternative hypothesis is
A)
B)
C)
D)
A)
B)
C)
D)
Unlock Deck
Unlock for access to all 56 flashcards in this deck.
Unlock Deck
k this deck
10
Among all unbiased estimators that are weighted averages of
is
A) the only consistent estimator of
B) the most efficient estimator of
C) a number which, by definition, cannot have a variance.
D) the most unbiased estimator of
is
A) the only consistent estimator of
B) the most efficient estimator of
C) a number which, by definition, cannot have a variance.
D) the most unbiased estimator of
Unlock Deck
Unlock for access to all 56 flashcards in this deck.
Unlock Deck
k this deck
11
A type I error is
A)always the same as (1-type II)error.
B)the error you make when rejecting the null hypothesis when it is true.
C)the error you make when rejecting the alternative hypothesis when it is true.
D)always 5%.
A)always the same as (1-type II)error.
B)the error you make when rejecting the null hypothesis when it is true.
C)the error you make when rejecting the alternative hypothesis when it is true.
D)always 5%.
Unlock Deck
Unlock for access to all 56 flashcards in this deck.
Unlock Deck
k this deck
12
The following types of statistical inference are used throughout econometrics, with the exception of
A)confidence intervals.
B)hypothesis testing.
C)calibration.
D)estimation.
A)confidence intervals.
B)hypothesis testing.
C)calibration.
D)estimation.
Unlock Deck
Unlock for access to all 56 flashcards in this deck.
Unlock Deck
k this deck
13
The p -value is defined as follows:
A) p=0.05 .
B)
C)
D)
A) p=0.05 .
B)
C)
D)
Unlock Deck
Unlock for access to all 56 flashcards in this deck.
Unlock Deck
k this deck
14
The power of the test is
Unlock Deck
Unlock for access to all 56 flashcards in this deck.
Unlock Deck
k this deck
15
A scatterplot
Unlock Deck
Unlock for access to all 56 flashcards in this deck.
Unlock Deck
k this deck
16
With i.i.d. sampling each of the following is true except
A)
B)
C)
D) is a random variable.
A)
B)
C)
D) is a random variable.
Unlock Deck
Unlock for access to all 56 flashcards in this deck.
Unlock Deck
k this deck
17
The critical value of a two-sided t-test computed from a large sample
A)is 1.64 if the significance level of the test is 5%.
B)cannot be calculated unless you know the degrees of freedom.
C)is 1.96 if the significance level of the test is 5%.
D)is the same as the p-value.
A)is 1.64 if the significance level of the test is 5%.
B)cannot be calculated unless you know the degrees of freedom.
C)is 1.96 if the significance level of the test is 5%.
D)is the same as the p-value.
Unlock Deck
Unlock for access to all 56 flashcards in this deck.
Unlock Deck
k this deck
18
A type II error
Unlock Deck
Unlock for access to all 56 flashcards in this deck.
Unlock Deck
k this deck
19
The size of the test
A)is the probability of committing a type I error.
B)is the same as the sample size.
C)is always equal to (1-the power of test).
D)can be greater than 1 in extreme examples.
A)is the probability of committing a type I error.
B)is the same as the sample size.
C)is always equal to (1-the power of test).
D)can be greater than 1 in extreme examples.
Unlock Deck
Unlock for access to all 56 flashcards in this deck.
Unlock Deck
k this deck
20
An estimate is
A)efficient if it has the smallest variance possible.
B)a nonrandom number.
C)unbiased if its expected value equals the population value.
D)another word for estimator.
A)efficient if it has the smallest variance possible.
B)a nonrandom number.
C)unbiased if its expected value equals the population value.
D)another word for estimator.
Unlock Deck
Unlock for access to all 56 flashcards in this deck.
Unlock Deck
k this deck
21
Degrees of freedom
Unlock Deck
Unlock for access to all 56 flashcards in this deck.
Unlock Deck
k this deck
22
The t-statistic has the following distribution:
Unlock Deck
Unlock for access to all 56 flashcards in this deck.
Unlock Deck
k this deck
23
You have collected weekly earnings and age data from a sub-sample of 1,744
individuals using the Current Population Survey in a given year.
.
(a)Given the overall mean of $434.49 and a standard deviation of $294.67, construct a
99% confidence interval for average earnings in the entire population.State the
meaning of this interval in words, rather than just in numbers.If you constructed a 90%
confidence interval instead, would it be smaller or larger? What is the intuition?
Unlock Deck
Unlock for access to all 56 flashcards in this deck.
Unlock Deck
k this deck
24
U.S.News and World Report ranks colleges and universities annually.You randomly
sample 100 of the national universities and liberal arts colleges from the year 2000
issue.The average cost, which includes tuition, fees, and room and board, is $23,571.49
with a standard deviation of $7,015.52.
(a)Based on this sample, construct a 95% confidence interval of the average cost of
attending a university/college in the United States.
Unlock Deck
Unlock for access to all 56 flashcards in this deck.
Unlock Deck
k this deck
25
The sample covariance can be calculated in any of the following ways, with the exception of:
Unlock Deck
Unlock for access to all 56 flashcards in this deck.
Unlock Deck
k this deck
26
The t-statistic is defined as follows:
Unlock Deck
Unlock for access to all 56 flashcards in this deck.
Unlock Deck
k this deck
27
A manufacturer claims that a certain brand of VCR player has an average life
expectancy of 5 years and 6 months with a standard deviation of 1 year and 6 months.
Assume that the life expectancy is normally distributed.
(a)Selecting one VCR player from this brand at random, calculate the probability of its life
expectancy exceeding 7 years.
expectancy of 5 years and 6 months with a standard deviation of 1 year and 6 months.
Assume that the life expectancy is normally distributed.
(a)Selecting one VCR player from this brand at random, calculate the probability of its life
expectancy exceeding 7 years.
Unlock Deck
Unlock for access to all 56 flashcards in this deck.
Unlock Deck
k this deck
28
The standard error for the difference in means if two random variables M and W , when the two population variances are different, is
Unlock Deck
Unlock for access to all 56 flashcards in this deck.
Unlock Deck
k this deck
29
Adult males are taller, on average, than adult females.Visiting two recent American
Youth Soccer Organization (AYSO)under 12 year old (U12)soccer matches on a
Saturday, you do not observe an obvious difference in the height of boys and girls of
that age.You suggest to your little sister that she collect data on height and gender of
children in 4th to 6th grade as part of her science project.The accompanying table shows
her findings. (a)Let your null hypothesis be that there is no difference in the height of females and
males at this age level.Specify the alternative hypothesis.
Youth Soccer Organization (AYSO)under 12 year old (U12)soccer matches on a
Saturday, you do not observe an obvious difference in the height of boys and girls of
that age.You suggest to your little sister that she collect data on height and gender of
children in 4th to 6th grade as part of her science project.The accompanying table shows
her findings.
(a)Let your null hypothesis be that there is no difference in the height of females andmales at this age level.Specify the alternative hypothesis.
Unlock Deck
Unlock for access to all 56 flashcards in this deck.
Unlock Deck
k this deck
30
Your textbook defines the correlation coefficient as follows: Another textbook gives an alternative formula: Prove that the two are the same.
22
Another textbook gives an alternative formula: Prove that the two are the same.22
Unlock Deck
Unlock for access to all 56 flashcards in this deck.
Unlock Deck
k this deck
31
The following statement about the sample correlation coefficient is true.
Unlock Deck
Unlock for access to all 56 flashcards in this deck.
Unlock Deck
k this deck
32
For each of the accompanying scatterplots for several pairs of variables, indicate
whether you expect a positive or negative correlation coefficient between the two
variables, and the likely magnitude of it (you can use a small range).
(a)
whether you expect a positive or negative correlation coefficient between the two
variables, and the likely magnitude of it (you can use a small range).
(a)
Unlock Deck
Unlock for access to all 56 flashcards in this deck.
Unlock Deck
k this deck
33
When the sample size n is large, the 90% confidence interval for is
A)
B)
C)
D)
A)
B)
C)
D)
Unlock Deck
Unlock for access to all 56 flashcards in this deck.
Unlock Deck
k this deck
34
During the last few days before a presidential election, there is a frenzy of voting
intention surveys.On a given day, quite often there are conflicting results from three
major polls.
(a)
intention surveys.On a given day, quite often there are conflicting results from three
major polls.
(a)
Unlock Deck
Unlock for access to all 56 flashcards in this deck.
Unlock Deck
k this deck
35
Your textbook defined the covariance between X and Y as follows:
Unlock Deck
Unlock for access to all 56 flashcards in this deck.
Unlock Deck
k this deck
36
The power of the test
Unlock Deck
Unlock for access to all 56 flashcards in this deck.
Unlock Deck
k this deck
37
Think of at least nine examples, three of each, that display a positive, negative, or no
correlation between two economic variables.In each of the positive and negative
examples, indicate whether or not you expect the correlation to be strong or weak.
correlation between two economic variables.In each of the positive and negative
examples, indicate whether or not you expect the correlation to be strong or weak.
Unlock Deck
Unlock for access to all 56 flashcards in this deck.
Unlock Deck
k this deck
38
(a)Sketch the two distributions under the null hypothesis and the alternative hypothesis. Unlock Deck
Unlock for access to all 56 flashcards in this deck.
Unlock Deck
k this deck
39
The correlation coefficient
A)lies between zero and one.
B)is a measure of linear association.
C)is close to one if X causes Y.
D)takes on a high value if you have a strong nonlinear relationship.
A)lies between zero and one.
B)is a measure of linear association.
C)is close to one if X causes Y.
D)takes on a high value if you have a strong nonlinear relationship.
Unlock Deck
Unlock for access to all 56 flashcards in this deck.
Unlock Deck
k this deck
40
The formula for the sample variance is
A)
B)
C)
D)
A)
B)
C)
D)
Unlock Deck
Unlock for access to all 56 flashcards in this deck.
Unlock Deck
k this deck
41
Imagine that you had sampled 1,000,000 females and 1,000,000 males to test whether
or not females have a higher IQ than males.IQs are normally distributed with a mean of
100 and a standard deviation of 16.You are excited to find that females have an
average IQ of 101 in your sample, while males have an IQ of 99.Does this difference
seem important? Do you really need to carry out a t-test for differences in means to
determine whether or not this difference is statistically significant? What does this
result tell you about testing hypotheses when sample sizes are very large?
Unlock Deck
Unlock for access to all 56 flashcards in this deck.
Unlock Deck
k this deck
42
Your textbook suggests using the first observation from a sample of n as an estimator of
the population mean.It is shown that this estimator is unbiased but has a variance of
σ2 , which makes it less efficient than the sample mean.Explain why this estimator is
Y
not consistent.You develop another estimator, which is the simple average of the first
and last observation in your sample.Show that this estimator is also unbiased and show
that it is more efficient than the estimator which only uses the first observation.Is this
estimator consistent?
Unlock Deck
Unlock for access to all 56 flashcards in this deck.
Unlock Deck
k this deck
43
L
Unlock Deck
Unlock for access to all 56 flashcards in this deck.
Unlock Deck
k this deck
44
Some policy advisors have argued that education should be subsidized in developing
countries to reduce fertility rates.To investigate whether or not education and fertility
are correlated, you collect data on population growth rates (Y)and education (X)for 86
countries.Given the sums below, compute the sample correlation:
countries to reduce fertility rates.To investigate whether or not education and fertility
are correlated, you collect data on population growth rates (Y)and education (X)for 86
countries.Given the sums below, compute the sample correlation:
Unlock Deck
Unlock for access to all 56 flashcards in this deck.
Unlock Deck
k this deck
45
Your textbook states that when you test for differences in means and you assume that
the two population variances are equal, then an estimator of the population variance is
the following "pooled" estimator: 2
Explain why this pooled estimator can be looked at as the weighted average of the two
variances.
the two population variances are equal, then an estimator of the population variance is
the following "pooled" estimator:
2Explain why this pooled estimator can be looked at as the weighted average of the two
variances.
Unlock Deck
Unlock for access to all 56 flashcards in this deck.
Unlock Deck
k this deck
46
The accompanying table lists the height (STUDHGHT)in inches and weight (WEIGHT)
in pounds of five college students.Calculate the correlation coefficient.
in pounds of five college students.Calculate the correlation coefficient.
Unlock Deck
Unlock for access to all 56 flashcards in this deck.
Unlock Deck
k this deck
47
(Advanced) Unbiasedness and small variance are desirable properties of estimators. However, you can imagine situations where a trade-off exists between the two: one estimator may be have a small bias but a much smaller variance than another, unbiased estimator. The concept of "mean square error" estimator combines the two concepts. Let be an estimator of Then the mean square error (MSE) is defined as follows:
(Hint: subtract and add
be an estimator of Then the mean square error (MSE) is defined as follows: (Hint: subtract and add
Unlock Deck
Unlock for access to all 56 flashcards in this deck.
Unlock Deck
k this deck
48
Consider two estimators: one which is biased and has a smaller variance, the other
which is unbiased and has a larger variance.Sketch the sampling distributions and the
location of the population parameter for this situation.Discuss conditions under which
you may prefer to use the first estimator over the second one.
which is unbiased and has a larger variance.Sketch the sampling distributions and the
location of the population parameter for this situation.Discuss conditions under which
you may prefer to use the first estimator over the second one.
Unlock Deck
Unlock for access to all 56 flashcards in this deck.
Unlock Deck
k this deck
49
Your textbook mentions that dividing the sample variance by n -1 instead of n is called
a degrees of freedom correction.The meaning of the term stems from the fact that one
degree of freedom is used up when the mean is estimated.Hence degrees of freedom
can be viewed as the number of independent observations remaining after estimating
the sample mean.
Consider an example where initially you have 20 independent observations on the
height of students.After calculating the average height, your instructor claims that you
can figure out the height of the 20th student if she provides you with the height of the
other 19 students and the sample mean.Hence you have lost one degree of freedom, or
29
there are only 19 independent bits of information.Explain how you can find the height
of the 20th student.
Unlock Deck
Unlock for access to all 56 flashcards in this deck.
Unlock Deck
k this deck
50
IQs of individuals are normally distributed with a mean of 100 and a standard deviation
of 16.If you sampled students at your college and assumed, as the null hypothesis, that
they had the same IQ as the population, then in a random sample of size
of 16.If you sampled students at your college and assumed, as the null hypothesis, that
they had the same IQ as the population, then in a random sample of size
Unlock Deck
Unlock for access to all 56 flashcards in this deck.
Unlock Deck
k this deck
51
L 24
24 Unlock Deck
Unlock for access to all 56 flashcards in this deck.
Unlock Deck
k this deck
52
25 Unlock Deck
Unlock for access to all 56 flashcards in this deck.
Unlock Deck
k this deck
53
Consider the following alternative estimator for the population mean:
Unlock Deck
Unlock for access to all 56 flashcards in this deck.
Unlock Deck
k this deck
54
When you perform hypothesis tests, you are faced with four possible outcomes
described in the accompanying table.
described in the accompanying table.
Unlock Deck
Unlock for access to all 56 flashcards in this deck.
Unlock Deck
k this deck
55
The net weight of a bag of flour is guaranteed to be 5 pounds with a standard deviation
of 0.05 pounds.You are concerned that the actual weight is less.To test for this, you
sample 25 bags.Carefully state the null and alternative hypothesis in this situation.
Determine a critical value such that the size of the test does not exceed 5%.Finding the
average weight of the 25 bags to be 4.7 pounds, can you reject the null hypothesis?
What is the power of the test here? Why is it so low?
Unlock Deck
Unlock for access to all 56 flashcards in this deck.
Unlock Deck
k this deck
56
L
Unlock Deck
Unlock for access to all 56 flashcards in this deck.
Unlock Deck
k this deck
Unlock Deck
Unlock for access to all 56 flashcards in this deck.


