Deck 4: Describing Bivariate Numerical Data
Full screen (f)
Question
Question
Question
Question
Question
The Des Moines Register reported the ratings of high school sportsmanship as compiledby the Iowa High School Athletic Association. The participants and coaches from eachschool were rated by referees. (1 = superior, 5 = unsatisfactory.) A regression analysisof data on the average scores given to football players and coaches is shown below. 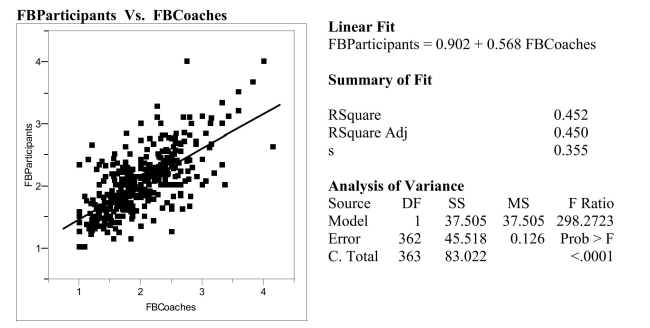 a) Interpret the value of the correlation between the ratings of coaches andparticipants.b) Interpret the value of the coefficient of determination.c) Interpret the value of the standard deviation about the least squares line.
a) Interpret the value of the correlation between the ratings of coaches andparticipants.b) Interpret the value of the coefficient of determination.c) Interpret the value of the standard deviation about the least squares line. Question
Question
Question
Question
The data below were gathered on a random sample of 7 male banded black-footedalbatrosses of known age. In an effort to monitor diseases of these animals, biologistswould like to be able to estimate the lifespan of healthy albatrosses in the largerpopulation. In males of this species gonad size (the size of the sex gland) isassociated with age. 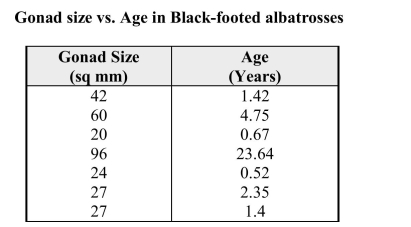 a) What is the value of the correlation coefficient for these data?
b) What is the equation of the least squares line describing the relationship betweenx = Gonad Size and y = Age.c) If these albatrosses are representative of the population of all albatrosses, whatwould you predict to be the age of a male albatross with a gonad size of 50 sq.mm?
Show any calculations below.d) The largest albatross gonad size in the sample, 96 sq mm, is associated with anage of 23.64 years. These animals are thought to live for up to 40 years. Would itbe reasonable to use the equation from part (b) above to predict the age for analbatross with a gonad size of 150 sq mm?
Why or why not?
a) What is the value of the correlation coefficient for these data?b) What is the equation of the least squares line describing the relationship betweenx = Gonad Size and y = Age.c) If these albatrosses are representative of the population of all albatrosses, whatwould you predict to be the age of a male albatross with a gonad size of 50 sq.mm?
Show any calculations below.d) The largest albatross gonad size in the sample, 96 sq mm, is associated with anage of 23.64 years. These animals are thought to live for up to 40 years. Would itbe reasonable to use the equation from part (b) above to predict the age for analbatross with a gonad size of 150 sq mm?
Why or why not?
Question
Question
Question
As early as 3 years of age, children begin to show preferences for playing withmembers of their own sex, and report having more same-sex than opposite-sexfriends. Researchers believe that this may be the result of perceived differences inpersonality. In a study of 3rd and 4th graders' views on a number personality traits,children were asked to rate on a "5-point" scale:-2 = "someone possessing that trait is probably a boy"-1 = "someone possessing that trait might be a boy"0 = "can't tell"1 = "someone possessing that trait might be a girl"2 = "someone possessing that trait is probably a girl"A scatterplot of the data is presented below. A single point represents the (averagegirls' rating, average boys' rating) for a given trait. 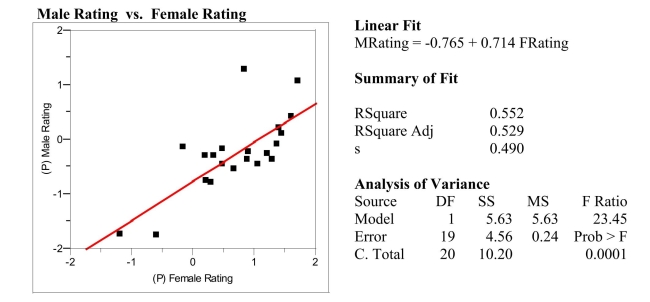 a) Circle the single point which represents the most influential observation. Whataspect of this point makes it the most influential?
b) Suppose a personality trait similar to those used in the survey was given anaverage of 0.0 ("can't tell") by the girls. The predicted boys' average rating wouldbe closest to which of the 5 categories described above?
c) The traits plotted above are those the researchers believe are "positive" traits, suchas "mature," "honest," and "polite." The researchers thought that on average girlswould rate these positive traits as characteristic of girls to a greater extent thanboys would. What aspects of the plot and/or regression analysis presented aboveare consistent with this thinking?
a) Circle the single point which represents the most influential observation. Whataspect of this point makes it the most influential?b) Suppose a personality trait similar to those used in the survey was given anaverage of 0.0 ("can't tell") by the girls. The predicted boys' average rating wouldbe closest to which of the 5 categories described above?
c) The traits plotted above are those the researchers believe are "positive" traits, suchas "mature," "honest," and "polite." The researchers thought that on average girlswould rate these positive traits as characteristic of girls to a greater extent thanboys would. What aspects of the plot and/or regression analysis presented aboveare consistent with this thinking?
Question
Early humans were similar in shape to most modern large primates. The data beloware average male hind limb and forelimb lengths for different species of earlyhominids (humans and their ancestors.) 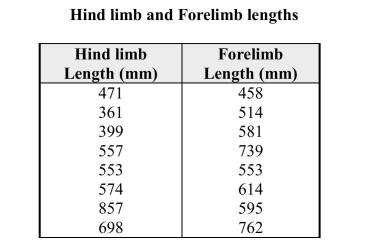 a) What is the value of the correlation coefficient for these data?
b) What is the equation of the least squares line describing the relationship betweenx = hind limb length and y = forelimb length.c) Suppose these species are representative of all species of early human ancestors.If a new homonin species dating from about the same time were to be discoveredwith an average hind limb length of 500 mm, what would you predict to be theaverage forelimb length of this species?
a) What is the value of the correlation coefficient for these data?b) What is the equation of the least squares line describing the relationship betweenx = hind limb length and y = forelimb length.c) Suppose these species are representative of all species of early human ancestors.If a new homonin species dating from about the same time were to be discoveredwith an average hind limb length of 500 mm, what would you predict to be theaverage forelimb length of this species?
Question
Question
Question
Question
Question
Question
Question
Question
As early as 3 years of age, children begin to show preferences for playing withmembers of their own sex, and report having more same-sex than opposite-sexfriends. Researchers believe that this may be the result of perceived differences inpersonality. In a study of 3rd and 4th graders' views on a number personality traits,children were asked to rate on a "5-point" scale:-2 = "someone possessing that trait is probably a boy"-1 = "someone possessing that trait might be a boy"0 = "can't tell"1 = "someone possessing that trait might be a girl"2 = "someone possessing that trait is probably a girl"A scatterplot of the data is presented below. A single point represents the (averagegirls' rating, average boys' rating) for a given trait. 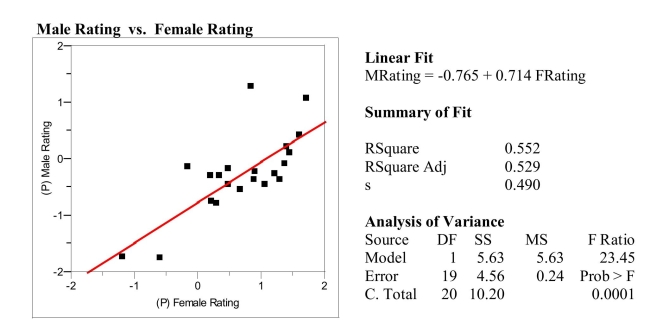 a) Circle the single point that represents the most influential observation. Whataspect of this point makes it the most influential?
b) Suppose a personality trait similar to those used in the survey was given anaverage of 0.0 ("can't tell") by the girls. The predicted boys' average ratingwould be closest to which of the 5 categories described above?
c) The traits plotted above are those the researchers believe are "positive" traits, suchas "mature," "honest," and "polite." The researchers thought that on average girlswould rate these positive traits as characteristic of girls to a greater extent thanboys would. What aspects of the plot and/or regression analysis presented aboveare consistent with this thinking?
a) Circle the single point that represents the most influential observation. Whataspect of this point makes it the most influential?b) Suppose a personality trait similar to those used in the survey was given anaverage of 0.0 ("can't tell") by the girls. The predicted boys' average ratingwould be closest to which of the 5 categories described above?
c) The traits plotted above are those the researchers believe are "positive" traits, suchas "mature," "honest," and "polite." The researchers thought that on average girlswould rate these positive traits as characteristic of girls to a greater extent thanboys would. What aspects of the plot and/or regression analysis presented aboveare consistent with this thinking?
Question
Some delicate fabrics are natural silks, made of protein and biodegradable. It would be beneficial to be able to assess the delicacy of a fabric before
making decisions about displaying it in a museum. Chemical analysis might give some evidence about the brittle nature of a fabric. Biochemical data were acquired from the linings of sixteen 19th and early 20th century Japanese
kimonos. Investigators measured the concentration of certain amino acids (“Amino acid ratio”) as well as the breaking stress (“tenacity”) of the 16 kimono fabrics.

-a) What is the equation of the least-squaresline for predicting tenacity using aminob) Graph the least squares best fit line on the scatter plotthat appears on https://d2lvgg3v3hfg70.cloudfront.net/TB5309/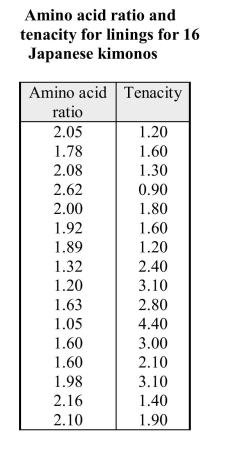 .
.
c) Approximately what proportion of the variability inacid ratio tenacity is explained by the linear relationship between tenacity and the amino acid ratio?
making decisions about displaying it in a museum. Chemical analysis might give some evidence about the brittle nature of a fabric. Biochemical data were acquired from the linings of sixteen 19th and early 20th century Japanese
kimonos. Investigators measured the concentration of certain amino acids (“Amino acid ratio”) as well as the breaking stress (“tenacity”) of the 16 kimono fabrics.
-a) What is the equation of the least-squaresline for predicting tenacity using aminob) Graph the least squares best fit line on the scatter plotthat appears on https://d2lvgg3v3hfg70.cloudfront.net/TB5309/
.c) Approximately what proportion of the variability inacid ratio tenacity is explained by the linear relationship between tenacity and the amino acid ratio?
Question
The theory of fiber strength suggests that the relationship between fiber tenacity and amino acid ratio is logarithmic, i.e 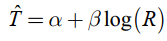 ,where T is the tenacity and R is the amino acid ratio. Perform the appropriate transformation of variable(s) and fit this logarithmic model to the data
-What is the best fit line using thetransformed data?
,where T is the tenacity and R is the amino acid ratio. Perform the appropriate transformation of variable(s) and fit this logarithmic model to the data-What is the best fit line using thetransformed data?
Question
Hemorrhagic disease in white-tailed deer is caused by a virus known as EHD.Immunity is given to fawns by transfer of EHD antibodies from the mother. In astudy to determine how long the maternal antibodies last, blood samples were takenfrom a large sample of fawns of varying ages. The mean levels of EHD antibodyconcentration and the associated ages of fawns are given in the table below.After using the data to fit a straight line model, Eˆ = a + bW , significant curvature wasdetected in the residual plot. Two nonlinear models were chosen for further analysis,the exponential and the power models. (For these data, common logs were used toperform the transformations.) The computer output for these models is given below,and the residual plots are on the next page. 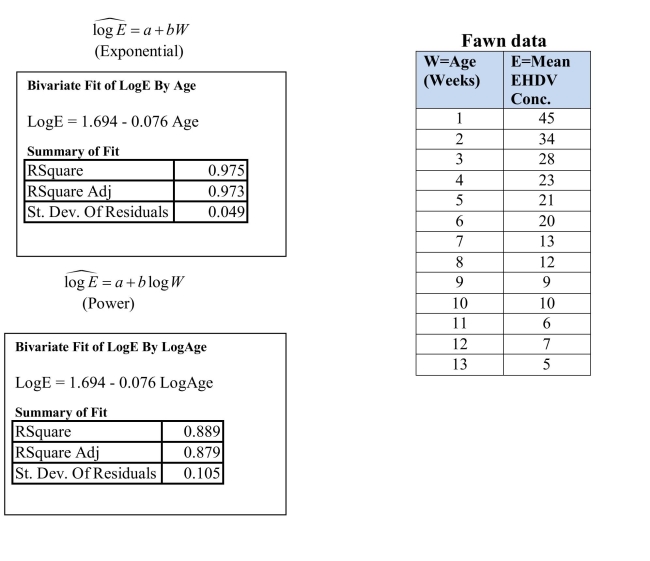
Residual Plots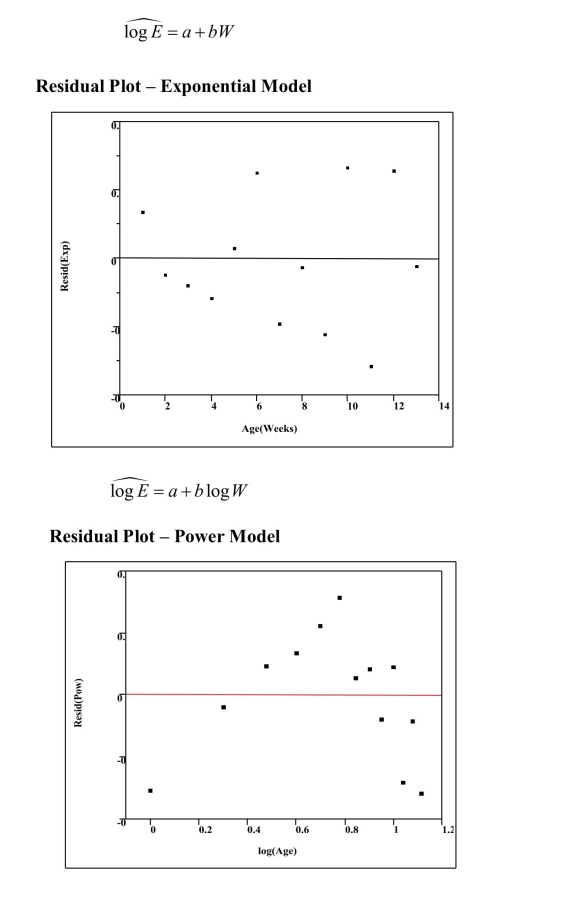
a) For the exponential model, calculate the predicted logarithm of the EHD antibodyconcentration for an age of 5 weeks.
b) Generally speaking, which of the two models, power or exponential, is a betterchoice for predicting the logarithm of the EHD antibody concentration?
Providestatistical justification for your choice based on both the residual plot and thenumerical summary statistics above.
c) The researchers want use their model to predict EHD antibody concentrations forfawns up to 24 weeks of age. Do you think this would be reasonable?
Explainwhy or why not.
Question
In the 19th Century, venereal diseases were the major preventable diseases strikingsoldiers far from home. During the American Civil War, the United States Army keptrecords on soldiers diagnosed with syphilis and gonorrhea. An analysis of theincidence of these diseases for a sample of months is presented below. (Incidencerate is the number of cases per 100,000 soldiers.)Summary statistics from Regression AnalysisIncidence of syphilis and gonorrhea forthe years 1861 - 1865 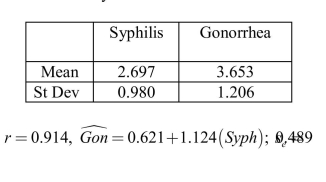
a) For a month with an incidence rate for Syphilis that is one standard deviation abovethe mean rate, what would be the predicted incidence rate for gonorrhea?
b) What proportion of the variability in the gonorrhea incidence rate is accounted for bysyphilis incidence rate?
c) Suppose you are asked to assess the accuracy of the prediction of the gonorrheaincidence rate. What information above could be used to answer this question?
Question
The Des Moines Register reported the ratings of high school sportsmanship as compiledby the Iowa High School Athletic Association. The participants and coaches from eachschool were rated by referees. (1 = superior, 5 = unsatisfactory.) A regression analysisof data on the average scores given to wrestling spectators and coaches is shown below. 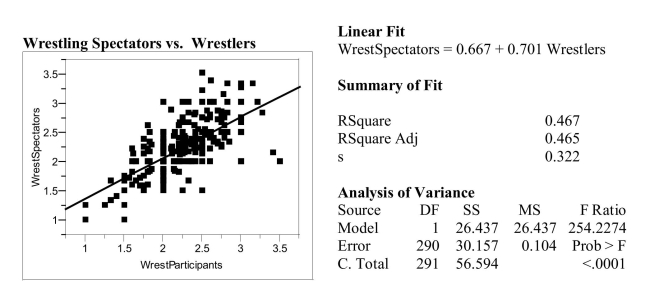 a) Interpret the value of the correlation between the ratings of spectators andwrestlers?
b) Interpret the value of the coefficient of determination.c) Interpret the value of the standard deviation about the least squares line.
a) Interpret the value of the correlation between the ratings of spectators andwrestlers?b) Interpret the value of the coefficient of determination.c) Interpret the value of the standard deviation about the least squares line.
Question
The study of prehistoric birds depends on imprints of a prehistoric creature’s remains in stone, commonly known as fossils. To study ancient ecosystems effectively it would be useful know the actual mass of individual birds, but this information is not preserved in the fossil record. It seems reasonable that the biomechanics of birds is much the same today as in the past. For example, today’s relationship between the wing length and total weight of a bird should be very similar to that for birds from the distant past. The wing lengths of ancient birds are readily obtainable from the fossil record, but the weight is
not. A regression model expressing the relationship between wing length and total weight of modern birds could be used to estimate the mass of similar prehistoric birds. Data for some species of modern birds of prey and are given below.
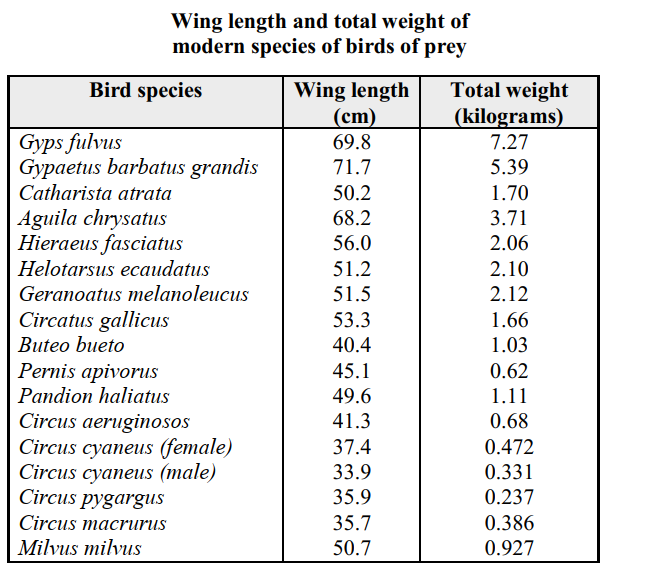
-Investigators would like to model the relationship between Wing Length and Weight.The least squares line for predicting total weight using wing length as a predictor is ofinterest.
a) What is the equation of the least-squares line?
b) Graph the least-squares line on the scatter plot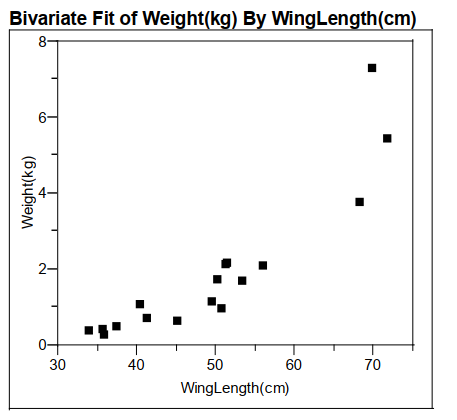
c) Approximately what proportion of thevariability in weight is explained by thewing length?
not. A regression model expressing the relationship between wing length and total weight of modern birds could be used to estimate the mass of similar prehistoric birds. Data for some species of modern birds of prey and are given below.
-Investigators would like to model the relationship between Wing Length and Weight.The least squares line for predicting total weight using wing length as a predictor is ofinterest.
a) What is the equation of the least-squares line?
b) Graph the least-squares line on the scatter plot
c) Approximately what proportion of thevariability in weight is explained by thewing length?
Question
Question

Unlock Deck
Sign up to unlock the cards in this deck!
Unlock Deck
Unlock Deck
1/29
Play
Full screen (f)
Deck 4: Describing Bivariate Numerical Data
1
The value of the correlation coefficient, r, is always between 0 and 1.
False
2
Assessing the "goodness" of a regression line involves considering several aspects ofthe fit. Consider the characteristics below. How does each contribute to anassessment of fit?
That is, for each characteristic, what about the given characteristicwould indicate that the regression line is "good"?
a) The shape of the scatter plotb) The correlation coefficientc) The standard deviation of the residualsd) The coefficient of determination
That is, for each characteristic, what about the given characteristicwould indicate that the regression line is "good"?
a) The shape of the scatter plotb) The correlation coefficientc) The standard deviation of the residualsd) The coefficient of determination
a) Points on the graph lined up in a pattern that is consistently increasing or decreasing, rather than curved.
b) Values of r that are close to -1 or 1.
c) Small value of the standard deviation of the residuals (close to zero).
d) Value o f r2 close to 1.
b) Values of r that are close to -1 or 1.
c) Small value of the standard deviation of the residuals (close to zero).
d) Value o f r2 close to 1.
3
The coefficient of determination is equal to the positive square root of thecorrelation coefficient, r.
False
4
One of the properties of Pearson's r is: "The value of r does not depend on which ofthe two variables is labeled as x." In your own words, what does this mean?
Unlock Deck
Unlock for access to all 29 flashcards in this deck.
Unlock Deck
k this deck
5
The Des Moines Register reported the ratings of high school sportsmanship as compiledby the Iowa High School Athletic Association. The participants and coaches from eachschool were rated by referees. (1 = superior, 5 = unsatisfactory.) A regression analysisof data on the average scores given to football players and coaches is shown below. a) Interpret the value of the correlation between the ratings of coaches andparticipants.b) Interpret the value of the coefficient of determination.c) Interpret the value of the standard deviation about the least squares line.
a) Interpret the value of the correlation between the ratings of coaches andparticipants.b) Interpret the value of the coefficient of determination.c) Interpret the value of the standard deviation about the least squares line. Unlock Deck
Unlock for access to all 29 flashcards in this deck.
Unlock Deck
k this deck
6
If on average y increases as x increases, the correlation coefficient ispositive.
Unlock Deck
Unlock for access to all 29 flashcards in this deck.
Unlock Deck
k this deck
7
The standard deviation about the least squares line is roughly the typicalamount by which an observation deviates from the least squares line.
Unlock Deck
Unlock for access to all 29 flashcards in this deck.
Unlock Deck
k this deck
8
Generally, a relatively small value of r2 is associated with a relativelysmall se .
Unlock Deck
Unlock for access to all 29 flashcards in this deck.
Unlock Deck
k this deck
9
The data below were gathered on a random sample of 7 male banded black-footedalbatrosses of known age. In an effort to monitor diseases of these animals, biologistswould like to be able to estimate the lifespan of healthy albatrosses in the largerpopulation. In males of this species gonad size (the size of the sex gland) isassociated with age. a) What is the value of the correlation coefficient for these data?
b) What is the equation of the least squares line describing the relationship betweenx = Gonad Size and y = Age.c) If these albatrosses are representative of the population of all albatrosses, whatwould you predict to be the age of a male albatross with a gonad size of 50 sq.mm?
Show any calculations below.d) The largest albatross gonad size in the sample, 96 sq mm, is associated with anage of 23.64 years. These animals are thought to live for up to 40 years. Would itbe reasonable to use the equation from part (b) above to predict the age for analbatross with a gonad size of 150 sq mm?
Why or why not?
a) What is the value of the correlation coefficient for these data?b) What is the equation of the least squares line describing the relationship betweenx = Gonad Size and y = Age.c) If these albatrosses are representative of the population of all albatrosses, whatwould you predict to be the age of a male albatross with a gonad size of 50 sq.mm?
Show any calculations below.d) The largest albatross gonad size in the sample, 96 sq mm, is associated with anage of 23.64 years. These animals are thought to live for up to 40 years. Would itbe reasonable to use the equation from part (b) above to predict the age for analbatross with a gonad size of 150 sq mm?
Why or why not?
Unlock Deck
Unlock for access to all 29 flashcards in this deck.
Unlock Deck
k this deck
10
The slope of the least squares line is the amount by which y increases, onaverage, as x increases by one unit.
Unlock Deck
Unlock for access to all 29 flashcards in this deck.
Unlock Deck
k this deck
11
What is it that the correlation coefficient measures?
Unlock Deck
Unlock for access to all 29 flashcards in this deck.
Unlock Deck
k this deck
12
As early as 3 years of age, children begin to show preferences for playing withmembers of their own sex, and report having more same-sex than opposite-sexfriends. Researchers believe that this may be the result of perceived differences inpersonality. In a study of 3rd and 4th graders' views on a number personality traits,children were asked to rate on a "5-point" scale:-2 = "someone possessing that trait is probably a boy"-1 = "someone possessing that trait might be a boy"0 = "can't tell"1 = "someone possessing that trait might be a girl"2 = "someone possessing that trait is probably a girl"A scatterplot of the data is presented below. A single point represents the (averagegirls' rating, average boys' rating) for a given trait. a) Circle the single point which represents the most influential observation. Whataspect of this point makes it the most influential?
b) Suppose a personality trait similar to those used in the survey was given anaverage of 0.0 ("can't tell") by the girls. The predicted boys' average rating wouldbe closest to which of the 5 categories described above?
c) The traits plotted above are those the researchers believe are "positive" traits, suchas "mature," "honest," and "polite." The researchers thought that on average girlswould rate these positive traits as characteristic of girls to a greater extent thanboys would. What aspects of the plot and/or regression analysis presented aboveare consistent with this thinking?
a) Circle the single point which represents the most influential observation. Whataspect of this point makes it the most influential?b) Suppose a personality trait similar to those used in the survey was given anaverage of 0.0 ("can't tell") by the girls. The predicted boys' average rating wouldbe closest to which of the 5 categories described above?
c) The traits plotted above are those the researchers believe are "positive" traits, suchas "mature," "honest," and "polite." The researchers thought that on average girlswould rate these positive traits as characteristic of girls to a greater extent thanboys would. What aspects of the plot and/or regression analysis presented aboveare consistent with this thinking?
Unlock Deck
Unlock for access to all 29 flashcards in this deck.
Unlock Deck
k this deck
13
Early humans were similar in shape to most modern large primates. The data beloware average male hind limb and forelimb lengths for different species of earlyhominids (humans and their ancestors.) a) What is the value of the correlation coefficient for these data?
b) What is the equation of the least squares line describing the relationship betweenx = hind limb length and y = forelimb length.c) Suppose these species are representative of all species of early human ancestors.If a new homonin species dating from about the same time were to be discoveredwith an average hind limb length of 500 mm, what would you predict to be theaverage forelimb length of this species?
a) What is the value of the correlation coefficient for these data?b) What is the equation of the least squares line describing the relationship betweenx = hind limb length and y = forelimb length.c) Suppose these species are representative of all species of early human ancestors.If a new homonin species dating from about the same time were to be discoveredwith an average hind limb length of 500 mm, what would you predict to be theaverage forelimb length of this species?
Unlock Deck
Unlock for access to all 29 flashcards in this deck.
Unlock Deck
k this deck
14
The least squares line passes through the point ( xy, ) .
Unlock Deck
Unlock for access to all 29 flashcards in this deck.
Unlock Deck
k this deck
15
The slope of the least squares line for predicting y from x and the slope ofthe least squares line for predicting x from y are equal.
Unlock Deck
Unlock for access to all 29 flashcards in this deck.
Unlock Deck
k this deck
16
The correlation coefficient, r, does not depend on the units ofmeasurement of the two variables.
Unlock Deck
Unlock for access to all 29 flashcards in this deck.
Unlock Deck
k this deck
17
One of the properties of correlation coefficient, r, is: "The value of r does not dependon the unit of measurement for either variable." In your own words, what does thismean?
Unlock Deck
Unlock for access to all 29 flashcards in this deck.
Unlock Deck
k this deck
18
What is it that the correlation coefficient measures?
Unlock Deck
Unlock for access to all 29 flashcards in this deck.
Unlock Deck
k this deck
19
A large value of r2 indicates strong evidence for a causal relationshipbetween x and y.
Unlock Deck
Unlock for access to all 29 flashcards in this deck.
Unlock Deck
k this deck
20
A transformation, or re-expression, of a variable is accomplished bysubstituting a function of the variable in place of the variable in furtheranalyses.
Unlock Deck
Unlock for access to all 29 flashcards in this deck.
Unlock Deck
k this deck
21
As early as 3 years of age, children begin to show preferences for playing withmembers of their own sex, and report having more same-sex than opposite-sexfriends. Researchers believe that this may be the result of perceived differences inpersonality. In a study of 3rd and 4th graders' views on a number personality traits,children were asked to rate on a "5-point" scale:-2 = "someone possessing that trait is probably a boy"-1 = "someone possessing that trait might be a boy"0 = "can't tell"1 = "someone possessing that trait might be a girl"2 = "someone possessing that trait is probably a girl"A scatterplot of the data is presented below. A single point represents the (averagegirls' rating, average boys' rating) for a given trait. a) Circle the single point that represents the most influential observation. Whataspect of this point makes it the most influential?
b) Suppose a personality trait similar to those used in the survey was given anaverage of 0.0 ("can't tell") by the girls. The predicted boys' average ratingwould be closest to which of the 5 categories described above?
c) The traits plotted above are those the researchers believe are "positive" traits, suchas "mature," "honest," and "polite." The researchers thought that on average girlswould rate these positive traits as characteristic of girls to a greater extent thanboys would. What aspects of the plot and/or regression analysis presented aboveare consistent with this thinking?
a) Circle the single point that represents the most influential observation. Whataspect of this point makes it the most influential?b) Suppose a personality trait similar to those used in the survey was given anaverage of 0.0 ("can't tell") by the girls. The predicted boys' average ratingwould be closest to which of the 5 categories described above?
c) The traits plotted above are those the researchers believe are "positive" traits, suchas "mature," "honest," and "polite." The researchers thought that on average girlswould rate these positive traits as characteristic of girls to a greater extent thanboys would. What aspects of the plot and/or regression analysis presented aboveare consistent with this thinking?
Unlock Deck
Unlock for access to all 29 flashcards in this deck.
Unlock Deck
k this deck
22
Some delicate fabrics are natural silks, made of protein and biodegradable. It would be beneficial to be able to assess the delicacy of a fabric before
making decisions about displaying it in a museum. Chemical analysis might give some evidence about the brittle nature of a fabric. Biochemical data were acquired from the linings of sixteen 19th and early 20th century Japanese
kimonos. Investigators measured the concentration of certain amino acids (“Amino acid ratio”) as well as the breaking stress (“tenacity”) of the 16 kimono fabrics.
-a) What is the equation of the least-squaresline for predicting tenacity using aminob) Graph the least squares best fit line on the scatter plotthat appears on https://d2lvgg3v3hfg70.cloudfront.net/TB5309/.
c) Approximately what proportion of the variability inacid ratio tenacity is explained by the linear relationship between tenacity and the amino acid ratio?
making decisions about displaying it in a museum. Chemical analysis might give some evidence about the brittle nature of a fabric. Biochemical data were acquired from the linings of sixteen 19th and early 20th century Japanese
kimonos. Investigators measured the concentration of certain amino acids (“Amino acid ratio”) as well as the breaking stress (“tenacity”) of the 16 kimono fabrics.
-a) What is the equation of the least-squaresline for predicting tenacity using aminob) Graph the least squares best fit line on the scatter plotthat appears on https://d2lvgg3v3hfg70.cloudfront.net/TB5309/
.c) Approximately what proportion of the variability inacid ratio tenacity is explained by the linear relationship between tenacity and the amino acid ratio?
Unlock Deck
Unlock for access to all 29 flashcards in this deck.
Unlock Deck
k this deck
23
The theory of fiber strength suggests that the relationship between fiber tenacity and amino acid ratio is logarithmic, i.e ,where T is the tenacity and R is the amino acid ratio. Perform the appropriate transformation of variable(s) and fit this logarithmic model to the data
-What is the best fit line using thetransformed data?
,where T is the tenacity and R is the amino acid ratio. Perform the appropriate transformation of variable(s) and fit this logarithmic model to the data-What is the best fit line using thetransformed data?
Unlock Deck
Unlock for access to all 29 flashcards in this deck.
Unlock Deck
k this deck
24
Hemorrhagic disease in white-tailed deer is caused by a virus known as EHD.Immunity is given to fawns by transfer of EHD antibodies from the mother. In astudy to determine how long the maternal antibodies last, blood samples were takenfrom a large sample of fawns of varying ages. The mean levels of EHD antibodyconcentration and the associated ages of fawns are given in the table below.After using the data to fit a straight line model, Eˆ = a + bW , significant curvature wasdetected in the residual plot. Two nonlinear models were chosen for further analysis,the exponential and the power models. (For these data, common logs were used toperform the transformations.) The computer output for these models is given below,and the residual plots are on the next page.
Residual Plots
a) For the exponential model, calculate the predicted logarithm of the EHD antibodyconcentration for an age of 5 weeks.
b) Generally speaking, which of the two models, power or exponential, is a betterchoice for predicting the logarithm of the EHD antibody concentration?
Providestatistical justification for your choice based on both the residual plot and thenumerical summary statistics above.
c) The researchers want use their model to predict EHD antibody concentrations forfawns up to 24 weeks of age. Do you think this would be reasonable?
Explainwhy or why not.
Unlock Deck
Unlock for access to all 29 flashcards in this deck.
Unlock Deck
k this deck
25
In the 19th Century, venereal diseases were the major preventable diseases strikingsoldiers far from home. During the American Civil War, the United States Army keptrecords on soldiers diagnosed with syphilis and gonorrhea. An analysis of theincidence of these diseases for a sample of months is presented below. (Incidencerate is the number of cases per 100,000 soldiers.)Summary statistics from Regression AnalysisIncidence of syphilis and gonorrhea forthe years 1861 - 1865
a) For a month with an incidence rate for Syphilis that is one standard deviation abovethe mean rate, what would be the predicted incidence rate for gonorrhea?
b) What proportion of the variability in the gonorrhea incidence rate is accounted for bysyphilis incidence rate?
c) Suppose you are asked to assess the accuracy of the prediction of the gonorrheaincidence rate. What information above could be used to answer this question?
Unlock Deck
Unlock for access to all 29 flashcards in this deck.
Unlock Deck
k this deck
26
The Des Moines Register reported the ratings of high school sportsmanship as compiledby the Iowa High School Athletic Association. The participants and coaches from eachschool were rated by referees. (1 = superior, 5 = unsatisfactory.) A regression analysisof data on the average scores given to wrestling spectators and coaches is shown below. a) Interpret the value of the correlation between the ratings of spectators andwrestlers?
b) Interpret the value of the coefficient of determination.c) Interpret the value of the standard deviation about the least squares line.
a) Interpret the value of the correlation between the ratings of spectators andwrestlers?b) Interpret the value of the coefficient of determination.c) Interpret the value of the standard deviation about the least squares line.
Unlock Deck
Unlock for access to all 29 flashcards in this deck.
Unlock Deck
k this deck
27
The study of prehistoric birds depends on imprints of a prehistoric creature’s remains in stone, commonly known as fossils. To study ancient ecosystems effectively it would be useful know the actual mass of individual birds, but this information is not preserved in the fossil record. It seems reasonable that the biomechanics of birds is much the same today as in the past. For example, today’s relationship between the wing length and total weight of a bird should be very similar to that for birds from the distant past. The wing lengths of ancient birds are readily obtainable from the fossil record, but the weight is
not. A regression model expressing the relationship between wing length and total weight of modern birds could be used to estimate the mass of similar prehistoric birds. Data for some species of modern birds of prey and are given below.
-Investigators would like to model the relationship between Wing Length and Weight.The least squares line for predicting total weight using wing length as a predictor is ofinterest.
a) What is the equation of the least-squares line?
b) Graph the least-squares line on the scatter plot
c) Approximately what proportion of thevariability in weight is explained by thewing length?
Unlock Deck
Unlock for access to all 29 flashcards in this deck.
Unlock Deck
k this deck
28
Does the transformed model appear to be no improvement over the linear model, aslight improvement, or a significant improvement?
Justify your response with anappropriate statistical argument.
Justify your response with anappropriate statistical argument.
Unlock Deck
Unlock for access to all 29 flashcards in this deck.
Unlock Deck
k this deck
29
Assessing the "goodness" of a regression line involves considering several aspects ofthe fit. Consider the characteristics below. How does each contribute to anassessment of fit?
That is, for each characteristic, what about the given characteristicwould indicate that the regression line is "good"?
a) The shape of the residual plot
b) The correlation coefficient
c) The existence of outliersd) The coefficient of determination
That is, for each characteristic, what about the given characteristicwould indicate that the regression line is "good"?
a) The shape of the residual plot
b) The correlation coefficient
c) The existence of outliersd) The coefficient of determination
Unlock Deck
Unlock for access to all 29 flashcards in this deck.
Unlock Deck
k this deck
Unlock Deck
Unlock for access to all 29 flashcards in this deck.


