Deck 6: Random Variables and
Full screen (f)
Question
Question

Question
The probability of k successes among n independent trials, each with equalprobability of success, 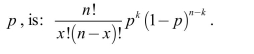
Question
Question
Question
Question
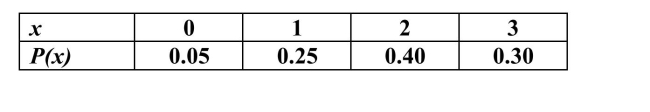
Each course at a large university has either a final exam or a final paper. The tablebelow presents the distribution of the number of final exams that students at theuniversity take in the Fall term, and their associated probabilities. What is the meanof this distribution?
Question
For a discrete random variable 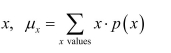
Question
Question
Question
Question

Question
For a discrete random variable, 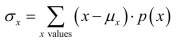
Question
Question
Question
Question

Question
Suppose that the distribution of maximum daily temperatures in Hacienda Heights,CA, for the month of December has a mean of 17˚Celsius with a standard deviation of3˚Celsius. Let the random variable F be the maximum daily temperature in degreesFahrenheit. The relation between Fahrenheit degrees (F) and Celsius degrees (C) is: 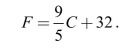 a) What is the mean of F?
b) What is the standard deviation of F?
a) What is the mean of F?b) What is the standard deviation of F?

Unlock Deck
Sign up to unlock the cards in this deck!
Unlock Deck
Unlock Deck
1/18
Play
Full screen (f)
Deck 6: Random Variables and
1
For every random variable, both discrete and continuous,P(a?x ?b) =P(a
False
2
True
3
The probability of k successes among n independent trials, each with equalprobability of success,
True
4
A state-wide math test consists of 50 True/False questions and 40 multiple choicequestions with 5 answer options. The total score (TS) is equal to the number oftrue/false items correct plus twice the number of multiple-choice items correct.a) For students who are randomly guessing, the distribution of scores on the 500.50. If we define the random variable T = score from T/F items, what are the meanand standard deviation of T for students who are guessing?
b) For students who are randomly guessing, the distribution of scores on the 40 multiplechoice questions is a binomial distribution with probability of success equal to 0.20.If we define the random variable M = score from multiple choice items, what are themean and standard deviation of M for students who are guessing?
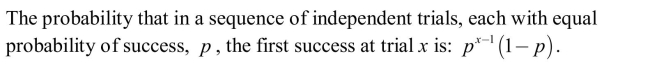
c) The total score, TS, is a random variable formed by calculating TM+ 2 . Using yourresults from parts (a) and (b), find the mean and standard deviation of the randomvariable TS.d) For students who randomly guess on the multiple choice part of the test, what is theprobability that the first question correct is the 4th question?
b) For students who are randomly guessing, the distribution of scores on the 40 multiplechoice questions is a binomial distribution with probability of success equal to 0.20.If we define the random variable M = score from multiple choice items, what are themean and standard deviation of M for students who are guessing?
c) The total score, TS, is a random variable formed by calculating TM+ 2 . Using yourresults from parts (a) and (b), find the mean and standard deviation of the randomvariable TS.d) For students who randomly guess on the multiple choice part of the test, what is theprobability that the first question correct is the 4th question?
Unlock Deck
Unlock for access to all 18 flashcards in this deck.
Unlock Deck
k this deck
5
Unlock Deck
Unlock for access to all 18 flashcards in this deck.
Unlock Deck
k this deck
6
A normal probability plot suggests that a normal probability model isplausible if there is no obvious pattern in the scatter of points.
Unlock Deck
Unlock for access to all 18 flashcards in this deck.
Unlock Deck
k this deck
7
Each course at a large university has either a final exam or a final paper. The tablebelow presents the distribution of the number of final exams that students at theuniversity take in the Fall term, and their associated probabilities. What is the meanof this distribution?
Unlock Deck
Unlock for access to all 18 flashcards in this deck.
Unlock Deck
k this deck
8
For a discrete random variable
Unlock Deck
Unlock for access to all 18 flashcards in this deck.
Unlock Deck
k this deck
9
What information about a probability distribution do the mean and standard deviationof a random variable provide?
Unlock Deck
Unlock for access to all 18 flashcards in this deck.
Unlock Deck
k this deck
10
A random variable is continuous if its possible values are all points insome interval.
Unlock Deck
Unlock for access to all 18 flashcards in this deck.
Unlock Deck
k this deck
11
One theory of why birds form in flocks is that flocks increase efficiency in scanningfor approaching predators. Because birds can barely move their eyes they must turntheir heads to look for predators, making them temporarily unable to peck for food. Ifthe birds form flocks, each bird could spend less time scanning; when a single birddetects a predator it alerts the other birds.
The Chanting Goshawk is a predator of the Red-billed Weaver bird. From fieldobservation it is estimated that an individual weaver bird has a probability of 0.20 ofdetecting a goshawk in time to fly to safety. Suppose that a goshawk suddenly comesupon a flock of 4 weaver birds pecking for food on the ground, and attacks.
a) What is the probability that none of the weaver birds will detect the goshawk'spresence before it is too late, thus allowing the goshawk to have a weaver birdlunch?
b) What is the probability that at least one of the weaver birds will detect thegoshawk's presence, thus alerting the others and all fly away, leaving thegoshawk hungry?
c) Suppose this is Wednesday, and all weaver birds form flocks of size 4 onWednesdays. Using your results from parts (a) and/or (b), find the probabilitythat a goshawk will go hungry until swooping down on the 5th flock of 4 weaverbirds seen that day.
Unlock Deck
Unlock for access to all 18 flashcards in this deck.
Unlock Deck
k this deck
12
Unlock Deck
Unlock for access to all 18 flashcards in this deck.
Unlock Deck
k this deck
13
For a discrete random variable,
Unlock Deck
Unlock for access to all 18 flashcards in this deck.
Unlock Deck
k this deck
14
A random variable is discrete if its value depends upon the outcome of achance experiment.
Unlock Deck
Unlock for access to all 18 flashcards in this deck.
Unlock Deck
k this deck
15
The distribution of all values of a random variable is called a normaldistribution.
Unlock Deck
Unlock for access to all 18 flashcards in this deck.
Unlock Deck
k this deck
16
For a continuous random variable x, the area under the density curve abovean interval a to b represents the probability that the value of x is between aand b.
Unlock Deck
Unlock for access to all 18 flashcards in this deck.
Unlock Deck
k this deck
17
Unlock Deck
Unlock for access to all 18 flashcards in this deck.
Unlock Deck
k this deck
18
Suppose that the distribution of maximum daily temperatures in Hacienda Heights,CA, for the month of December has a mean of 17˚Celsius with a standard deviation of3˚Celsius. Let the random variable F be the maximum daily temperature in degreesFahrenheit. The relation between Fahrenheit degrees (F) and Celsius degrees (C) is: a) What is the mean of F?
b) What is the standard deviation of F?
a) What is the mean of F?b) What is the standard deviation of F?
Unlock Deck
Unlock for access to all 18 flashcards in this deck.
Unlock Deck
k this deck
Unlock Deck
Unlock for access to all 18 flashcards in this deck.


