Deck 12: Asking and Answering Questions About a Population Mean
Full screen (f)
Question
Question

Question

Question
Question
Question
Question
Question
A very large study of college students' study habits found that the time (in hours) thatfreshmen study each week is approximately normal with mean 24 hours and standarddeviation 8 hours. Consider random samples of size 16 from the population of freshmen.
a) On the axes below, sketch curves representing the distribution of the original populationand the sampling distribution of for samples of size n =16 . Be sure to indicate whichcurve is which. What are the mean and standard deviation of the sampling distributionof ?
b) What is the probability that a sample of size n = 16 from this population would result ina sample mean greater than 30 hours?
The study of college freshmen also asked about the students' time spent playing video games.Suppose that the population relative frequency histogram for time spend playing video games isas shown below. The mean amount of time spent playing video games was 0.8 hours per week.Relative Frequency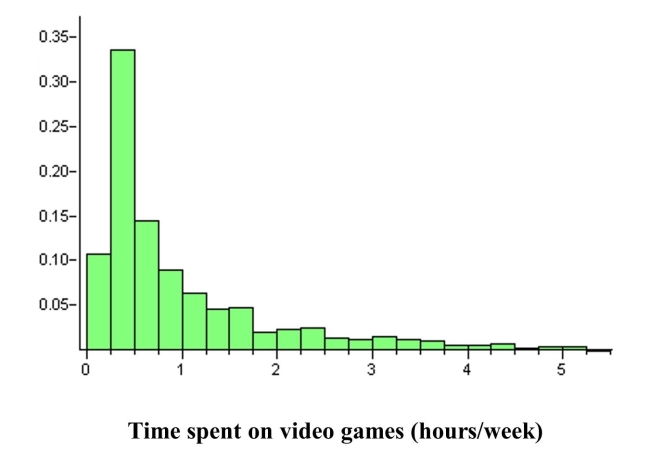
c) Suppose you were to take a random sample, n = 4, from this population of freshmen andask them how much time they spent playing video games per week. Describe the shape,center, and spread of the sampling distribution of , as compared to the populationdistribution.
Question
Question
Question
Question
When the hatching of young geese is very near, the father guards the nest to defend itfrom predators that may be attracted by the hatchlings noisy entrance into the world.The following data are the typical distances from the nest for 24 soon to be fathergeese. A biologist would like to construct a 95% confidence interval for the meandistance of future father geese from the nest during this period. (Distances are in km.) 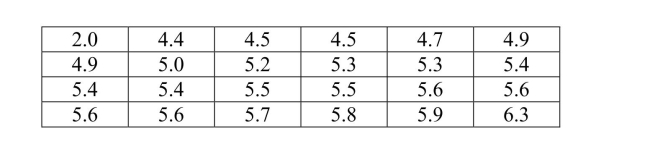
a) Using a graphical display of your choice, display the data in a way that will allowyou to determine whether it would be appropriate to use a 95% t confidenceinterval to estimate the population mean.
b) Using the graphical display from part (a), would you advise that constructing a95% t confidence interval is appropriate?
Explain the basis of yourrecommendation.
Question
Question
One indicator of the health of field mice is the length of their tails. The followingdata on tail length (in mm) were gathered from a representative sample of field micenear Fairfield, Iowa. A biologist would like to construct a 95% confidence intervalfor the population mean tail length of the field mice near Fairfield. 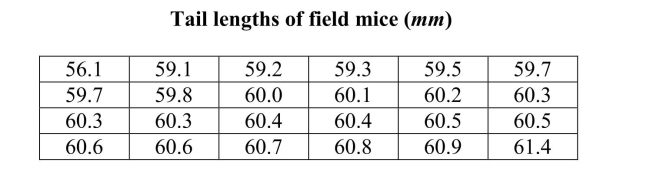
a) Using a graphical display of your choice, display the data in a way that will allowyou to determine whether it would be appropriate to use a t confidence interval toestimate the population mean.
b) Using the graphical display from part (a), would you advise that constructing a tconfidence interval is appropriate?
Explain the basis of your recommendation.
Question

Question
Question
Question
Give as much information as you can about the P-value of a t-test in the followingsituations: 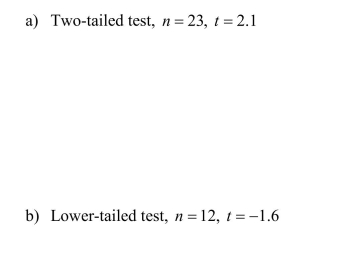
Question
Question
Question
Question
Question
Question
Question
The department of natural resources classifies a fish to be unsafe to eat if itspolychlorinated biphenol (PCB) concentration exceeds 5 parts per billion (ppb). Arandom sample of 10 fish taken from a local lake resulted in the concentrations listedbelow: 
The department if natural resources is concerned that the mean PCB concentration forfish from this lake exceeds 5 ppb.
a) What null and alternative hypotheses should the investigators use?
In a fewsentences, justify your choice of the alternative hypothesis.
b) Using a graphic technique of your choice, show that the t-procedures areappropriate to use with these data.
c) Using your hypotheses from part (a), carry out a hypothesis test using ?= 0.05and interpret the results.
d) In the context of this study, describe a Type I and a Type II error.
Question
Question
A boat manufacturer claims that a particular boat model and motor combination willburn less than 4.0 gallons of fuel per hour. Fuel consumption for a random sample of10 similar boats was measured, resulting in the data below: 
A consumer group is interested in determining if there is convincing evidence that themanufacturer's claim is correct.
a) What null and alternative hypotheses should the investigators use?
In a fewsentences, justify your choice of the alternative hypothesis.
b) Using a graphic technique of your choice, show that the t-procedures areappropriate to use with these data.
c) Using your hypotheses from part (a), carry out a hypothesis test using ?= 0.05and interpret the results.
d) In the context of this study, describe a Type I and a Type II error.
Question
At the Billy Goat Gruff Inn, machines are set to dispense 600 ml of soda into everycustomer's glass. Over time, however, the machine can get "out of control" and dispense toomuch soda or too little. The machine needs adjustment if the mean amount dispensed isdifferent than 600 ml. At a randomly selected time each clock hour, the owner dispenses andchecks a glass of soda and determines the actual volume of soda dispensed. One day thevolumes (in ml) of the dispensed soda were: 
Is there sufficient evidence to conclude that the dispensing machine needs adjustment?
Is there sufficient evidence to conclude that the dispensing machine needs adjustment?
Question
Many national parks, wildlife refuges, and wilderness areas lie directly below designatedmilitary air space. This raises issues of whether wildlife and loud jet noises are compatible.In an effort to evaluate the effects of low-altitude jet-noise, researchers simulated thesenoises for a representative sample of captive desert mule deer. Three minutes after the loudnoises were played, the heart rates (beats per minute) of these animals was measured, withthe following results: 
a) Calculate and interpret a 95% confidence interval for the mean heart rate 3 minutes afterloud jet noises.
b) The usual mean heart rate for desert mule deer is about 51.2 beats per minute. Does theconfidence interval in part (a) support the view that the loud jet noise has some lingeringeffect on the heart rate of desert mule deer?
Explain, using appropriate statisticallanguage.
Question
Question
Logging activity in forests is thought to affect the behavior of black bears (Ursusamericanus). An important measure of animal behavior is the home range, the area used byanimals in their lives. In a study of black bears in a logged Canadian forest, the spring andearly summer home range (in km2 ) of 12 radio-collared female black bears was measuredwith the following results: 
a) Construct and interpret a 95% confidence interval for the mean home range of femaleblack bears in this logged forest.
b) The typical home range of females in forests with no logging is 20 km2 . Based on theconfidence interval from part (a), do you think that the mean home range size of femalesin this logged forest could be the same as the mean home range size in non-loggedforests?
Question
The State Fisheries Department wishes to stock the Styx River with fish, and would like thespecies to not only survive but thrive. The "substrate" (pebble size at bottom) of a river is animportant determinant of the quality of spawning habitat. Unknown to the Fisheriesofficials, the pebble diameters in the Sty x River are approximately normally distributed witha mean of 24 mm, and a standard deviation of 8 mm. Fisheries officials will select a randomsample of pebbles in an attempt to estimate the average pebble size.
a) On the scale below, sketch two curves, one representing the distribution of the originalpopulation and the other the sampling distribution of for a sample of size n =16 . Besure to indicate which curve is which. What are the mean and standard deviation of thesampling distribution of ?
b) What is the approximate probability that a sample of n = 16 from this population wouldresult in a sample mean greater than 30 mm?
The graph below is a relative frequency histogram of the lengths of the gentle Hecate fish in theStyx River, as recorded during a large fish tagging survey. You can assume that this histogramrepresents the population of fish lengths.Relative Frequency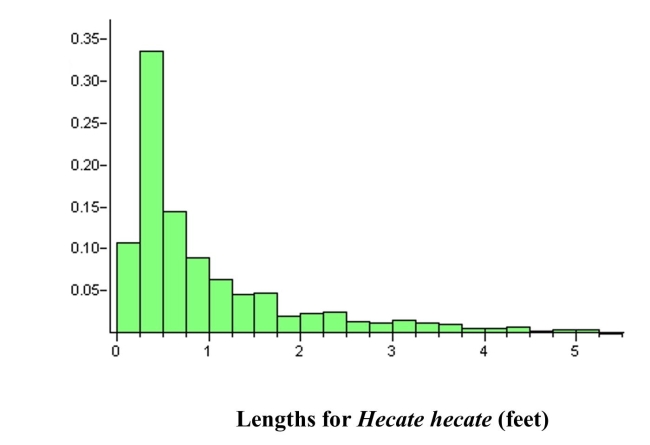
c) Suppose you were to take a random sample, n = 4, from this population of fish andmeasure their lengths. Describe the shape, center, and spread of the samplingdistribution of , as compared to the population distribution.
Question
A company provides portable walkie-talkies to construction crews. Their batteries last, onaverage, 55 hours of continuous use. The purchasing manager receives a brochureadvertising a new brand of batteries with a lower price, but suspects that the lifetime of thebatteries may be shorter than the brand currently in use. To test this, 8 randomly selectednew brand batteries are installed in the same model radio. Here are the results for thelifetime of the batteries (in hours): 
Is there sufficient evidence to conclude that the purchasing manager is correct in hisconjecture that the new brand has a shorter average lifetime?
Is there sufficient evidence to conclude that the purchasing manager is correct in hisconjecture that the new brand has a shorter average lifetime?

Unlock Deck
Sign up to unlock the cards in this deck!
Unlock Deck
Unlock Deck
1/34
Play
Full screen (f)
Deck 12: Asking and Answering Questions About a Population Mean
1
A statistic is a characteristic of a population.
False
2
True
3
False
4
We say that the result of a hypothesis test is "statistically significant"when the P-value is less than or equal to ?.
Unlock Deck
Unlock for access to all 34 flashcards in this deck.
Unlock Deck
k this deck
5
Unlock Deck
Unlock for access to all 34 flashcards in this deck.
Unlock Deck
k this deck
6
Unlock Deck
Unlock for access to all 34 flashcards in this deck.
Unlock Deck
k this deck
7
Consider sampling from a normal population with a population mean µ and standarddeviation ?. As the sample size, n, increases, some characteristics of the sampling distribution of the sample mean, , may change. Which of the following characteristics will change as n increases, and what is the nature of the change?
a) The mean of the sampling distribution of
b) The standard deviation of the sampling distribution of
c) The shape of the sampling distribution of
a) The mean of the sampling distribution of
b) The standard deviation of the sampling distribution of
c) The shape of the sampling distribution of
Unlock Deck
Unlock for access to all 34 flashcards in this deck.
Unlock Deck
k this deck
8
A very large study of college students' study habits found that the time (in hours) thatfreshmen study each week is approximately normal with mean 24 hours and standarddeviation 8 hours. Consider random samples of size 16 from the population of freshmen.
a) On the axes below, sketch curves representing the distribution of the original populationand the sampling distribution of for samples of size n =16 . Be sure to indicate whichcurve is which. What are the mean and standard deviation of the sampling distributionof ?
b) What is the probability that a sample of size n = 16 from this population would result ina sample mean greater than 30 hours?
The study of college freshmen also asked about the students' time spent playing video games.Suppose that the population relative frequency histogram for time spend playing video games isas shown below. The mean amount of time spent playing video games was 0.8 hours per week.Relative Frequency
c) Suppose you were to take a random sample, n = 4, from this population of freshmen andask them how much time they spent playing video games per week. Describe the shape,center, and spread of the sampling distribution of , as compared to the populationdistribution.
a) On the axes below, sketch curves representing the distribution of the original populationand the sampling distribution of for samples of size n =16 . Be sure to indicate whichcurve is which. What are the mean and standard deviation of the sampling distributionof ?
b) What is the probability that a sample of size n = 16 from this population would result ina sample mean greater than 30 hours?
The study of college freshmen also asked about the students' time spent playing video games.Suppose that the population relative frequency histogram for time spend playing video games isas shown below. The mean amount of time spent playing video games was 0.8 hours per week.Relative Frequency
c) Suppose you were to take a random sample, n = 4, from this population of freshmen andask them how much time they spent playing video games per week. Describe the shape,center, and spread of the sampling distribution of , as compared to the populationdistribution.
Unlock Deck
Unlock for access to all 34 flashcards in this deck.
Unlock Deck
k this deck
9
All other things being equal, choosing a smaller value of ? will increasethe probability of making a type II error.
Unlock Deck
Unlock for access to all 34 flashcards in this deck.
Unlock Deck
k this deck
10
If the null hypothesis is not rejected, there is strong statistical evidencethat the null hypothesis is true.
Unlock Deck
Unlock for access to all 34 flashcards in this deck.
Unlock Deck
k this deck
11
Describe in a few sentences how each of the following affects the power of a test:
a) The size of the difference between the actual value and the hypothesized value ofthe population mean.
b) The significance level, ?
c) The sample size
a) The size of the difference between the actual value and the hypothesized value ofthe population mean.
b) The significance level, ?
c) The sample size
Unlock Deck
Unlock for access to all 34 flashcards in this deck.
Unlock Deck
k this deck
12
When the hatching of young geese is very near, the father guards the nest to defend itfrom predators that may be attracted by the hatchlings noisy entrance into the world.The following data are the typical distances from the nest for 24 soon to be fathergeese. A biologist would like to construct a 95% confidence interval for the meandistance of future father geese from the nest during this period. (Distances are in km.)
a) Using a graphical display of your choice, display the data in a way that will allowyou to determine whether it would be appropriate to use a 95% t confidenceinterval to estimate the population mean.
b) Using the graphical display from part (a), would you advise that constructing a95% t confidence interval is appropriate?
Explain the basis of yourrecommendation.
Unlock Deck
Unlock for access to all 34 flashcards in this deck.
Unlock Deck
k this deck
13
The level of significance of a test is the probability of making a type Ierror.
Unlock Deck
Unlock for access to all 34 flashcards in this deck.
Unlock Deck
k this deck
14
One indicator of the health of field mice is the length of their tails. The followingdata on tail length (in mm) were gathered from a representative sample of field micenear Fairfield, Iowa. A biologist would like to construct a 95% confidence intervalfor the population mean tail length of the field mice near Fairfield.
a) Using a graphical display of your choice, display the data in a way that will allowyou to determine whether it would be appropriate to use a t confidence interval toestimate the population mean.
b) Using the graphical display from part (a), would you advise that constructing a tconfidence interval is appropriate?
Explain the basis of your recommendation.
Unlock Deck
Unlock for access to all 34 flashcards in this deck.
Unlock Deck
k this deck
15
Unlock Deck
Unlock for access to all 34 flashcards in this deck.
Unlock Deck
k this deck
16
The t confidence interval formula for estimating µ is appropriate whenthe population being sampled is approximately normally distributed.
Unlock Deck
Unlock for access to all 34 flashcards in this deck.
Unlock Deck
k this deck
17
A t curve is bell-shaped like the z curve but is less spread out.
Unlock Deck
Unlock for access to all 34 flashcards in this deck.
Unlock Deck
k this deck
18
Give as much information as you can about the P-value of a t-test in the followingsituations:
Unlock Deck
Unlock for access to all 34 flashcards in this deck.
Unlock Deck
k this deck
19
A random sample of size n = 36 is selected from a population with mean µ= 50 andstandard deviation ? =12 . Determine the mean and standard deviation of thesampling distribution of .
Unlock Deck
Unlock for access to all 34 flashcards in this deck.
Unlock Deck
k this deck
20
Unlock Deck
Unlock for access to all 34 flashcards in this deck.
Unlock Deck
k this deck
21
In a few sentences, describe the difference between statistical and practicalsignificance.
Unlock Deck
Unlock for access to all 34 flashcards in this deck.
Unlock Deck
k this deck
22
Give as much information as you can about the P-value of a t-test in the followingsituations:
a) Two-tailed test, nt=14, = 2.4
b) Upper-tailed test, nt= 22, =1.9
a) Two-tailed test, nt=14, = 2.4
b) Upper-tailed test, nt= 22, =1.9
Unlock Deck
Unlock for access to all 34 flashcards in this deck.
Unlock Deck
k this deck
23
In a few sentences, describe the difference between statistical and practicalsignificance.
Unlock Deck
Unlock for access to all 34 flashcards in this deck.
Unlock Deck
k this deck
24
When performing hypothesis tests, there are assumptions that must be met in order for the testto be appropriate. Describe the assumptions associated with a hypothesis test about apopulation mean when the sample size is small. For any assumptions that can be checkedusing sample data, describe how the check would be performed.
Unlock Deck
Unlock for access to all 34 flashcards in this deck.
Unlock Deck
k this deck
25
The department of natural resources classifies a fish to be unsafe to eat if itspolychlorinated biphenol (PCB) concentration exceeds 5 parts per billion (ppb). Arandom sample of 10 fish taken from a local lake resulted in the concentrations listedbelow:
The department if natural resources is concerned that the mean PCB concentration forfish from this lake exceeds 5 ppb.
a) What null and alternative hypotheses should the investigators use?
In a fewsentences, justify your choice of the alternative hypothesis.
b) Using a graphic technique of your choice, show that the t-procedures areappropriate to use with these data.
c) Using your hypotheses from part (a), carry out a hypothesis test using ?= 0.05and interpret the results.
d) In the context of this study, describe a Type I and a Type II error.
Unlock Deck
Unlock for access to all 34 flashcards in this deck.
Unlock Deck
k this deck
26
When performing hypothesis tests, there are assumptions that must be met in order for the testto be appropriate. Describe the assumptions associated with a hypothesis test about apopulation mean when the sample size is small. For any assumptions that can be checkedusing sample data, describe how the check would be performed.
Unlock Deck
Unlock for access to all 34 flashcards in this deck.
Unlock Deck
k this deck
27
A boat manufacturer claims that a particular boat model and motor combination willburn less than 4.0 gallons of fuel per hour. Fuel consumption for a random sample of10 similar boats was measured, resulting in the data below:
A consumer group is interested in determining if there is convincing evidence that themanufacturer's claim is correct.
a) What null and alternative hypotheses should the investigators use?
In a fewsentences, justify your choice of the alternative hypothesis.
b) Using a graphic technique of your choice, show that the t-procedures areappropriate to use with these data.
c) Using your hypotheses from part (a), carry out a hypothesis test using ?= 0.05and interpret the results.
d) In the context of this study, describe a Type I and a Type II error.
Unlock Deck
Unlock for access to all 34 flashcards in this deck.
Unlock Deck
k this deck
28
At the Billy Goat Gruff Inn, machines are set to dispense 600 ml of soda into everycustomer's glass. Over time, however, the machine can get "out of control" and dispense toomuch soda or too little. The machine needs adjustment if the mean amount dispensed isdifferent than 600 ml. At a randomly selected time each clock hour, the owner dispenses andchecks a glass of soda and determines the actual volume of soda dispensed. One day thevolumes (in ml) of the dispensed soda were:
Is there sufficient evidence to conclude that the dispensing machine needs adjustment?
Is there sufficient evidence to conclude that the dispensing machine needs adjustment?
Unlock Deck
Unlock for access to all 34 flashcards in this deck.
Unlock Deck
k this deck
29
Many national parks, wildlife refuges, and wilderness areas lie directly below designatedmilitary air space. This raises issues of whether wildlife and loud jet noises are compatible.In an effort to evaluate the effects of low-altitude jet-noise, researchers simulated thesenoises for a representative sample of captive desert mule deer. Three minutes after the loudnoises were played, the heart rates (beats per minute) of these animals was measured, withthe following results:
a) Calculate and interpret a 95% confidence interval for the mean heart rate 3 minutes afterloud jet noises.
b) The usual mean heart rate for desert mule deer is about 51.2 beats per minute. Does theconfidence interval in part (a) support the view that the loud jet noise has some lingeringeffect on the heart rate of desert mule deer?
Explain, using appropriate statisticallanguage.
Unlock Deck
Unlock for access to all 34 flashcards in this deck.
Unlock Deck
k this deck
30
Describe in a few sentences how each of the following affects the power of a test:
a) The size of the difference between the actual value and the hypothesized value ofthe population mean.
b) The significance level, ?
c) The sample size
a) The size of the difference between the actual value and the hypothesized value ofthe population mean.
b) The significance level, ?
c) The sample size
Unlock Deck
Unlock for access to all 34 flashcards in this deck.
Unlock Deck
k this deck
31
Logging activity in forests is thought to affect the behavior of black bears (Ursusamericanus). An important measure of animal behavior is the home range, the area used byanimals in their lives. In a study of black bears in a logged Canadian forest, the spring andearly summer home range (in km2 ) of 12 radio-collared female black bears was measuredwith the following results:
a) Construct and interpret a 95% confidence interval for the mean home range of femaleblack bears in this logged forest.
b) The typical home range of females in forests with no logging is 20 km2 . Based on theconfidence interval from part (a), do you think that the mean home range size of femalesin this logged forest could be the same as the mean home range size in non-loggedforests?
Unlock Deck
Unlock for access to all 34 flashcards in this deck.
Unlock Deck
k this deck
32
The State Fisheries Department wishes to stock the Styx River with fish, and would like thespecies to not only survive but thrive. The "substrate" (pebble size at bottom) of a river is animportant determinant of the quality of spawning habitat. Unknown to the Fisheriesofficials, the pebble diameters in the Sty x River are approximately normally distributed witha mean of 24 mm, and a standard deviation of 8 mm. Fisheries officials will select a randomsample of pebbles in an attempt to estimate the average pebble size.
a) On the scale below, sketch two curves, one representing the distribution of the originalpopulation and the other the sampling distribution of for a sample of size n =16 . Besure to indicate which curve is which. What are the mean and standard deviation of thesampling distribution of ?
b) What is the approximate probability that a sample of n = 16 from this population wouldresult in a sample mean greater than 30 mm?
The graph below is a relative frequency histogram of the lengths of the gentle Hecate fish in theStyx River, as recorded during a large fish tagging survey. You can assume that this histogramrepresents the population of fish lengths.Relative Frequency
c) Suppose you were to take a random sample, n = 4, from this population of fish andmeasure their lengths. Describe the shape, center, and spread of the samplingdistribution of , as compared to the population distribution.
a) On the scale below, sketch two curves, one representing the distribution of the originalpopulation and the other the sampling distribution of for a sample of size n =16 . Besure to indicate which curve is which. What are the mean and standard deviation of thesampling distribution of ?
b) What is the approximate probability that a sample of n = 16 from this population wouldresult in a sample mean greater than 30 mm?
The graph below is a relative frequency histogram of the lengths of the gentle Hecate fish in theStyx River, as recorded during a large fish tagging survey. You can assume that this histogramrepresents the population of fish lengths.Relative Frequency
c) Suppose you were to take a random sample, n = 4, from this population of fish andmeasure their lengths. Describe the shape, center, and spread of the samplingdistribution of , as compared to the population distribution.
Unlock Deck
Unlock for access to all 34 flashcards in this deck.
Unlock Deck
k this deck
33
A company provides portable walkie-talkies to construction crews. Their batteries last, onaverage, 55 hours of continuous use. The purchasing manager receives a brochureadvertising a new brand of batteries with a lower price, but suspects that the lifetime of thebatteries may be shorter than the brand currently in use. To test this, 8 randomly selectednew brand batteries are installed in the same model radio. Here are the results for thelifetime of the batteries (in hours):
Is there sufficient evidence to conclude that the purchasing manager is correct in hisconjecture that the new brand has a shorter average lifetime?
Is there sufficient evidence to conclude that the purchasing manager is correct in hisconjecture that the new brand has a shorter average lifetime?
Unlock Deck
Unlock for access to all 34 flashcards in this deck.
Unlock Deck
k this deck
Unlock Deck
Unlock for access to all 34 flashcards in this deck.


