Deck 8: Regression Wisdom
Full screen (f)
Question
Question
Question
Question
Question
Question
Question
Question
Question
Question
Question
Question
Question
Question
Question
Question
Question
Question
Linear regression was used to describe the trend in world population over timE.Below is a
Plot of the residuals versus predicted values.What does the plot of residuals suggest?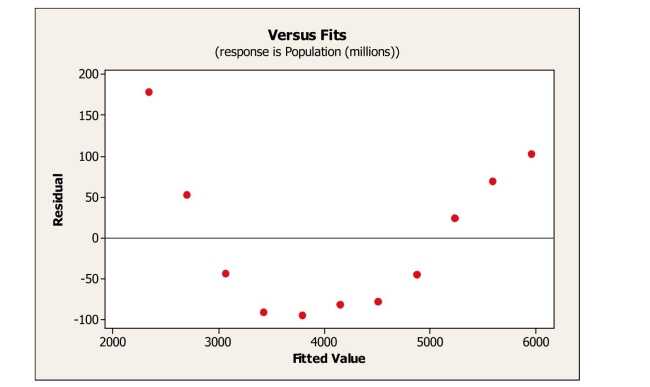
A)An outlier is present in the data set.
B)The linearity condition is not satisfied.
C)A high leverage point is present in the data set.
D)The data are not normal.
Plot of the residuals versus predicted values.What does the plot of residuals suggest?
A)An outlier is present in the data set.
B)The linearity condition is not satisfied.
C)A high leverage point is present in the data set.
D)The data are not normal.

Unlock Deck
Sign up to unlock the cards in this deck!
Unlock Deck
Unlock Deck
1/18
Play
Full screen (f)
Deck 8: Regression Wisdom
1
Which statement about re-expressing data is not true?
I.Unimodal distributions that are skewed to the left will be made more symmetric by taking The square root of the variable.
II.A curve in which the direction of the association changes from negative to positive will Not benefit from re-expression.
III.One goal of re-expression may be to make the variability of the response variable more Uniform.
A)I only
B)III only
C)II only
D)II and III
E)I,IIandIII
I,IIandIII
2
Two variables that are actually not related to each other may nonetheless have a very high Correlation because they both result from some other, possibly hidden, factor.This is an Example of
A)leverage.
B)regression.
C)an outlier.
D)a lurking variable.
E)extrapolation.
A)leverage.
B)regression.
C)an outlier.
D)a lurking variable.
E)extrapolation.
a lurking variable.
3
Which statement about residuals plots is true?
I)A curved pattern indicates nonlinear association between the variables.
II)A pattern of increasing spread indicates the predicted values become less reliable as the
Explanatory variable increases.
III)Randomness in the residuals indicates the model will predict accurately.
A)I only
B)II only
C)I, II, and III
D)I and III only
E)I and II only
E
4
A scatterplot of log(Y) vs.log(X) reveals a linear pattern with very little scatter.It is Probably true that …
A)the calculator's LnReg function will model the association between X and Y.
B)the residuals plot for regression of Y on X shows a curved pattern.
C)the correlation between X and Y is near 0.
D)the correlation between X and Y is near +1.
E)the scatterplot of Y vs X shows a linear association.
A)the calculator's LnReg function will model the association between X and Y.
B)the residuals plot for regression of Y on X shows a curved pattern.
C)the correlation between X and Y is near 0.
D)the correlation between X and Y is near +1.
E)the scatterplot of Y vs X shows a linear association.
Unlock Deck
Unlock for access to all 18 flashcards in this deck.
Unlock Deck
k this deck
5
If a data point is influential it…
A)has a small residual.
B)is guaranteed to be extreme in the vertical direction.
C)is guaranteed to be extreme in the horizontal direction.
D)will change the slope of the regression equation.
E)none of these.
A)has a small residual.
B)is guaranteed to be extreme in the vertical direction.
C)is guaranteed to be extreme in the horizontal direction.
D)will change the slope of the regression equation.
E)none of these.
Unlock Deck
Unlock for access to all 18 flashcards in this deck.
Unlock Deck
k this deck
6
Unlock Deck
Unlock for access to all 18 flashcards in this deck.
Unlock Deck
k this deck
7
Which is true?
I.Random scatter in the residuals indicates a model with high predictive power.
II.If two variables are very strongly associated, then the correlation between them will be near +1.0 or -1.0.
III.The higher the correlation between two variables the more likely the association is based in cause and effect.
A)I, II, and III
B)none
C)I only
D)I and II
E)II only
Unlock Deck
Unlock for access to all 18 flashcards in this deck.
Unlock Deck
k this deck
8
Which of the following is not a goal of re-expressing data?
A)Make the scatter in a scatterplot spread out evenly rather than following a fan shape.
B)Make the spread of several groups more alike.
C)All of these are goals of re-expressing data.
D)Make the form of a scatterplot more nearly linear.
E)Make the distribution of a variable more symmetric.
A)Make the scatter in a scatterplot spread out evenly rather than following a fan shape.
B)Make the spread of several groups more alike.
C)All of these are goals of re-expressing data.
D)Make the form of a scatterplot more nearly linear.
E)Make the distribution of a variable more symmetric.
Unlock Deck
Unlock for access to all 18 flashcards in this deck.
Unlock Deck
k this deck
9
A residuals plot is useful because
I)it will help us to see whether our model is appropriate.
II)it might show a pattern in the data that was hard to see in the original scatterplot.
III)it will clearly identify influential points.
A)I and II only
B)I, II, and III
C)II only
D)I only
E)I and III only
I)it will help us to see whether our model is appropriate.
II)it might show a pattern in the data that was hard to see in the original scatterplot.
III)it will clearly identify influential points.
A)I and II only
B)I, II, and III
C)II only
D)I only
E)I and III only
Unlock Deck
Unlock for access to all 18 flashcards in this deck.
Unlock Deck
k this deck
10
Unlock Deck
Unlock for access to all 18 flashcards in this deck.
Unlock Deck
k this deck
11
Unlock Deck
Unlock for access to all 18 flashcards in this deck.
Unlock Deck
k this deck
12
Which of the following is not a source of caution in regression between two variables?
A)subgroups with differences
B)extrapolation
C)a lurking variable
D)an outlier
E)all of these are potential problems.
A)subgroups with differences
B)extrapolation
C)a lurking variable
D)an outlier
E)all of these are potential problems.
Unlock Deck
Unlock for access to all 18 flashcards in this deck.
Unlock Deck
k this deck
13
Over the past decade a farmer has been able to increase his wheat production by about the Same number of bushels each year.His most useful predictive model is probably…
A)linear
B)logarithmic
C)quadratic
D)exponential
E)power
A)linear
B)logarithmic
C)quadratic
D)exponential
E)power
Unlock Deck
Unlock for access to all 18 flashcards in this deck.
Unlock Deck
k this deck
14
A residual plot that has no pattern is a sign that…
A)the original data is straight and the regression line is a good model.
B)the original data is straight and the regression line is not a good model.
C)the model is not a good one, because there is no pattern.
D)the original data is curved and the regression line is not a good model.
A)the original data is straight and the regression line is a good model.
B)the original data is straight and the regression line is not a good model.
C)the model is not a good one, because there is no pattern.
D)the original data is curved and the regression line is not a good model.
Unlock Deck
Unlock for access to all 18 flashcards in this deck.
Unlock Deck
k this deck
15
Which statement about correlation is true?
I.Regression based on data that are summary statistics tends to result in a higher
Correlation.
II.
III.An outlier always decreases the correlation.
A)I only
B)II only
C)III only
D)I, II, and III
E)none of these
I.Regression based on data that are summary statistics tends to result in a higher
Correlation.
II.
III.An outlier always decreases the correlation.
A)I only
B)II only
C)III only
D)I, II, and III
E)none of these
Unlock Deck
Unlock for access to all 18 flashcards in this deck.
Unlock Deck
k this deck
16
Another farmer has increased his wheat production by about the same percentage each year.
His most useful predictive model is probably…
A)linear
B)exponential
C)logarithmic
D)quadratic
E)power
His most useful predictive model is probably…
A)linear
B)exponential
C)logarithmic
D)quadratic
E)power
Unlock Deck
Unlock for access to all 18 flashcards in this deck.
Unlock Deck
k this deck
17
When using midterm exam scores to predict a student's final grade in a class, the student Would prefer to have a
A)negative residual, because that means the student's final grade is lower than we would predict with the model.
B)residual equal to zero, because that means the student's final grade is exactly what we would predict with the model.
C)positive residual, because that means the student's final grade is lower than we would predict with the model.
D)positive residual, because that means the student's final grade is higher than we would predict with the model.
E)negative residual, because that means the students final grade is higher than we would predict with the model.
Unlock Deck
Unlock for access to all 18 flashcards in this deck.
Unlock Deck
k this deck
18
Linear regression was used to describe the trend in world population over timE.Below is a
Plot of the residuals versus predicted values.What does the plot of residuals suggest?
A)An outlier is present in the data set.
B)The linearity condition is not satisfied.
C)A high leverage point is present in the data set.
D)The data are not normal.
Plot of the residuals versus predicted values.What does the plot of residuals suggest?
A)An outlier is present in the data set.
B)The linearity condition is not satisfied.
C)A high leverage point is present in the data set.
D)The data are not normal.
Unlock Deck
Unlock for access to all 18 flashcards in this deck.
Unlock Deck
k this deck
Unlock Deck
Unlock for access to all 18 flashcards in this deck.


