Deck 8: Inferences From Samples to Populations
Full screen (f)
Question
Question
Question
Question
Question
Question
Solve the problem. Round your answer to one decimal place unless otherwise indicated.
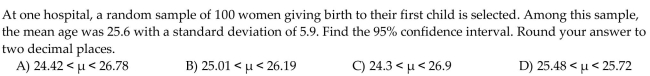
Ten apples of a particular variety are selected at random and weighed. The weights (in ounces)are as follows: Estimate the mean weight of all apples of this variety.
A)7.7 ounces
B)It is not possible to estimate the population mean from this sample data
C)8.0 ounces
D)7.8 ounces
Ten apples of a particular variety are selected at random and weighed. The weights (in ounces)are as follows:
Estimate the mean weight of all apples of this variety.A)7.7 ounces
B)It is not possible to estimate the population mean from this sample data
C)8.0 ounces
D)7.8 ounces
Question
Question
Question
Question
Question
Question
Question
Question
Question
Question
Question
Question
Question
Question
Question
Question
Question
Question
Question
Question
Question
Question
Question
Question
Question
Question
Question
Question
Question
Question
Question
Question
Question
Question
Question
Question
Question
Question
Question

Question
Question

Question
Find an estimate of the sample size needed to obtain the specified margin of error for the 95% confidence interval of a
population mean.

population mean.
Question
Question
Question
Question
Question
Question
Question
Find an estimate of the sample size needed to obtain the specified margin of error for the 95% confidence interval of a
population mean.

population mean.
Question
Find an estimate of the sample size needed to obtain the specified margin of error for the 95% confidence interval of a
population mean.

population mean.
Question
Question
Find an estimate of the sample size needed to obtain the specified margin of error for the 95% confidence interval of a
population mean.

population mean.
Question

Question
Question
Question
Question
Question
Question
Question
Question

Question
Question

Question

Question
Question
Question
Question

Question
Question
Question
Question
Question
Question

Unlock Deck
Sign up to unlock the cards in this deck!
Unlock Deck
Unlock Deck
1/100
Play
Full screen (f)
Deck 8: Inferences From Samples to Populations
1
Solve the problem. Round your answer to one decimal place unless otherwise indicated.
-A researcher for a car insurance company wishes to estimate the mean annual premium that men aged 20-24 pay for their car insurance. When 16 men aged between 20 and 24 were randomly selected and surveyed on their annual car insurance premiums, a mean of $760 was obtained. Based on this sample statistic, what is the best estimate of the mean annual car insurance premium for all men aged between 20 and 24? Round your answer to the nearest dollar.
A)$741
B)$750
C)$760
D)$737
$760
2
Solve the problem. Round your answer to one decimal place, if necessary.
-The distribution of sample means for a group of test scores for samples of 100 scores is normal with a mean of 63.9 and a standard deviation of 1.8. Suppose you take a sample of 100 test scores and find that the mean is 65.5.
How many standard deviations is the sample mean from the mean of the distribution of sample means?
A)1.6 standard deviation(s)above the mean
B)0.8 standard deviation(s)above the mean
C)0.9 standard deviation(s)above the mean
D)8.9 standard deviation(s)above the mean
0.9 standard deviation(s)above the mean
3
There are 310 teachers at a college. In a sample of 118 teachers from this college,the proportion who had doctorates was 0.55. Based on that sample statistic, what is the best estimate of the proportion for all teachers at
This college?
A)171
B)0.45
C)0.55
D)0.58
This college?
A)171
B)0.45
C)0.55
D)0.58
0.55
4
Nine employees of a company are selected at random and asked how far they commute to work each day. The distances (in miles)are as follows:
Estimate the mean commute distance of all employees of the company.
A)26.7 miles
B)26 miles
C)It is not possible to estimate the population mean from this sample data
D)25.5 miles
Estimate the mean commute distance of all employees of the company.
A)26.7 miles
B)26 miles
C)It is not possible to estimate the population mean from this sample data
D)25.5 miles
Unlock Deck
Unlock for access to all 100 flashcards in this deck.
Unlock Deck
k this deck
5
There are 13,259 eligible voters in one town. In a sample of 833 eligible voters from this town, 394 say that they plan to vote in the next mayoral election. Based on this sample statistic, estimate the number of eligible voters in
This town who will vote in the next mayoral election.
A)6146
B)0.47
C)6988
D)6271
This town who will vote in the next mayoral election.
A)6146
B)0.47
C)6988
D)6271
Unlock Deck
Unlock for access to all 100 flashcards in this deck.
Unlock Deck
k this deck
6
Solve the problem. Round your answer to one decimal place unless otherwise indicated.
Ten apples of a particular variety are selected at random and weighed. The weights (in ounces)are as follows: Estimate the mean weight of all apples of this variety.
A)7.7 ounces
B)It is not possible to estimate the population mean from this sample data
C)8.0 ounces
D)7.8 ounces
Ten apples of a particular variety are selected at random and weighed. The weights (in ounces)are as follows:
Estimate the mean weight of all apples of this variety.A)7.7 ounces
B)It is not possible to estimate the population mean from this sample data
C)8.0 ounces
D)7.8 ounces
Unlock Deck
Unlock for access to all 100 flashcards in this deck.
Unlock Deck
k this deck
7
There are 2140 students in a school district. In a sample of 449 students from this school district, 169 have mathematics scores below grade level. Based on this sample statistic, estimate the number of students in this school district with mathematics scores at or above grade level.
A)1402
B)805
C)280
D)1335
A)1402
B)805
C)280
D)1335
Unlock Deck
Unlock for access to all 100 flashcards in this deck.
Unlock Deck
k this deck
8
Solve the problem. Round your answer to one decimal place unless otherwise indicated.
-A sample of nine students is selected from among the students taking a particular exam. The nine students were asked how much time they had spent studying for the exam and the responses (in hours)were as follows:
Estimate the mean study time of all students taking the exam.
A)13.4 hours
B)12.1 hours
C)It is not possible to estimate the population mean from this sample data
D)14 hours
Unlock Deck
Unlock for access to all 100 flashcards in this deck.
Unlock Deck
k this deck
9
There are 341 teachers at a college. In a sample of 110 teachers from this college, 72 have doctorates. Based on this sample statistic, estimate the number of teachers at this college with doctorates.
A)182
B)223
C)234
D)118
A)182
B)223
C)234
D)118
Unlock Deck
Unlock for access to all 100 flashcards in this deck.
Unlock Deck
k this deck
10
There are 328 teachers at a college. In a sample of 111 teachers from this college, 75 have doctorates. Based on this sample statistic, estimate the number of teachers at this college without doctorates.
A)0.32
B)36
C)106
D)222
A)0.32
B)36
C)106
D)222
Unlock Deck
Unlock for access to all 100 flashcards in this deck.
Unlock Deck
k this deck
11
Solve the problem. Round your answer to one decimal place, if necessary.
-The distribution of sample means for a group of test scores for samples of 100 scores is normal with a mean of 61.2 and a standard deviation of 1.7. Suppose you take a sample of 100 test scores and find that the mean is 59.3.
How many standard deviations is the sample mean from the mean of the distribution of sample means?
A)1.9 standard deviation(s)below the mean
B)1.1 standard deviation(s)below the mean
C)11.2 standard deviation(s)below the mean
D)1.1 standard deviation(s)above the mean
Unlock Deck
Unlock for access to all 100 flashcards in this deck.
Unlock Deck
k this deck
12
There are 13,417 eligible voters in one town. In a sample of 802 eligible voters from this town, 386 say that they plan to vote in the next mayoral election. Based on this sample statistic, estimate the number of eligible voters in this town who will not vote in the next mayoral election.
A)6458
B)0.52
C)416
D)6959
A)6458
B)0.52
C)416
D)6959
Unlock Deck
Unlock for access to all 100 flashcards in this deck.
Unlock Deck
k this deck
13
Solve the problem. Round your answer to one decimal place unless otherwise indicated.
-When 12 long-distance runners were randomly selected and tested, a mean resting heart rate of 70.0 beats per minute was obtained. Based on this sample statistic, what is the best estimate for the mean resting heart rate for all long-distance runners?
A)66.7 beats per minute
B)68.3 beats per minute
C)71.8 beats per minute
D)70.0 beats per minute
Unlock Deck
Unlock for access to all 100 flashcards in this deck.
Unlock Deck
k this deck
14
Solve the problem. Round your answer to one decimal place unless otherwise indicated.
-Physiologists often use the forced vital capacity as a way to assess a person's ability to move air in and out of their lungs. A researcher wishes to estimate the forced vital capacity of people suffering from asthma. When 15 asthmatics were randomly selected and tested for their forced vital capacity, a mean forced vital capacity was obtained of 4.4 liters. Based on this sample statistic, what is the best estimate of the mean forced vital capacity
For all asthmatics?
A)4.4 liters
B)4.6 liters
C)4.5 liters
D)4.3 liters
Unlock Deck
Unlock for access to all 100 flashcards in this deck.
Unlock Deck
k this deck
15
Eleven female college students are selected at random and asked their heights. The heights (in inches)are as follows: Estimate the mean height of all female students at this college.
A)65 inches
B)It is not possible to estimate the population mean from this sample data
C)64.5 inches
D)63.9 inches
A)65 inches
B)It is not possible to estimate the population mean from this sample data
C)64.5 inches
D)63.9 inches
Unlock Deck
Unlock for access to all 100 flashcards in this deck.
Unlock Deck
k this deck
16
There are 2221 students in a school district. In a sample of 452 students from this school district, 161 have mathematics scores below grade level. Based on this sample statistic, estimate the population proportion of students in this district with mathematics scores below grade level.
A)0.36
B)0.07
C)791
D)0.2
A)0.36
B)0.07
C)791
D)0.2
Unlock Deck
Unlock for access to all 100 flashcards in this deck.
Unlock Deck
k this deck
17
There are 13,427 eligible voters in one town. In a sample of 825 eligible voters from this town, the proportion who say that they plan to vote in the next mayoral election is 0.48 . Based on that sample statistic, what is the best estimate of the proportion for all eligible voters in the town?
A)6380
B)0.47
C)0.52
D)0.48
A)6380
B)0.47
C)0.52
D)0.48
Unlock Deck
Unlock for access to all 100 flashcards in this deck.
Unlock Deck
k this deck
18
Solve the problem. Round your answer to one decimal place unless otherwise indicated.
-A long-distance phone company wishes to estimate the mean duration of long-distance calls originating in california. A random sample of 15 long-distance calls originating in California yields the following call durations, in minutes.
Use the data to obtain an estimate of the mean call duration for all long-distance calls originating in California.
A)14.4 minutes
B)15.2 minutes
C)14.6 minutes
D)14.9 minutes
Unlock Deck
Unlock for access to all 100 flashcards in this deck.
Unlock Deck
k this deck
19
In a survey of high school students, 1100 students were randomly selected from California, and the proportion who spoke a second language in addition to English was 0.15. Based on that sample statistic, what is the best
Estimate of the proportion for all high school students in California?
A)165
B)0.85
C)0.5
D)0.15
Estimate of the proportion for all high school students in California?
A)165
B)0.85
C)0.5
D)0.15
Unlock Deck
Unlock for access to all 100 flashcards in this deck.
Unlock Deck
k this deck
20
There are 2030 students in a school district. In a sample of 483 students from this school district, 164 have mathematics scores below grade level. Based on this sample statistic, estimate the number of students in this school district with mathematics scores below grade level.
A)0.34
B)723
C)689
D)758
A)0.34
B)723
C)689
D)758
Unlock Deck
Unlock for access to all 100 flashcards in this deck.
Unlock Deck
k this deck
21
Solve the problem.
-Among a random sample of 150 employees of a particular company, the mean commute distance is 29.5 miles. This mean lies 2.2 standard deviation(s)below the mean of the sampling distribution. If a second sample of 150 employees is selected, what is the probability that for the second sample, the mean commute
Distance will be less than 29.5 miles?
A)0.0107
B)0.5
C)0.0139
D)0.9861
Unlock Deck
Unlock for access to all 100 flashcards in this deck.
Unlock Deck
k this deck
22
Find the population proportion or sample proportion as indicated. Round your answer to two decimal places, if
necessary.
-Of the 6713 students in one school district, 1578 cannot read up to grade level. Among a sample of 815 of the students from this school district, 210 cannot read up to grade level. Find the population proportion of students in this district who cannot read up to grade level.
A)1578
B)0.26
C)0.12
D)0.24
Unlock Deck
Unlock for access to all 100 flashcards in this deck.
Unlock Deck
k this deck
23
Solve the problem.
-Among a random sample of 150 employees of a particular company, the mean commute distance is 26.8 miles. This mean lies 2.7 standard deviation(s)below the mean of the sampling distribution. If a second sample of 150 employees is selected, what is the probability that for the second sample, the mean commute
Distance will be at least 26.8 miles?
A)0.0035
B)0.9965
C)0.5
D)0.0026
Unlock Deck
Unlock for access to all 100 flashcards in this deck.
Unlock Deck
k this deck
24
In one city, there are a total of 1698 5-year-old children of whom 559 live with one parent only. Among a sample of 603 of the 5-year-old children from this city, 229 live with one parent only. Find the sampleproportion of 5-year-old children who live with only one parent.
A)0.38
B)229
C)0.33
D)0.41
A)0.38
B)229
C)0.33
D)0.41
Unlock Deck
Unlock for access to all 100 flashcards in this deck.
Unlock Deck
k this deck
25
Find the population proportion or sample proportion as indicated. Round your answer to two decimal places, if
necessary.
-Of the 2393 students at a liberal arts college, 247 are fifth year students. Among a sample of 316 of the students from this college, 37 are fifth year students. Find the sample proportion of fifth year students.
A)0.13
B)0.12
C)0.10
D)37
necessary.
-Of the 2393 students at a liberal arts college, 247 are fifth year students. Among a sample of 316 of the students from this college, 37 are fifth year students. Find the sample proportion of fifth year students.
A)0.13
B)0.12
C)0.10
D)37
Unlock Deck
Unlock for access to all 100 flashcards in this deck.
Unlock Deck
k this deck
26
The distribution of sample means for scores on a test for samples of size 100 is normal with a mean of 61.7 and a standard deviation of 1.5. If a sample of 100 test scores is selected at random, what is the probability that the sample mean will be greater than 63.8?
A)0.9192
B)0.0668
C)0.0808
D)1.4
A)0.9192
B)0.0668
C)0.0808
D)1.4
Unlock Deck
Unlock for access to all 100 flashcards in this deck.
Unlock Deck
k this deck
27
Find the population proportion or sample proportion as indicated. Round your answer to two decimal places, if
necessary.
-Of the 9260 registered voters in one town, 4681 are women. Among a sample of 539 of the registered voters from this town, 265 are women. Find the sample proportion of registered voters who are women.
A)0.51
B)265
C)0.49
D)0.50
necessary.
-Of the 9260 registered voters in one town, 4681 are women. Among a sample of 539 of the registered voters from this town, 265 are women. Find the sample proportion of registered voters who are women.
A)0.51
B)265
C)0.49
D)0.50
Unlock Deck
Unlock for access to all 100 flashcards in this deck.
Unlock Deck
k this deck
28
Solve the problem. Round your answer to one decimal place, if necessary.
-The distribution of sample means for the ages of employees at a particular company for samples of 200 employees is normal with a mean of 40 and a standard deviation of 0.73. Suppose you take a random sample of 200 employees from the company and find that their mean age is 38.2. How many standard deviations is the sample mean from the mean of the distribution of sample means?
A)34.9 standard deviation(s)below the mean
B)2.5 standard deviation(s)below the mean
C)1.8 standard deviation(s)below the mean
D)2.5 standard deviation(s)above the mean
Unlock Deck
Unlock for access to all 100 flashcards in this deck.
Unlock Deck
k this deck
29
Find the population proportion or sample proportion as indicated. Round your answer to two decimal places, if
necessary.
-Of the 2281 students at a liberal arts college, 250 are fifth year students. Among a sample of 326 of the students from this college, 33 are fifth year students. Find the population proportion of fifth year students.
A)250
B)0.11
C)0.14
D)0.10
necessary.
-Of the 2281 students at a liberal arts college, 250 are fifth year students. Among a sample of 326 of the students from this college, 33 are fifth year students. Find the population proportion of fifth year students.
A)250
B)0.11
C)0.14
D)0.10
Unlock Deck
Unlock for access to all 100 flashcards in this deck.
Unlock Deck
k this deck
30
Solve the problem. Round your answer to one decimal place, if necessary.
-The distribution of sample means for monthly employee income at a particular company for samples of 70 employees is normal with a mean of $5587 and a standard deviation of $220. You take a random sample of 70 employees from the company and find that their mean monthly income is $5837. How many standard deviations is the sample mean from the mean of the sampling distribution?
A)1.1 standard deviation(s)above the mean
B)250 standard deviation(s)above the mean
C)1 standard deviation(s)above the mean
D)9.5 standard deviation(s)above the mean
Unlock Deck
Unlock for access to all 100 flashcards in this deck.
Unlock Deck
k this deck
31
Solve the problem.
-Among a random sample of 150 employees of a particular company, the mean commute distance is 25.4 miles. this mean lies 1.7 standard deviation(s)below the mean of the sampling distribution. In a second sample of 150 employees selected from the same company, the mean commute distance is 31.7 miles. This second sample mean lies 2 standard deviation(s)above the mean of the sampling distribution. If a third sample of 150 employees is selected, what is the probability that the sample mean will lie between 25.4 and 31.7?
A)0.9772
B)0.9326
C)0.0218
D)0.0446
Unlock Deck
Unlock for access to all 100 flashcards in this deck.
Unlock Deck
k this deck
32
The distribution of sample means for scores on a test for samples of size 100 is normal with a mean of 63.3 and a standard deviation of 1.5. If a sample of 100 test scores is selected at random, what is the probability that the sample mean will be less than 60.6?
A)0.9641
B)0.0668
C)1.8
D)0.0359
A)0.9641
B)0.0668
C)1.8
D)0.0359
Unlock Deck
Unlock for access to all 100 flashcards in this deck.
Unlock Deck
k this deck
33
Solve the problem.
-Among a random sample of 500 college students, the mean number of hours worked per week at non-college related jobs is 15.1. This mean lies 2.8 standard deviation(s)below the mean of the sampling distribution. If a second sample of 500 students is selected, what is the probability that for the second sample, the mean number oOf hours worked will be at least 15.1?
A)0.0026
B)0.9974
C)0.5
D)0.9965
Unlock Deck
Unlock for access to all 100 flashcards in this deck.
Unlock Deck
k this deck
34
Solve the problem.
-Among a random sample of 400 college students, the mean number of hours worked per week at non-college related jobs is 14.4. This mean lies 2.8 standard deviation(s)above the mean of the sampling distribution. If a second sample of 400 students is selected, what is the probability that for the second sample, the mean number of hours worked will be less than 14.4?
A)0.9974
B)0.0026
C)0.9965
D)0.5
Unlock Deck
Unlock for access to all 100 flashcards in this deck.
Unlock Deck
k this deck
35
Solve the problem.
-Among a random sample of 250 college students, the mean number of hours worked per week at non-college related jobs is 14.2. This mean lies 2 standard deviation(s)above the mean of the sampling distribution. If a second sample of 250 students is selected, what is the probability that for the second sample, the mean number
Of hours worked will be greater than 14.2?
A)0.5
B)0.0228
C)0.9772
D)0.0222
Unlock Deck
Unlock for access to all 100 flashcards in this deck.
Unlock Deck
k this deck
36
Find the population proportion or sample proportion as indicated. Round your answer to two decimal places, if
necessary.
-Of the 9238 registered voters in one town, 4694 are women. Among a sample of 540 of the registered voters from this town, 262 are women. Find the population proportion of registered voters who are women.
A)4694
B)0.50
C)0.49
D)0.51
necessary.
-Of the 9238 registered voters in one town, 4694 are women. Among a sample of 540 of the registered voters from this town, 262 are women. Find the population proportion of registered voters who are women.
A)4694
B)0.50
C)0.49
D)0.51
Unlock Deck
Unlock for access to all 100 flashcards in this deck.
Unlock Deck
k this deck
37
Solve the problem. Round your answer to one decimal place, if necessary.
-The distribution of sample means for monthly employee income at a particular company for samples of 70 employees is normal with a mean of $5921 and a standard deviation of $219. You take a random sample of 70 employees from the company and find that their mean monthly income is $5668. How many standard deviations is the sample mean from the mean of the distribution of sample means?
A)1.2 standard deviation(s)below the mean
B)1.2 standard deviation(s)above the mean
C)9.7 standard deviation(s)below the mean
D)253 standard deviation(s)above the mean
Unlock Deck
Unlock for access to all 100 flashcards in this deck.
Unlock Deck
k this deck
38
Find the population proportion or sample proportion as indicated. Round your answer to two decimal places, if
necessary.
-Of the 6660 students in one school district, 1590 cannot read up to grade level. Among a sample of 800 of the students from this school district, 198 cannot read up to grade level. Find the sample proportion of students who cannot read up to grade level.
A)0.24
B)0.12
C)198
D)0.25
necessary.
-Of the 6660 students in one school district, 1590 cannot read up to grade level. Among a sample of 800 of the students from this school district, 198 cannot read up to grade level. Find the sample proportion of students who cannot read up to grade level.
A)0.24
B)0.12
C)198
D)0.25
Unlock Deck
Unlock for access to all 100 flashcards in this deck.
Unlock Deck
k this deck
39
In one city, there are a total of 1783 5 year old children of whom 560 live with one parent only. Among a sample of 605 of the 5 year old children from this city, 229 live with one parent only. Find the population proportion of 5 year olds who live with only one parent.
A)0.31
B)0.38
C)0.34
D)560
A)0.31
B)0.38
C)0.34
D)560
Unlock Deck
Unlock for access to all 100 flashcards in this deck.
Unlock Deck
k this deck
40
Solve the problem. Round your answer to one decimal place, if necessary.
-The distribution of sample means for the ages of employees at a particular company for samples of 200 employees is normal with a mean of 39 and a standard deviation of 0.62. Suppose you take a random sample of 200 employees from the company and find that their mean age is 39.8. How many standard deviations is the sample mean from the mean of the sampling distribution?
A)1.3 standard deviation(s)above the mean
B)0.8 standard deviation(s)above the mean
C)18.2 standard deviation(s)above the mean
D)1.4 standard deviation(s)above the mean
Unlock Deck
Unlock for access to all 100 flashcards in this deck.
Unlock Deck
k this deck
41
A population mean is to be estimated from the sample described. Round your answer to one decimal place if necessary. Assume that all confidence intervals use a 95% confidence level.
-Sample size = 3025, sample mean = 244, sample standard deviation = 80 What is the margin of error?
A)2.9
B)0.1
C)1.5
D)8.9
-Sample size = 3025, sample mean = 244, sample standard deviation = 80 What is the margin of error?
A)2.9
B)0.1
C)1.5
D)8.9
Unlock Deck
Unlock for access to all 100 flashcards in this deck.
Unlock Deck
k this deck
42
A researcher wishes to estimate the mean amount of money spent per month on food by households in a certain neighborhood. She desires a margin of error of $12. Past studies suggest that a population standard deviation of $229 is reasonable. Estimate the minimum sample size needed to estimate the population mean with the stated accuracy.
A)728
B)17,480
C)38
D)1457
A)728
B)17,480
C)38
D)1457
Unlock Deck
Unlock for access to all 100 flashcards in this deck.
Unlock Deck
k this deck
43
Solve the problem.
-Suppose you know that the distribution of sample proportions of fifth grade students in a large school district who read below grade level in samples of 100 students is normal with a mean of 0.30 and a standard deviation of 0.05. You select a sample of 100 fifth grade students from this district and find that the proportion who read below grade level in the sample is 0.33. How many standard deviations is the sample proportion above or below the mean of the distribution of sampling proportions?
A)6.6 standard deviation(s)above the mean
B)0.6 standard deviation(s)above the mean
C)0.57 standard deviation(s)above the mean
D)0.03 standard deviation(s)above the mean
Unlock Deck
Unlock for access to all 100 flashcards in this deck.
Unlock Deck
k this deck
44
A population mean is to be estimated from the sample described. Round your answer to one decimal place if necessary. Assume that all confidence intervals use a 95% confidence level.
-Sample size = 256, sample mean = 45, sample standard deviation = 17 What is the margin of error?
A)1.1
B)0.1
C)5.6
D)2.1
-Sample size = 256, sample mean = 45, sample standard deviation = 17 What is the margin of error?
A)1.1
B)0.1
C)5.6
D)2.1
Unlock Deck
Unlock for access to all 100 flashcards in this deck.
Unlock Deck
k this deck
45
Unlock Deck
Unlock for access to all 100 flashcards in this deck.
Unlock Deck
k this deck
46
A researcher wishes to estimate the mean height of women aged between 60 and 65 in the U.S. She desires a margin of error of 0.1 inches. Past studies suggest that a population standard deviation of 3.3 inches is reasonable. Estimate the minimum sample size needed to estimate the population mean with the stated accuracy.
A)436
B)66
C)2178
D)4356
A)436
B)66
C)2178
D)4356
Unlock Deck
Unlock for access to all 100 flashcards in this deck.
Unlock Deck
k this deck
47
Unlock Deck
Unlock for access to all 100 flashcards in this deck.
Unlock Deck
k this deck
48
Find an estimate of the sample size needed to obtain the specified margin of error for the 95% confidence interval of a
population mean.
population mean.
Unlock Deck
Unlock for access to all 100 flashcards in this deck.
Unlock Deck
k this deck
49
Solve the problem.
-Suppose you know that the distribution of sample proportions of fifth grade students in a large school district who read below grade level in samples of 100 students is normal with a mean of 0.30 and a standard deviation of 0.12. You select a sample of 100 fifth grade students from this district and find that the proportion who read below grade level in the sample is 0.54. This sample proportion lies 2.0 standard deviations above the mean of the sampling distribution. What is the probability that a second sample would be selected with a proportion
Greater than 0.54 ?
A)0.0228
B)0.9772
C)0.0179
D)0.9821
Unlock Deck
Unlock for access to all 100 flashcards in this deck.
Unlock Deck
k this deck
50
The weights of five players on a football team are shown below.
Consider these five players to be a population. Construct a table which shows all of the possible samples of size two which can be selected without replacement. For each of the possible samples, list the players in the sample, their weights, and the sample mean of the weights. The first line of the table is shown below.
Use your table to find the mean of the sample means. Is this mean equal to the mean of the five given weights in the
population?
Unlock Deck
Unlock for access to all 100 flashcards in this deck.
Unlock Deck
k this deck
51
Solve the problem.
-Suppose you know that the distribution of sample proportions of fifth grade students in a large school district who read below grade level in samples of 100 students is normal with a mean of 0.30 and a standard deviation of 0.04. Suppose that you select a sample of 100 fifth grade students from this district and find that the proportion who read below grade level in the sample is 0.4. What is the probability that a second sample would be selected with a proportion less than 0.4 ?
A)0.0047
B)0.0062
C)0.9938
D)0.9953
Unlock Deck
Unlock for access to all 100 flashcards in this deck.
Unlock Deck
k this deck
52
Suppose that a researcher wants to consider the average income of the three largest states in the country. consider these three states to be the entire population from which samples will be selected with replacement.
The researcher finds the distribution of sample means for sample sizes n = 1, 2, and 3.
Then she finds the means of the distributions of sample means for n = 1, 2, and 3. Compare the means of the distributions of sample means to the population mean.
The researcher finds the distribution of sample means for sample sizes n = 1, 2, and 3.
Then she finds the means of the distributions of sample means for n = 1, 2, and 3. Compare the means of the distributions of sample means to the population mean.
Unlock Deck
Unlock for access to all 100 flashcards in this deck.
Unlock Deck
k this deck
53
The mean of the sample means is 267 pounds. Yes, both means equal 267 pounds.
-An employee at the local company is attending night school to get a better job. In the fall term, she took 4 courses, in the winter term she took 5 courses, and in the spring term she took 6 courses. Consider the values of 4, 5, and 6 to be a population. Assume that samples of size 2 are randomly selected with replacement from the population of number of courses. Find the mean of each of the 9 different samples. Is the mean of the sampling distribution equal to the mean of the population of the three listed values?
-An employee at the local company is attending night school to get a better job. In the fall term, she took 4 courses, in the winter term she took 5 courses, and in the spring term she took 6 courses. Consider the values of 4, 5, and 6 to be a population. Assume that samples of size 2 are randomly selected with replacement from the population of number of courses. Find the mean of each of the 9 different samples. Is the mean of the sampling distribution equal to the mean of the population of the three listed values?
Unlock Deck
Unlock for access to all 100 flashcards in this deck.
Unlock Deck
k this deck
54
Solve the problem.
-Suppose you know that the distribution of sample proportions of the residents of one town over 70 years old in samples of 110 residents is normal with a mean of 0.12 and a standard deviation of 0.02. You select a sample of 110 residents and find that the proportion of residents over 70 is 0.08. The standard score corresponding to this sample proportion is -2. What is the probability that a second sample would be selected with a proportion less
Than 0.08?
A)0.9821
B)0.0179
C)0.9772
D)0.0228
Unlock Deck
Unlock for access to all 100 flashcards in this deck.
Unlock Deck
k this deck
55
Find an estimate of the sample size needed to obtain the specified margin of error for the 95% confidence interval of a
population mean.
population mean.
Unlock Deck
Unlock for access to all 100 flashcards in this deck.
Unlock Deck
k this deck
56
Find an estimate of the sample size needed to obtain the specified margin of error for the 95% confidence interval of a
population mean.
population mean.
Unlock Deck
Unlock for access to all 100 flashcards in this deck.
Unlock Deck
k this deck
57
Solve the problem.
-Suppose you know that the distribution of sample proportions of the residents of one town over 70 years old in samples of 140 residents is normal with a mean of 0.12 and a standard deviation of 0.02. Suppose that you select a sample of 140 residents and find that the proportion of residents over 70 is 0.04. How many standard deviations is the sample proportion above or below the mean of the distribution of sampling proportions?
A)4
B)-0.08
C)-4
D)-0.67
Unlock Deck
Unlock for access to all 100 flashcards in this deck.
Unlock Deck
k this deck
58
Find an estimate of the sample size needed to obtain the specified margin of error for the 95% confidence interval of a
population mean.
population mean.
Unlock Deck
Unlock for access to all 100 flashcards in this deck.
Unlock Deck
k this deck
59
Unlock Deck
Unlock for access to all 100 flashcards in this deck.
Unlock Deck
k this deck
60
Solve the problem.
-Suppose you know that the distribution of sample proportions of the residents of one town over 70 years old in samples of 120 residents is normal with a mean of 0.12 and a standard deviation of 0.04. You select a sample of 120 residents and find that the proportion of residents over 70 is 0.02. What is the probability that a second sample would be selected with a proportion greater than 0.02?
A)0.0062
B)0.0047
C)0.9938
D)0.9953
Unlock Deck
Unlock for access to all 100 flashcards in this deck.
Unlock Deck
k this deck
61
A medical researcher wishes to estimate the mean systolic blood pressure of heart surgery patients the day following surgery. She desires a margin of error of 2.2 mmHg. Past studies suggest that a population standard deviation of 42 mmHg is reasonable. Estimate the minimum sample size needed to estimate the population mean with the stated accuracy.
A)1458
B)3207
C)729
D)38
A)1458
B)3207
C)729
D)38
Unlock Deck
Unlock for access to all 100 flashcards in this deck.
Unlock Deck
k this deck
62
A college teacher wishes to estimate the mean number of hours worked per week at non-college related jobs by full-time students at the college. He desires a margin of error of 1.3 hours. Past studies suggest that a population standard deviation of 13.6 hours is reasonable. Estimate the minimum sample size needed to estimate the population mean with the stated accuracy.
A)219
B)21
C)438
D)569
A)219
B)21
C)438
D)569
Unlock Deck
Unlock for access to all 100 flashcards in this deck.
Unlock Deck
k this deck
63
Unlock Deck
Unlock for access to all 100 flashcards in this deck.
Unlock Deck
k this deck
64
A poll of 1000 voters in one district showed that 62% of them would favor stricter gun control laws. Find the margin of error for the 95% confidence interval for this study.
A)0.0217
B)0.0307
C)0.001
D)0.0153
A)0.0217
B)0.0307
C)0.001
D)0.0153
Unlock Deck
Unlock for access to all 100 flashcards in this deck.
Unlock Deck
k this deck
65
A population proportion is to be estimated from the sample described. Approximate the margin of error for the 95% confidence interval. Round your answer to four decimal places, if necessary.
-Sample size , sample proportion
A)
B)
C)
D)
-Sample size , sample proportion
A)
B)
C)
D)
Unlock Deck
Unlock for access to all 100 flashcards in this deck.
Unlock Deck
k this deck
66
A researcher wishes to estimate the proportion of college students who cheat on exams. A poll of 550 college students showed that 22% of them had, or intended to, cheat on examinations. Find the margin of error for the 95% confidence interval.
A)0.0015
B)0.025
C)0.0353
D)0.0177
A)0.0015
B)0.025
C)0.0353
D)0.0177
Unlock Deck
Unlock for access to all 100 flashcards in this deck.
Unlock Deck
k this deck
67
Unlock Deck
Unlock for access to all 100 flashcards in this deck.
Unlock Deck
k this deck
68
Unlock Deck
Unlock for access to all 100 flashcards in this deck.
Unlock Deck
k this deck
69
Unlock Deck
Unlock for access to all 100 flashcards in this deck.
Unlock Deck
k this deck
70
Unlock Deck
Unlock for access to all 100 flashcards in this deck.
Unlock Deck
k this deck
71
A medical researcher wishes to estimate what proportion of babies born at a particular hospital are born by caesarean section. In a random sample of 64 births at the hospital, 26% were Caesarean sections. Find the margin of error for the 95% confidence interval.
A)0.1097
B)0.0137
C)0.0775
D)0.0548
A)0.1097
B)0.0137
C)0.0775
D)0.0548
Unlock Deck
Unlock for access to all 100 flashcards in this deck.
Unlock Deck
k this deck
72
Solve the problem. Round your answer to one decimal place, if necessary.
-A random sample of 30 long distance runners aged 20-25 was selected from a running club. The resting heart rates (in beats per minute)of the runners are shown below. Find the 95% confidence interval for the mea resting heart rate for the population of long distance runners aged 20-25.
A) beats per minute beats per minute
B) beats per minute beats per minute
C) beats per minute beats per minute
D) beats per minute beats per minute
Unlock Deck
Unlock for access to all 100 flashcards in this deck.
Unlock Deck
k this deck
73
Solve the problem. Round your answer to the nearest whole number unless indicated otherwise.
-A government survey conducted to estimate the mean price of houses in a metropolitan area is designed to have a margin of error of $10,000. Pilot studies suggest that the population standard deviation is $40,000. Estimate the minimum sample size needed to estimate the population mean with the stated accuracy.
A)4096
B)64
C)32
D)8
Unlock Deck
Unlock for access to all 100 flashcards in this deck.
Unlock Deck
k this deck
74
Unlock Deck
Unlock for access to all 100 flashcards in this deck.
Unlock Deck
k this deck
75
Solve the problem. Round your answer to the nearest whole number unless indicated otherwise.
-An economist wants to estimate mean annual income for recent college graduates majoring in statistics. how many such incomes must be found if he wants to be 95% confident that the sample mean is within $500 of the true population mean? Assume that a previous study has revealed that for such incomes
A)441
B)10,500
C)470
D)21
Unlock Deck
Unlock for access to all 100 flashcards in this deck.
Unlock Deck
k this deck
76
Solve the problem. Round your answer to one decimal place, if necessary.
-A random sample of 30 households was selected from a particular neighborhood. The number of cars for each household is shown below. Find the 95% confidence interval for the mean number of cars per household for the
Population of households in this neighborhood.
A) 1 car cars
B) cars cars
C) cars cars
D) cars cars
Unlock Deck
Unlock for access to all 100 flashcards in this deck.
Unlock Deck
k this deck
77
Solve the problem. Round your answer to one decimal place, if necessary.
-A random sample of 30 seventh grade students was selected from a particular school district. The students were asked how many siblings they had. The responses are given below. Find a 95% confidence interval for the mean number of siblings for the population of seventh grade students in this school district.
A) 1 sibling siblings
B) siblings siblings
C) siblings siblings
D) siblings siblings
Unlock Deck
Unlock for access to all 100 flashcards in this deck.
Unlock Deck
k this deck
78
The weights (in pounds)of a random sample of 32 new born babies, born at a particular hospital are given below. Find The 95% confidence interval for the mean weight of the population of new born babies born at this hospital.
A)
B)
C)
D)
A)
B)
C)
D)
Unlock Deck
Unlock for access to all 100 flashcards in this deck.
Unlock Deck
k this deck
79
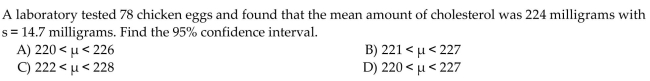
A laboratory tested 83 chicken eggs and found that the mean amount of cholesterol was 181 milligrams with S = 11.6 milligrams. Use a single value to estimate the mean amount of cholesterol for all chicken eggs.
A)178 milligrams
B)181 milligrams
C)83 milligrams
D)183 milligrams
A)178 milligrams
B)181 milligrams
C)83 milligrams
D)183 milligrams
Unlock Deck
Unlock for access to all 100 flashcards in this deck.
Unlock Deck
k this deck
80
A population proportion is to be estimated from the sample described. Approximate the margin of error for the 95% confidence interval. Round your answer to four decimal places, if necessary.
-Sample size , sample proportion
A)
B)
C)
D)
-Sample size , sample proportion
A)
B)
C)
D)
Unlock Deck
Unlock for access to all 100 flashcards in this deck.
Unlock Deck
k this deck
Unlock Deck
Unlock for access to all 100 flashcards in this deck.


