Deck 8: Hypothesis Testing for Population Proportions
Full screen (f)
Question
Question
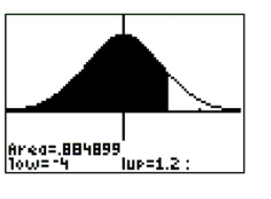
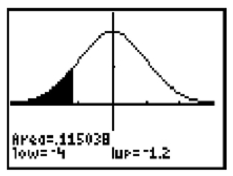
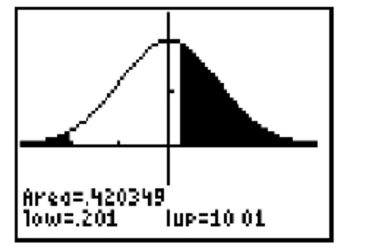
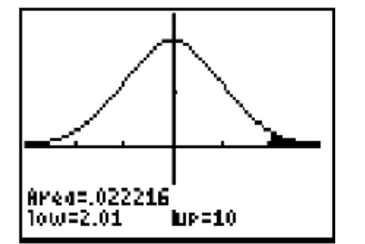
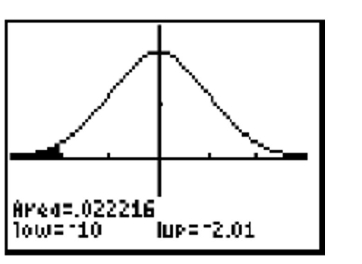
From the TI-84 graphing calculator screenshots below, choose the screenshot whose shaded area depicts a p-value for a left-tailed test.
A)
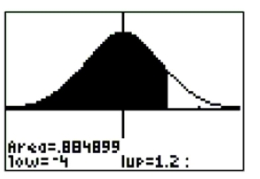
B)
C)
A)
B)
C)
Question
Question
Question
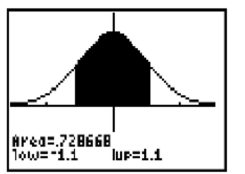
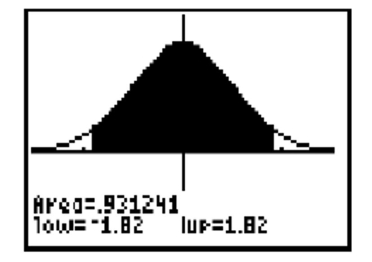
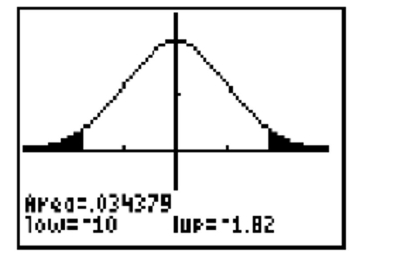
From the TI-84 graphing calculator screenshots below, choose the screenshot whose shaded area depicts a p-value for a two-tailed test.
A)
B)
C)
A)
B)
C)
Question
Question
Question
Question
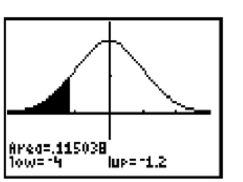
From the TI-84 graphing calculator screenshots below, choose the screenshot whose shaded area correctly depicts the following hypothesis test results: -value
A)
B)
C)
A)
B)
C)
Question
Question
Question
Question
Question
Question
Question
Use the following information to answer the question. A janitor at a large office building believes that his supply of light
bulbs has too many defective bulbs. The janitor's null hypothesis is that the supply of light bulbs has a defect rate of p (the light bulb manufacturer's stated defect rate). Suppose he does a hypothesis test with a significance level of 0.05.
Symbolically, the null and alternative hypothesis are as follows:
Suppose that the janitor tests 300 randomly selected light bulbs and finds that 27 bulbs are defective. What value of the test statistic should he report? Round to the nearest hundredth.
bulbs has too many defective bulbs. The janitor's null hypothesis is that the supply of light bulbs has a defect rate of p
(the light bulb manufacturer's stated defect rate). Suppose he does a hypothesis test with a significance level of 0.05.Symbolically, the null and alternative hypothesis are as follows:
Suppose that the janitor tests 300 randomly selected light bulbs and finds that 27 bulbs are defective. What value of the test statistic should he report? Round to the nearest hundredth.
Question
Question
Question
Question
Question
Question
Question
Question
Question
Question
Question
Question
Question
Question
Question
Which of the following is not a condition that must be checked before proceeding with a two-sample test? 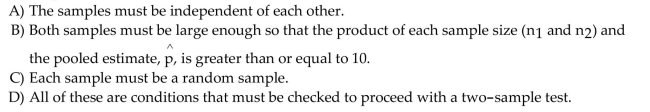
Question
Read the following problem description then choose the correct null and alternative hypothesis. A new drug is being tested to see whether it can reduce the rate of asthma attacks in children ages 5 to
14 with asthma ages. The rate of asthma attacks in the population of concern is 0.0744.
14 with asthma ages. The rate of asthma attacks in the population of concern is 0.0744.
Question
Question
Question
Question
Question
Question
Question
Question
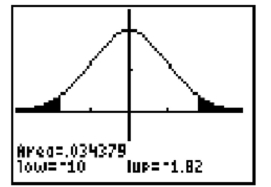
From the TI-84 graphing calculator screenshots below, choose the screenshot whose shaded area correctly depicts the following hypothesis test results: -value
A)
B)
C)
A)
B)
C)
Question
Question
Question
Question
Use the following information to answer the question. A health foods shop owner is wondering if his customer's daily vitamin supplement habits are in the same proportion as the general population of adults. The shop owner heard in a news report that 60% of all adults reported that they took a daily vitamin. The shop owner believes that his customers have a greater proportion of adults who take a daily vitamin, so he decides to conduct a hypothesis test using the following null and alternative hypothesis:
 e shop owner collected data from 50 randomly selected customers.
-Based on a 5% significance level, write a conclusion by interpreting the p-value. Be sure toclearly state the decision regarding the null hypothesis.
e shop owner collected data from 50 randomly selected customers. -Based on a 5% significance level, write a conclusion by interpreting the p-value. Be sure toclearly state the decision regarding the null hypothesis.
Question
Question
Use the following information to answer the question. A child psychologist believes that controlled physical outbursts of anger (like punching a pillow) may improve the mood of young boys with emotional impairment. He believes that the proportion of boys that would benefit from this treatment is greater than the proportion of girls. A random sample from each population receives counseling in the treatment and is asked about their mood after an episode (x is the number of test subjects that reported an improvement in mood). The results of the study are summarized in the table below. 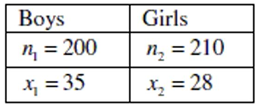
-Find the percentage of children that reported an improved mood from each group.Compare the percentages. Do the initial (untested) findings show what the psychologist expected?
-Find the percentage of children that reported an improved mood from each group.Compare the percentages. Do the initial (untested) findings show what the psychologist expected?
Question
Question
Question
Question
Question
Question
Question
Question
Question
Question
Question
Question
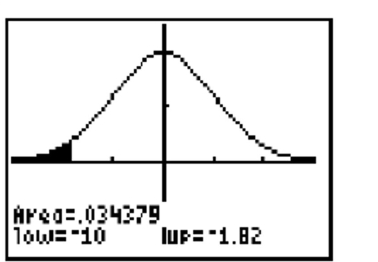
Shade the approximate area that would represent the p-value for the alternative hypothesis and z the p-value. Round to the nearest thousandth.
-
-
Question
Question
Shade the approximate area that would represent the p-value for the alternative hypothesis and z- the p-value. Round to the nearest thousandth.
-
-

Unlock Deck
Sign up to unlock the cards in this deck!
Unlock Deck
Unlock Deck
1/60
Play
Full screen (f)
Deck 8: Hypothesis Testing for Population Proportions
1
A researcher believes that the proportion of women that exercise with a friend is greater than the proportion men. He takes a random sample from each population and records the response to the question, "Have you exercised with a friend at least once in the last seven days?" The null hypothesis is : . Choose the correct alternative hypothesis.
A) :
B)
C)
D) :
A) :
B)
C)
D) :
2
From the TI-84 graphing calculator screenshots below, choose the screenshot whose shaded area depicts a p-value for a left-tailed test.
A)
B)
C)
A)
B)
C)
3
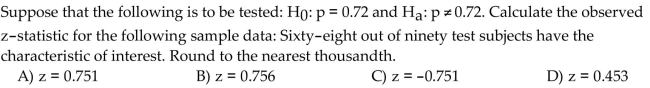
Suppose that the following is to be tested: and . Calculate the observed -statistic for the following sample data: Forty out of eighty test subjects have the characteristic of interest. Round to the nearest hundredth.
A)
B)
C)
D)
A)
B)
C)
D)
4
To continue the study into the drinking habits of adults, the researcher decides to collect data from adults working in "white collar" jobs to see whether their drinking habits are in the same proportion as the general public. The null hypothesis for this test is and the alternative hypothesis is . The researcher collected data from a random sample of 120 adults with "white collar" jobs of which 25 stated that they drank once a week or less in the last month. Assume that the conditions that must be met in order for us to use the distribution as the sampling distribution are satisfied. Find the values of the sample proportion, , the test statistic, and the p-value associated with the test statistic. Round all values to the nearest thousandth.
A) -value
B) , p-value
C) -value
D) , p-value
A) -value
B) , p-value
C) -value
D) , p-value
Unlock Deck
Unlock for access to all 60 flashcards in this deck.
Unlock Deck
k this deck
5
From the TI-84 graphing calculator screenshots below, choose the screenshot whose shaded area depicts a p-value for a two-tailed test.
A)
B)
C)
A)
B)
C)
Unlock Deck
Unlock for access to all 60 flashcards in this deck.
Unlock Deck
k this deck
6
A researcher conducts a hypothesis test on a population proportion. Her null and alternativehypothesis areH0: p=0.6 andHa: p<0.6. The test statistic and p-value for the test are z=-1.51andp-value=0.0655.For a significance level of?=0.05, choose the correct conclusion regardingthe null hypothesis.
A) There is sufficient evidence to conclude that the population proportion is significantly different from 0.6.
B) There is insufficient evidence to reject the null hypothesis that the population proportion is equal to 0.6.
C) None of these.
D) There is sufficient evidence to accept the null hypothesis that the population proportion is equal to 0.6.
Unlock Deck
Unlock for access to all 60 flashcards in this deck.
Unlock Deck
k this deck
7
Which statement best describes the significance level of a hypothesis test?
A) The probability of failing to reject the null hypothesis when the null hypothesis is not true.
B) The probability of rejecting the null hypothesis when the null hypothesis is true.
C) The probability of rejecting the null hypothesis when the null hypothesis is not true.
D) None of these
A) The probability of failing to reject the null hypothesis when the null hypothesis is not true.
B) The probability of rejecting the null hypothesis when the null hypothesis is true.
C) The probability of rejecting the null hypothesis when the null hypothesis is not true.
D) None of these
Unlock Deck
Unlock for access to all 60 flashcards in this deck.
Unlock Deck
k this deck
8
To continue the study into the drinking habits of adults, the researcher decides to collect data from adults working in "blue collar" jobs to see whether their drinking habits are in the same proportion as the general public. The null hypothesis for this test is and the alternative hypothesis is . The researcher collected data from a random sample of 90 adults with "blue collar" jobs of which 30 stated that they drank once a week or less in the last month. Assume that the conditions that must be met in order for us to use the distribution as the sampling distribution are satisfied. Find the values of the sample proportion, , the test statistic, and the p-value associated with the test statistic. Round all values to the nearest thousandth.
A) -value
B) , p-value
C) -value
D) -value
A) -value
B) , p-value
C) -value
D) -value
Unlock Deck
Unlock for access to all 60 flashcards in this deck.
Unlock Deck
k this deck
9
From the TI-84 graphing calculator screenshots below, choose the screenshot whose shaded area correctly depicts the following hypothesis test results: -value
A)
B)
C)
A)
B)
C)
Unlock Deck
Unlock for access to all 60 flashcards in this deck.
Unlock Deck
k this deck
10
Check that the conditions hold so that the sampling distribution of the z-statistic willapproximately follow the standard normal distribution. Are the conditions satisfied? If not, choosethe condition that is not satisfied.
A) No, the researcher did not collect a large enough sample.
B) No, the population of interest is not large enough to assume independence.
C) Yes, all the conditions are satisfied.
D) No, the researcher did not collect a random sample.
A) No, the researcher did not collect a large enough sample.
B) No, the population of interest is not large enough to assume independence.
C) Yes, all the conditions are satisfied.
D) No, the researcher did not collect a random sample.
Unlock Deck
Unlock for access to all 60 flashcards in this deck.
Unlock Deck
k this deck
11
Suppose a city official conducts a hypothesis test to test the claim that the majority of voterssupport a proposed tax to build sidewalks. Assume that all the conditions for proceeding with aone-sample test on proportions have been met. The calculated test statistic is approximately 1.40with an associated p-value of approximately 0.081. Choose the conclusion that provides the bestinterpretation for the p-value at a significance level of?=0.05
A) The p-value should be considered extreme; therefore the hypothesis test proves that the null hypothesis is true.
B) If the null hypothesis is true, then the probability of getting a test statistic that is as extreme or more extreme than the calculated test statistic of 1.40 is 0.081. This result is surprising and
Could not easily happen by chance.
C) If the null hypothesis is true, then the probability of getting a test statistic that is as extreme or more extreme than the calculated test statistic of 1.40 is 0.081. This result is not surprising and
Could easily happen by chance.
D) None of these.
Unlock Deck
Unlock for access to all 60 flashcards in this deck.
Unlock Deck
k this deck
12
Read the following then choose the appropriate test and name the population(s).
A researcher asks random samples of men and women whether they had purchased organicallygrown food in the last three months. He wants to determine whether the proportion of women whopurchase organically grown food is greater than the proportion of men who purchase organicallygrown food.
A)Two-proportion z-test; one population is all adults who buy organically grown food and theother population is all adults who do not buy organically grown food.
B)Two-proportion z-test; one population is all men and the other population is all women.
C)One-proportion z-test; the population is all men.
D)One-proportion z-test; the population is all women.
Unlock Deck
Unlock for access to all 60 flashcards in this deck.
Unlock Deck
k this deck
13
Which statement best describes the power of a hypothesis test?
A) The probability of rejecting the null hypothesis when the null hypothesis is true.
B) The probability of failing to reject the null hypothesis when the null hypothesis is not true.
C) The probability of rejecting the null hypothesis when the null hypothesis is not true.
D) None of these
A) The probability of rejecting the null hypothesis when the null hypothesis is true.
B) The probability of failing to reject the null hypothesis when the null hypothesis is not true.
C) The probability of rejecting the null hypothesis when the null hypothesis is not true.
D) None of these
Unlock Deck
Unlock for access to all 60 flashcards in this deck.
Unlock Deck
k this deck
14
Which of the following is not a condition that must be checked before proceeding with a two-sample test?
A) The samples must be independent of each other.
B) The observations within each sample must be independent of one another.
C) Each sample must be a random sample.
D) All of these are conditions that must be checked to proceed with a two-sample test.
A) The samples must be independent of each other.
B) The observations within each sample must be independent of one another.
C) Each sample must be a random sample.
D) All of these are conditions that must be checked to proceed with a two-sample test.
Unlock Deck
Unlock for access to all 60 flashcards in this deck.
Unlock Deck
k this deck
15
Which of the following is not one of the four steps of the hypothesis test?
A) State the level of significance.
B) Make a decision to reject or not reject the null hypothesis.
C) State the null and alternative hypothesis about the population parameter.
D) All of these are steps of the hypothesis test.
A) State the level of significance.
B) Make a decision to reject or not reject the null hypothesis.
C) State the null and alternative hypothesis about the population parameter.
D) All of these are steps of the hypothesis test.
Unlock Deck
Unlock for access to all 60 flashcards in this deck.
Unlock Deck
k this deck
16
Use the following information to answer the question. A janitor at a large office building believes that his supply of light
bulbs has too many defective bulbs. The janitor's null hypothesis is that the supply of light bulbs has a defect rate of p (the light bulb manufacturer's stated defect rate). Suppose he does a hypothesis test with a significance level of 0.05.
Symbolically, the null and alternative hypothesis are as follows:
Suppose that the janitor tests 300 randomly selected light bulbs and finds that 27 bulbs are defective. What value of the test statistic should he report? Round to the nearest hundredth.
bulbs has too many defective bulbs. The janitor's null hypothesis is that the supply of light bulbs has a defect rate of p
(the light bulb manufacturer's stated defect rate). Suppose he does a hypothesis test with a significance level of 0.05.Symbolically, the null and alternative hypothesis are as follows:
Suppose that the janitor tests 300 randomly selected light bulbs and finds that 27 bulbs are defective. What value of the test statistic should he report? Round to the nearest hundredth.
Unlock Deck
Unlock for access to all 60 flashcards in this deck.
Unlock Deck
k this deck
17
A polling agency is interested in testing whether the proportion of women who support a femalecandidate for office is less than the proportion of men. The null hypothesis is that there is nodifference in the proportions of men and women who support the female candidate. The alternativehypothesis is that the proportion of women who support the female candidate is less than theproportion of men. The test results in a p-value of 0.041. Which of the following is the bestinterpretation of the p-value?
A) The p-value is the probability that the majority of women will support the female candidate.
B) The p-value is the probability of getting a result that is as extreme as or more extreme than the one obtained, assuming that there is no difference in the proportions.
C) The p-value is the probability that the majority of men will support the female candidate.
D) The p-value is the probability of getting a result that is as extreme as or more extreme than the one obtained, assuming that the proportion of women who support the female candidate
Is less than the proportion of men.
Unlock Deck
Unlock for access to all 60 flashcards in this deck.
Unlock Deck
k this deck
18
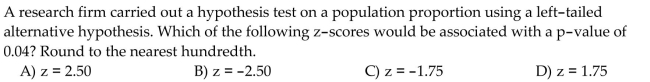
A research firm carried out a hypothesis test on a population proportion using a right-tailedalternative hypothesis. Which of the following z-scores would be associated with a p-value of0.04? Round to the nearest hundredth.
A) z = -1.75
B) z = 1.75
C) z = -2.50
D) z = 2.50
A) z = -1.75
B) z = 1.75
C) z = -2.50
D) z = 2.50
Unlock Deck
Unlock for access to all 60 flashcards in this deck.
Unlock Deck
k this deck
19
Choose the statement that best describes the significance level in the context of the hypothesis test.
A)The significance level of 0.05 is the defect rate we believe is the true defect rate.
B)The significance level of 0.05 is the probability of concluding that the defect rate is equal to0.07 when in fact it is greater than 0.07.
C)The significance level of 0.05 is the test statistic that we will use to compare the observedoutcome to the null hypothesis.
D)The significance level of 0.05 is the probability of concluding that the defect rate is higher than0.07 when in fact the defect rate is equal to 0.07.
Unlock Deck
Unlock for access to all 60 flashcards in this deck.
Unlock Deck
k this deck
20
The janitor calculates a p-value for the hypothesis test of approximately 0.087. Choose the correct interpretation for the p-value.
A) The p-value tells us that the probability of concluding that the defect rate is equal to 0.07, when in fact it is greater than 0.07, is approximately 0.087.
B) The p-value tells us that the true population rate of defective light bulbs is approximately 0.087.
C) The p-value tells us that if the defect rate is 0.07, then the probability that the janitor will have 27 defective light bulbs out of 300 is approximately 0.087. At a significance level of 0.05, this
Would not be an unusual outcome.
D) None of these
Unlock Deck
Unlock for access to all 60 flashcards in this deck.
Unlock Deck
k this deck
21
Which of the following is not one of the components of a hypothesis test?
A) State the level of significance.
B) Check the conditions that are required for future computations.
C) Make a decision to either accept the null hypothesis or accept the alternative hypothesis.
D) State the null and alternative hypothesis about the population parameter.
A) State the level of significance.
B) Check the conditions that are required for future computations.
C) Make a decision to either accept the null hypothesis or accept the alternative hypothesis.
D) State the null and alternative hypothesis about the population parameter.
Unlock Deck
Unlock for access to all 60 flashcards in this deck.
Unlock Deck
k this deck
22
Which of the following is not true about the alternative hypothesis?
A) It is assumed to be true based on the sample results.
B) Like the null hypothesis, it is always a statement about a population parameter.
C) It is sometimes called the research hypothesis.
D) It is usually a statement that the researcher hopes to demonstrate is true.
A) It is assumed to be true based on the sample results.
B) Like the null hypothesis, it is always a statement about a population parameter.
C) It is sometimes called the research hypothesis.
D) It is usually a statement that the researcher hopes to demonstrate is true.
Unlock Deck
Unlock for access to all 60 flashcards in this deck.
Unlock Deck
k this deck
23
Suppose the janitor tests 300 light bulbs and finds that 33 bulbs are defective. What value of the test statistic should he report? Round to the nearest hundredth.
A)
B)
C)
D)
A)
B)
C)
D)
Unlock Deck
Unlock for access to all 60 flashcards in this deck.
Unlock Deck
k this deck
24
Check that the conditions hold so that the sampling distribution of the z-statistic will approximately follow the standard normal distribution. Are the conditions satisfied? If not, choose
The condition that is not satisfied.
A) No, the researcher did not collect a large enough sample.
B) No, the researcher did not collect a random sample.
C) Yes, all the conditions are satisfied.
D) No, the population of interest is not large enough to assume independence.
The condition that is not satisfied.
A) No, the researcher did not collect a large enough sample.
B) No, the researcher did not collect a random sample.
C) Yes, all the conditions are satisfied.
D) No, the population of interest is not large enough to assume independence.
Unlock Deck
Unlock for access to all 60 flashcards in this deck.
Unlock Deck
k this deck
25
Read the following problem description then choose the correct null and alternative hypothesis. A new drug is being tested to see whether it can reduce the rate of food-related allergic reactions in Children ages 1 to 3 with food allergies. The rate of allergic reactions in the population of concern is 0.03.
A)
B)
C)
D)
A)
B)
C)
D)
Unlock Deck
Unlock for access to all 60 flashcards in this deck.
Unlock Deck
k this deck
26
A researcher believes that children who attend elementary school in a rural setting have lowerobesity rates then children who attend elementary school in an urban setting. The researchercollects a random sample from each population and records the proportion of children in eachsample who were clinically obese. The data is summarized in the table below. Assume the allconditions for proceeding with a two-sample test have been met.
Find the z-statistic (rounded to the nearest hundredth) and p-value (rounded to the nearestthousandth) for this hypothesis test. Using a 5% significance level, state the correct conclusionregarding the null hypothesisH0:prural=purban.
A)z=-1.95, p=0.026. There is not sufficient evidence to reject the null hypothesis.
B)z=-1.85, p=0.032. There is sufficient evidence to accept the null hypothesis.
C)z=-1.95, p=0.026. There is sufficient evidence to reject the null hypothesis.
D)z=1.95, p=0.026. There is sufficient evidence to prove that the population proportions are thesame.
Unlock Deck
Unlock for access to all 60 flashcards in this deck.
Unlock Deck
k this deck
27
A polling agency is interested in testing whether the proportion of women who support a femalecandidate for office is greater than the proportion of men. The null hypothesis is that there is nodifference in the proportion of men and women who support the female candidate. The alternativehypothesis is that the proportion of women who support the female candidate is greater than theproportion of men. The test results in a p-value of 0.112. Which of the following is the bestinterpretation of the p-value?
A) The p-value is the probability of getting a result that is as extreme as or more extreme than the one obtained, assuming that the proportion of women who support the female candidate
Is greater than the proportion of men.
B) The p-value is the probability that men will support the female candidate.
C) The p-value is the probability that women will support the female candidate.
D) The p-value is the probability of getting a result that is as extreme as or more extreme than the one obtained, assuming that there is no difference in the proportions.
Unlock Deck
Unlock for access to all 60 flashcards in this deck.
Unlock Deck
k this deck
28
Suppose a city official conducts a hypothesis test to test the claim that the majority of voters oppose a proposed school tax. Assume that all the conditions for proceeding with a one-sample test on Proportions have been met. The calculated test statistic is approximately 1.46 with an associated
P-value of approximately 0.072. Choose the conclusion that provides the best interpretation for the P-value at a significance level of
A)If the null hypothesis is true, then the probability of getting a test statistic that is as extreme ormore extreme than the calculated test statistic of 1.46 is 0.072. This resultissurprising andcould not easily happen by chance.
B)The p-value should be considered extreme; therefore the hypothesis test proves that the nullhypothesis is true.
C)If the null hypothesis is true, then the probability of getting a test statistic that is as extreme ormore extreme than the calculated test statistic of 1.46 is 0.072. This result isnotsurprising andcould easily happen by chance.
D)None of these.
Unlock Deck
Unlock for access to all 60 flashcards in this deck.
Unlock Deck
k this deck
29
A researcher believes that the reading habits of men and women are different. He takes a random sample from each population and records the response to the question, "Did you read at least one book last month?" The null hypothesis is : . Choose the correct alternative hypothesis.
A) :
B)
C) : pomen
D)
A) :
B)
C) : pomen
D)
Unlock Deck
Unlock for access to all 60 flashcards in this deck.
Unlock Deck
k this deck
30
The janitor calculates a p-value for the hypothesis test of approximately 0.113. Choose the correctinterpretation for the p-value.
A)The p-value tells us that the true population rate of defective light bulbs is approximately0.113.
B)The p-value tells us that the probability of concluding that the defect rate is equal to 0.09,when in
fact it is greater than 0.09, is approximately 0.113.
C)The p-value tells us that if the defect rate is 0.113, then the probability that the janitor willhave 33 defective light bulbs out of 300 is approximately 0.113. At a significance level of 0.01,this would not be an unusual outcome.
D)None of these
Unlock Deck
Unlock for access to all 60 flashcards in this deck.
Unlock Deck
k this deck
31
Which of the following is not a condition that must be checked before proceeding with a two-sample test?
Unlock Deck
Unlock for access to all 60 flashcards in this deck.
Unlock Deck
k this deck
32
Read the following problem description then choose the correct null and alternative hypothesis. A new drug is being tested to see whether it can reduce the rate of asthma attacks in children ages 5 to
14 with asthma ages. The rate of asthma attacks in the population of concern is 0.0744.
14 with asthma ages. The rate of asthma attacks in the population of concern is 0.0744.
Unlock Deck
Unlock for access to all 60 flashcards in this deck.
Unlock Deck
k this deck
33
Unlock Deck
Unlock for access to all 60 flashcards in this deck.
Unlock Deck
k this deck
34
A researcher believes that children who attend elementary school in a rural setting are more physically active then children who attend elementary school in an urban setting. The researcher collects a random sample from each population and records the proportion of children in each sample who reported participating in at least one hour of rigorous activity a day. The data is summarized in the table below. Assume the all conditions for proceeding with a two-sample test have been met.
Find the -statistic (rounded to the nearest hundredth) and p-value (rounded to the nearest thousandth) for this hypothesis test. Using a significance level, state the correct conclusion regarding the null hypothesis, : prural = purban.
A) . There is sufficient evidence to accept the null hypothesis.
B) . There is insufficient evidence to reject the null hypothesis.
C) . There is sufficient evidence to reject the null hypothesis.
D) . There is sufficient evidence to reject the null hypothesis.
Unlock Deck
Unlock for access to all 60 flashcards in this deck.
Unlock Deck
k this deck
35
A researcher conducts a hypothesis test on a population proportion. Her null and alternative hypothesis are and . The test statistic and -value for the test are and -value . For a significance level of , choose the correct conclusion regarding the null hypothesis.
A) There is not sufficient evidence to conclude that the population proportion is significantly different from 0.04.
B) There is sufficient evidence to conclude that the population proportion is significantly different from 0.04.
C) There is not sufficient evidence to reject the null hypothesis that the population proportion is equal to 0.04.
D) There is sufficient evidence to accept the null hypothesis that the population proportion is equal to 0.04.
Unlock Deck
Unlock for access to all 60 flashcards in this deck.
Unlock Deck
k this deck
36
Complete the statement by filling in the blanks. The null hypothesis is --------------------to be-------------------- and is only rejected when the observed outcome is shown to be--------------------
A) Likely; false; extremely likely
B) Known; true; the population parameter
C) Proven; true; impossible
D) Assumed; true; extremely unlikely
A) Likely; false; extremely likely
B) Known; true; the population parameter
C) Proven; true; impossible
D) Assumed; true; extremely unlikely
Unlock Deck
Unlock for access to all 60 flashcards in this deck.
Unlock Deck
k this deck
37
Unlock Deck
Unlock for access to all 60 flashcards in this deck.
Unlock Deck
k this deck
38
Read the following then choose the appropriate test and name the population(s).
A researcher asks a random sample of 200 men whether they had made an online purchase in the Last three months. He wants to determine whether the proportion of men who make online Purchases is less than 0.18.
A) One-proportion z-test; the population is all adults who make online purchases.
B) Two-proportion z-test; the population is the 200 men surveyed.
C) Two-proportion z-test; one population is all men who make online purchases and the other population is all men who do not make online purchases.
D) One-proportion z-test; the population is all men.
Unlock Deck
Unlock for access to all 60 flashcards in this deck.
Unlock Deck
k this deck
39
Choose the statement that best describes the significance level in the context of the hypothesis test.
A) The significance level of 0.01 is the defect rate we believe is the true defect rate.
B) The significance level of 0.01 is the probability of concluding that the defect rate is different than 0.09 when in fact the defect rate is equal to 0.09.
C) The significance level of 0.01 is the probability of concluding that the defect rate is equal to 0.09 when in fact it is greater than 0.09.
D) The significance level of 0.01 is the z-statistic that we will use to compare the observed outcome to the null hypothesis.
Unlock Deck
Unlock for access to all 60 flashcards in this deck.
Unlock Deck
k this deck
40
From the TI-84 graphing calculator screenshots below, choose the screenshot whose shaded area correctly depicts the following hypothesis test results: -value
A)
B)
C)
A)
B)
C)
Unlock Deck
Unlock for access to all 60 flashcards in this deck.
Unlock Deck
k this deck
41
List and briefly summarize the essential ingredients of the hypothesis test.
Unlock Deck
Unlock for access to all 60 flashcards in this deck.
Unlock Deck
k this deck
42
A researcher wishes to test the claim that the proportion of children with blue eyes in hisregion is different than one in six, the national rate of blue eyes in children. State andexplain the null and alternative hypothesis that should be used to test the claim.
Unlock Deck
Unlock for access to all 60 flashcards in this deck.
Unlock Deck
k this deck
43
Explain why failing to reject the null hypothesis does not prove that the null hypothesis istrue.
Unlock Deck
Unlock for access to all 60 flashcards in this deck.
Unlock Deck
k this deck
44
Use the following information to answer the question. A health foods shop owner is wondering if his customer's daily vitamin supplement habits are in the same proportion as the general population of adults. The shop owner heard in a news report that 60% of all adults reported that they took a daily vitamin. The shop owner believes that his customers have a greater proportion of adults who take a daily vitamin, so he decides to conduct a hypothesis test using the following null and alternative hypothesis:
e shop owner collected data from 50 randomly selected customers.
-Based on a 5% significance level, write a conclusion by interpreting the p-value. Be sure toclearly state the decision regarding the null hypothesis.
e shop owner collected data from 50 randomly selected customers. -Based on a 5% significance level, write a conclusion by interpreting the p-value. Be sure toclearly state the decision regarding the null hypothesis.
Unlock Deck
Unlock for access to all 60 flashcards in this deck.
Unlock Deck
k this deck
45
A sociologist believes that families that eat at least one meal a day together (without theinterference of any other media) will have better communication skills. The sociologistconducts a study to see if there is a difference in the proportion of meals that are eatentogether as a family for families living in a rural setting compared to families living in anurban setting. She collects a random sample from each population and records theproportion of test subjects that reported that they had eaten at least 3 meals per weektogether as a family. The data is summarized in the table below. Assume the all conditionsfor proceeding with a two-sample test have been met. Find the z test statistic (rounded to the nearest hundredth) and p-value (rounded to the nearest thousandth) for testing the hypothesis that the population proportions are different. At the 5% significance level, state the correct conclusion regarding the null hypothesis . Round all calculations to the nearest hundredth.
Unlock Deck
Unlock for access to all 60 flashcards in this deck.
Unlock Deck
k this deck
46
Use the following information to answer the question. A child psychologist believes that controlled physical outbursts of anger (like punching a pillow) may improve the mood of young boys with emotional impairment. He believes that the proportion of boys that would benefit from this treatment is greater than the proportion of girls. A random sample from each population receives counseling in the treatment and is asked about their mood after an episode (x is the number of test subjects that reported an improvement in mood). The results of the study are summarized in the table below.
-Find the percentage of children that reported an improved mood from each group.Compare the percentages. Do the initial (untested) findings show what the psychologist expected?
-Find the percentage of children that reported an improved mood from each group.Compare the percentages. Do the initial (untested) findings show what the psychologist expected?
Unlock Deck
Unlock for access to all 60 flashcards in this deck.
Unlock Deck
k this deck
47
When a two-sample test of proportions is conducted, there are two conditions ofindependence that must be checked. State the two conditions of independence. Be sure thatyour statement clearly states the difference between the two conditions.
Unlock Deck
Unlock for access to all 60 flashcards in this deck.
Unlock Deck
k this deck
48
Use the following information to answer the question. A health foods shop owner is wondering if his customer's dailyvitamin supplement habits are in the same proportion as the general population of adults. The shop owner heard in a newsreport that 60% of all adults reported that they took a daily vitamin. The shop owner believes that his customers have agreater proportion of adults who take a daily vitamin, so he decides to conduct a hypothesis test using the following null andalternative hypothesis:
H0:
p=0.6 and Ha:
p>0.6. The shop owner collected data from 50 randomly selected customers.
-To continue the study, the shop owner decides to collect data from 60 customers between the ages of 22 and 27 to see whether the proportion in this age group is different from the general population of adults. From this sample, 26 reported that they took a daily vitamin. The null hypothesis for this test is . and the alternative hypothesis is . Assume that the conditions that must be met in order for us to use the distribution as the sampling distribution are satisfied. Find the values of the sample proportion, , the observed test statistic, and the p-value associated with this observed value. Round all values to the nearest thousandth.
Unlock Deck
Unlock for access to all 60 flashcards in this deck.
Unlock Deck
k this deck
49
Two different students conduct a coin flipping experiment with a left-tailed alternative.The obtain the following test statistics:
Student Student Which of the test statistics has a smaller p-value and why?
Student Student Which of the test statistics has a smaller p-value and why?
Unlock Deck
Unlock for access to all 60 flashcards in this deck.
Unlock Deck
k this deck
50
Suppose the following is to be tested:
and . Calculate the observed test statistic for the following sample data:
and 25 test subjects have the characteristic of interest. Round to the nearest thousandth.
and . Calculate the observed test statistic for the following sample data:
and 25 test subjects have the characteristic of interest. Round to the nearest thousandth.
Unlock Deck
Unlock for access to all 60 flashcards in this deck.
Unlock Deck
k this deck
51
Suppose the store manager tests 150 pencils and finds that 9 are defective. Calculate the z test statistic. Round to the nearest hundredth.
Unlock Deck
Unlock for access to all 60 flashcards in this deck.
Unlock Deck
k this deck
52
The worker at a carnival game claims that he can communicate with a small magic rockand to prove it he tells you to hide it in your hand behind your back and he will identifythe hand holding the rock. Being a wise student of statistics, you decide to stand back andobserve the outcome of the next ten games before deciding whether to pay your threedollars to play the game. You have just conducted an informal hypothesis test. State thenull and alternative hypothesis.
Unlock Deck
Unlock for access to all 60 flashcards in this deck.
Unlock Deck
k this deck
53
Use the following information to answer the question. A health foods shop owner is wondering if his customer's dailyvitamin supplement habits are in the same proportion as the general population of adults. The shop owner heard in a newsreport that 60% of all adults reported that they took a daily vitamin. The shop owner believes that his customers have agreater proportion of adults who take a daily vitamin, so he decides to conduct a hypothesis test using the following null andalternative hypothesis:
H0:
p=0.6 andHa:
p>0.6. The shop owner collected data from 50 randomly selected customers.
-List and verify that the conditions hold so that the sampling distribution of the z test statistic will approximately follow the standard normal distribution.
H0:
p=0.6 andHa:
p>0.6. The shop owner collected data from 50 randomly selected customers.
-List and verify that the conditions hold so that the sampling distribution of the z test statistic will approximately follow the standard normal distribution.
Unlock Deck
Unlock for access to all 60 flashcards in this deck.
Unlock Deck
k this deck
54
Write a statement describing the meaning of the level of significance in the context of the hypothesis test.
Unlock Deck
Unlock for access to all 60 flashcards in this deck.
Unlock Deck
k this deck
55
A sociologist believes that the proportion of single men who attend church on a regularbasis is less than the proportion of single women. She takes a random sample from eachpopulation and records the proportion from each that reported that they attended churchon a regular basis. The null hypothesis is . State the correct alternative hypothesis with a sentence and symbolically.
Unlock Deck
Unlock for access to all 60 flashcards in this deck.
Unlock Deck
k this deck
56
For the following description, state whether a oneproportion z-test or a two-proportionz-test would be appropriate, and name the population. A researcher asks people who are 20-29 years old and senior citizens (people over 65)whether they support a new tax on income. He wants to determine whether theproportions that support the tax differ for these age groups.
Unlock Deck
Unlock for access to all 60 flashcards in this deck.
Unlock Deck
k this deck
57
Use the following information to answer the question. A manager at a large office supply store believes that her supply of pencils has a defect rate that is higher than the defect rate stated by the manufacturer. The manager's null hypothesis is that the supply of pencils has a defect rate of (the pencil manufacturer's stated defect rate). Suppose we do a test with a significance level of . Symbolically, the null and alternative hypothesis are as follows:
and
-The store manager calculates a p-value for the hypothesis test of 0.0030. Write a statementexplaining what the p-value means and how it should be interpreted.
and
-The store manager calculates a p-value for the hypothesis test of 0.0030. Write a statementexplaining what the p-value means and how it should be interpreted.
Unlock Deck
Unlock for access to all 60 flashcards in this deck.
Unlock Deck
k this deck
58
Shade the approximate area that would represent the p-value for the alternative hypothesis and z the p-value. Round to the nearest thousandth.
-
-
Unlock Deck
Unlock for access to all 60 flashcards in this deck.
Unlock Deck
k this deck
59
Assuming the conditions for a two proportion z-test hold, state the alternative hypothesisthen find the observed test statistic and p-value. State your decision regarding the nullhypothesis,H0:
p1=p2 . How do the test results compare to the expectations of the psychologist?
Round to the nearest hundredth.
p1=p2 . How do the test results compare to the expectations of the psychologist?
Round to the nearest hundredth.
Unlock Deck
Unlock for access to all 60 flashcards in this deck.
Unlock Deck
k this deck
60
Shade the approximate area that would represent the p-value for the alternative hypothesis and z- the p-value. Round to the nearest thousandth.
-
-
Unlock Deck
Unlock for access to all 60 flashcards in this deck.
Unlock Deck
k this deck
Unlock Deck
Unlock for access to all 60 flashcards in this deck.


