Deck 13: Inference Without Normality
Full screen (f)
Question
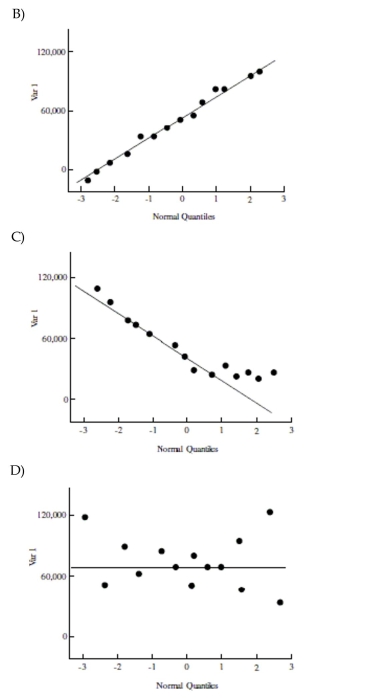
Which of the following QQ plots most closely depicts data from a normally distributed population? 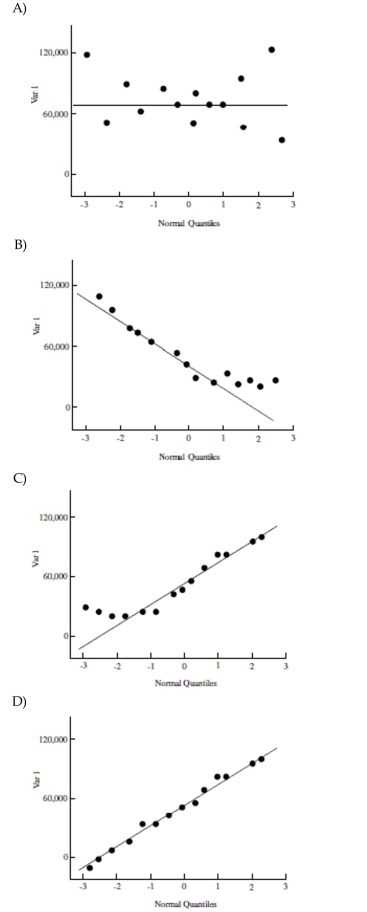
Question
Use the following information to answer the question. Math self-efficacy can be defined as one's belief in his or her own
ability to perform mathematical tasks. A college math professor wishes to find out if her students' math self-efficacy matches
reality. To do this she gives a math quiz then asks her students to rate their level of confidence in how well they did on the
quiz. She plans to test whether those who had little confidence that they did well on the quiz actually performed worse than
those who had a high level of confidence that they did well on the quiz. Shown below is the approximate sampling
distribution of the difference in mean quiz scores. The table below shows the summary statistics for the two groups. Assume
that all conditions for a randomization test have been satisfied.
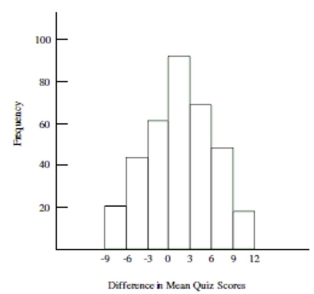
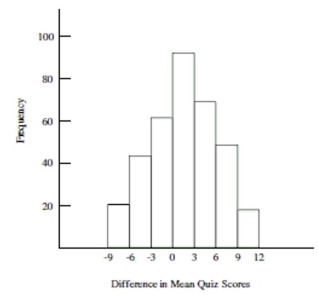
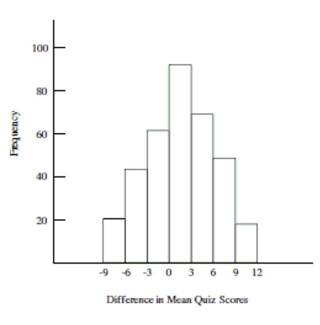
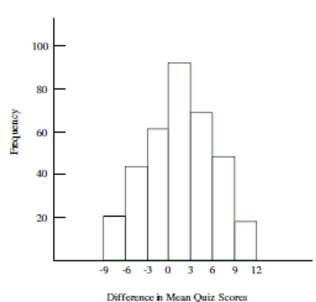
-Use the histogram to roughly estimate the p-value. Choose the answer that most closely approximates the p-value. (Approximations have been made to the nearest hundredth.)
A)
B)
C)
D) None of these
ability to perform mathematical tasks. A college math professor wishes to find out if her students' math self-efficacy matches
reality. To do this she gives a math quiz then asks her students to rate their level of confidence in how well they did on the
quiz. She plans to test whether those who had little confidence that they did well on the quiz actually performed worse than
those who had a high level of confidence that they did well on the quiz. Shown below is the approximate sampling
distribution of the difference in mean quiz scores. The table below shows the summary statistics for the two groups. Assume
that all conditions for a randomization test have been satisfied.
-Use the histogram to roughly estimate the p-value. Choose the answer that most closely approximates the p-value. (Approximations have been made to the nearest hundredth.)
A)
B)
C)
D) None of these
Question
Question
Question
Question
State the null and alternative hypothesis and also the value of the test statistic for the professor's randomization test. 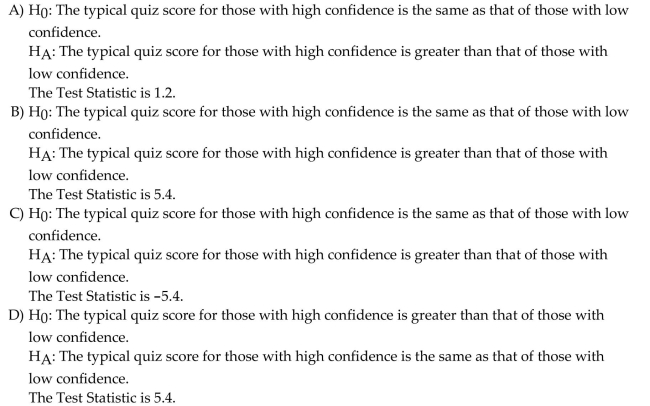
Question
Question
Which of the following QQ plots most closely depicts data from a skewed population? 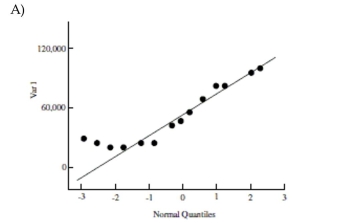
Question
Question
Question
Question
Choose the correct null and alternative hypothesis to test the claim that adults between the ages of 24 and 34 and adults between the ages of 35 and 45 watch different amounts of televised sporting
Events.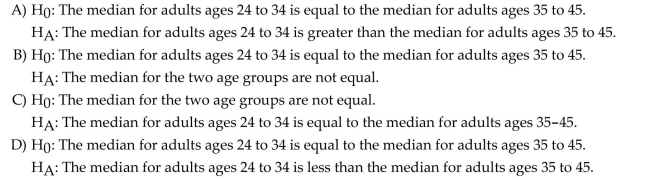
Events.
Question
Question
Question
Question
Use the following information to answer the question. Math self-efficacy can be defined as one's belief in his or her own
ability to perform mathematical tasks. A college math professor wishes to find out if her female students' math self-efficacy
matches reality. To do this she gives a math quiz to the female students then asks them to rate their level of confidence in
how well they did on the quiz. She plans to test whether those who had little confidence that they did well on the quiz
actually performed worse than those who had a high level of confidence that they did well on the quiz. Shown below is the
approximate sampling distribution of the difference in mean quiz scores. The table below shows the summary statistics for
the two groups. Assume that all conditions for a randomization test have been satisfied.
-Carry out the randomization test. What is the professor's conclusion? Are differences in mean quiz scores due to chance?
A) Fail to reject . The professor should conclude that there is no difference in mean quiz scores for those with high confidence and those with low confidence. The student's self-efficacy does not match reality.
B) Reject . The professor should conclude that there is no difference in mean quiz scores for those with high confidence and those with low confidence. The student's self-efficacy does not match reality.
C) Fail to reject . The professor should conclude that typical quiz scores for those with high confidence is less than that of those with low confidence. The student's self-efficacy matches reality.
D) Reject . The professor should conclude that typical quiz scores for those with high confidence is greater than that of those with low confidence. The student's self-efficacy matches reality.
Question
Question
Question
Question
Question
Question
Question
Question
Question
Question
Question
Question
Question
Use the following information to answer the question. Math self-efficacy can be defined as one's belief in his or her own
ability to perform mathematical tasks. A college math professor wishes to find out if her female students' math self-efficacy
matches reality. To do this she gives a math quiz to the female students then asks them to rate their level of confidence in
how well they did on the quiz. She plans to test whether those who had little confidence that they did well on the quiz
actually performed worse than those who had a high level of confidence that they did well on the quiz. Shown below is the
approximate sampling distribution of the difference in mean quiz scores. The table below shows the summary statistics for
the two groups. Assume that all conditions for a randomization test have been satisfied.
-State the null and alternative hypothesis and also the value of the test statistic for the professor's randomization test.
A) : The typical quiz score for those with high confidence is the same as that of those with low confidence.
: The typical quiz score for those with high confidence is greater than that of those with low confidence.
The Test Statistic is
B) : The typical quiz score for those with high confidence is the same as that of those with low confidence.
: The typical quiz score for those with high confidence is greater than that of those with low confidence.
The Test Statistic is .
C) : The typical quiz score for those with high confidence is the same as that of those with low confidence.
: The typical quiz score for those with high confidence is greater than that of those with low confidence.
The Test Statistic is .
D) : The typical quiz score for those with high confidence is greater than that of those with low confidence.
: The typical quiz score for those with high confidence is the same as that of those with low confidence.
The Test Statistic is .
Question
Question
Question
Question
Use the histogram to roughly estimate the p-value. Choose the answer that most closely approximates the p-value. (Approximations have been made to the nearest hundredth.) 
Question
Question
Question
Question
Use the following information to answer the question. Math self-efficacy can be defined as one's belief in his or her own
ability to perform mathematical tasks. A college math professor wishes to find out if her students' math self-efficacy matches
reality. To do this she gives a math quiz then asks her students to rate their level of confidence in how well they did on the
quiz. She plans to test whether those who had little confidence that they did well on the quiz actually performed worse than
those who had a high level of confidence that they did well on the quiz. Shown below is the approximate sampling
distribution of the difference in mean quiz scores. The table below shows the summary statistics for the two groups. Assume
that all conditions for a randomization test have been satisfied.
-Carry out the randomization test. What is the professor's conclusion? Are differences in mean quiz scores due to chance?
A) Reject . The professor should conclude that typical quiz scores for those with high confidence is greater than that of those with low confidence. The student's self-efficacy matches reality.
B) Fail to reject . The professor should conclude that typical quiz scores for those with high confidence is greater than that of those with low confidence. The student's self-efficacy matches reality.
C) Fail to reject . The professor should conclude that there is no difference in mean quiz scores for those with high confidence and those with low confidence. The student's self-efficacy does not match reality.
D) Reject . The professor should conclude that there is no difference in mean quiz scores for those with high confidence and those with low confidence. The student's self-efficacy does not match reality.
Question
Question
Question
Question
Use the following information to answer the question. Can dogs lower anxiety in math class?
Fifty subjects who reported anxiety about attending math class were measured for stress at the beginning of a math class then spent 15 minutes interacting with a dog followed by a forty-five minute math lecture. Each subject was then measured for stress at the end of the lecture. The hypothesis test results for the sign test are summarized below. Assume that all conditions for testing have been met:
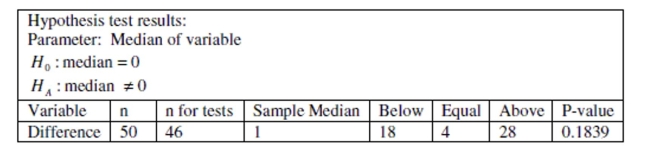
-Calculate the value of the test statistic and state the value of the p-value.
Fifty subjects who reported anxiety about attending math class were measured for stress at the beginning of a math class then spent 15 minutes interacting with a dog followed by a forty-five minute math lecture. Each subject was then measured for stress at the end of the lecture. The hypothesis test results for the sign test are summarized below. Assume that all conditions for testing have been met:
-Calculate the value of the test statistic and state the value of the p-value.
Question
Question
Question
Question
Use the following information to answer the question. Can dogs lower anxiety in math class?
Fifty subjects who reported anxiety about attending math class were measured for stress at the beginning of a math class then spent 15 minutes interacting with a dog followed by a forty-five minute math lecture. Each subject was then measured for stress at the end of the lecture. The hypothesis test results for the sign test are summarized below. Assume that all conditions for testing have been met:
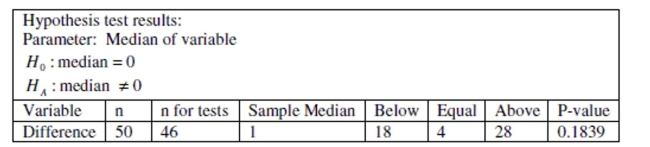
-Explain how the binomial model is used to calculate the p-value.
Fifty subjects who reported anxiety about attending math class were measured for stress at the beginning of a math class then spent 15 minutes interacting with a dog followed by a forty-five minute math lecture. Each subject was then measured for stress at the end of the lecture. The hypothesis test results for the sign test are summarized below. Assume that all conditions for testing have been met:
-Explain how the binomial model is used to calculate the p-value.
Question
Use the following information to answer the question. Suppose the Nielson Organization conducted a survey to find out how many minutes of crime dramas that people watched in one week. Assume that all conditions for the Mann-Whitney test have been met. Use the following test output to answer the question. 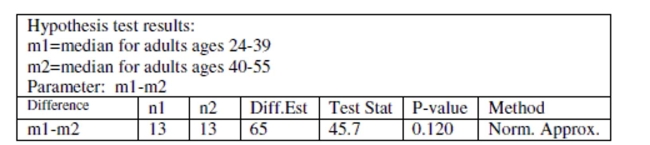
-Using a significance level of 5%, state the correct decision regarding the null hypothesis and write a sentence which summarizes the conclusion and addresses the claim.
-Using a significance level of 5%, state the correct decision regarding the null hypothesis and write a sentence which summarizes the conclusion and addresses the claim.
Question
Use the following information to answer the question. Suppose the manager of a large appliance and electronics store wants to estimate the amount spent by customers during the holiday season. He took a random sample of customers and recorded the amount they spent. A histogram of the data shows that the data is strongly left-skewed. The figures below show the confidence intervals for the mean amount spent using (A) raw (untransformed) data, and (B) log-transformed data, which showed a more normally distributed data set. 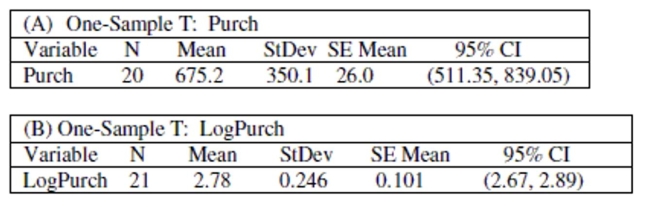
-Which interval should the manager report to the store owner about the typical amount of money spent during the holiday season?
Explain.
-Which interval should the manager report to the store owner about the typical amount of money spent during the holiday season?
Explain.
Question
Question
Question
Use the following information to answer the question. Math self-efficacy can be defined as one's belief in his or her own ability to perform mathematical tasks. A college math professor wishes to find out if her male students' math self-efficacy matches reality. To do this she gives a math quiz to the male students then asks them to rate their level of confidence in how well they did on the quiz. She plans to test whether those who had little confidence that they did well on the quiz actually performed worse than those who had a high level of confidence that they did well on the quiz. Shown below is the approximate sampling distribution of the difference in mean quiz scores. The table below shows the summary statistics for the two groups. Assume that all conditions for a randomization test have been satisfied. 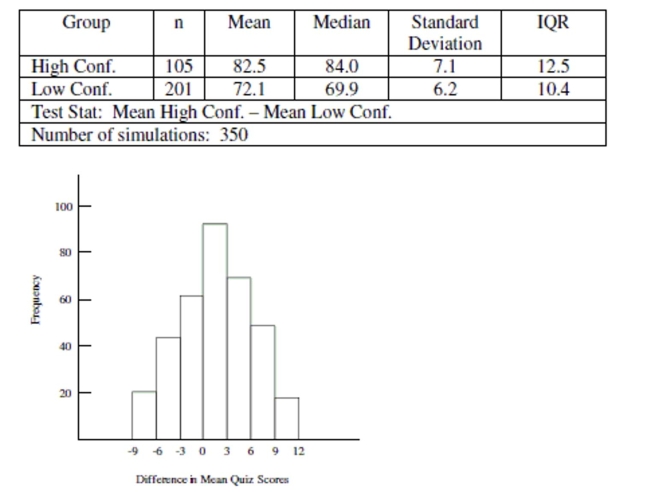
-Complete the randomization test by stating the proper decision regarding the null hypothesis and the professor's conclusion. Are differences in mean quiz scores due to chance?
-Complete the randomization test by stating the proper decision regarding the null hypothesis and the professor's conclusion. Are differences in mean quiz scores due to chance?
Question
Question
Question
Refer to the following two histograms and QQ plots of the same data to answer the question. 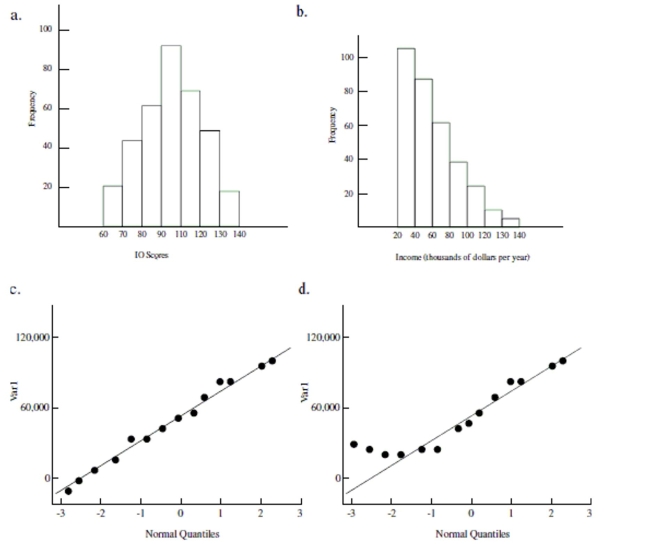
-For which sample might a log transform be useful?
Explain. (There are no zeros or negative values in either data set.)
-For which sample might a log transform be useful?
Explain. (There are no zeros or negative values in either data set.)
Question
Use the following information to answer the question. Suppose the manager of a large appliance and electronics store wants to estimate the amount spent by customers during the holiday season. He took a random sample of customers and recorded the amount they spent. A histogram of the data shows that the data is strongly left-skewed. The figures below show the confidence intervals for the mean amount spent using (A) raw (untransformed) data, and (B) log-transformed data, which showed a more normally distributed data set. 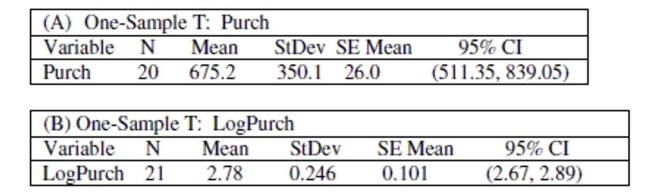
-Calculate the width of both intervals (note that you will need to convert the log-transformed interval back into dollars) and state which interval is narrower?
-Calculate the width of both intervals (note that you will need to convert the log-transformed interval back into dollars) and state which interval is narrower?
Question
Refer to the following two histograms and QQ plots of the same data to answer the question. 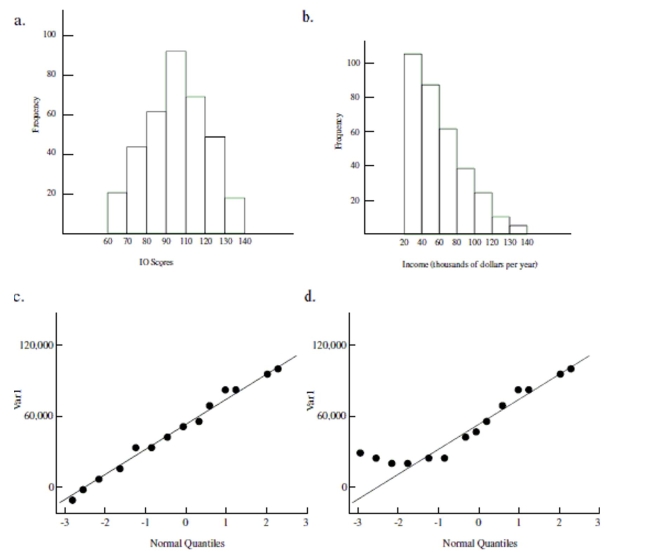
-Match the histogram with the corresponding QQ plot.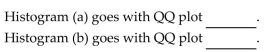
-Match the histogram with the corresponding QQ plot.
Question
Question
Use the following information to answer the question. Can dogs lower anxiety in math class?
Fifty subjects who reported anxiety about attending math class were measured for stress at the beginning of a math class then spent 15 minutes interacting with a dog followed by a forty-five minute math lecture. Each subject was then measured for stress at the end of the lecture. The hypothesis test results for the sign test are summarized below. Assume that all conditions for testing have been met:
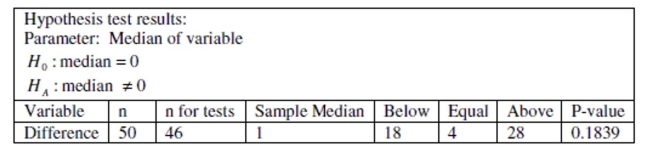
-Using a significance level of 5%, state the correct decision regarding the null hypothesis and write a sentence which summarizes the conclusion and addresses the claim.
Fifty subjects who reported anxiety about attending math class were measured for stress at the beginning of a math class then spent 15 minutes interacting with a dog followed by a forty-five minute math lecture. Each subject was then measured for stress at the end of the lecture. The hypothesis test results for the sign test are summarized below. Assume that all conditions for testing have been met:
-Using a significance level of 5%, state the correct decision regarding the null hypothesis and write a sentence which summarizes the conclusion and addresses the claim.
Question
Use the following information to answer the question. Math self-efficacy can be defined as one's belief in his or her own ability to perform mathematical tasks. A college math professor wishes to find out if her male students' math self-efficacy matches reality. To do this she gives a math quiz to the male students then asks them to rate their level of confidence in how well they did on the quiz. She plans to test whether those who had little confidence that they did well on the quiz actually performed worse than those who had a high level of confidence that they did well on the quiz. Shown below is the approximate sampling distribution of the difference in mean quiz scores. The table below shows the summary statistics for the two groups. Assume that all conditions for a randomization test have been satisfied. 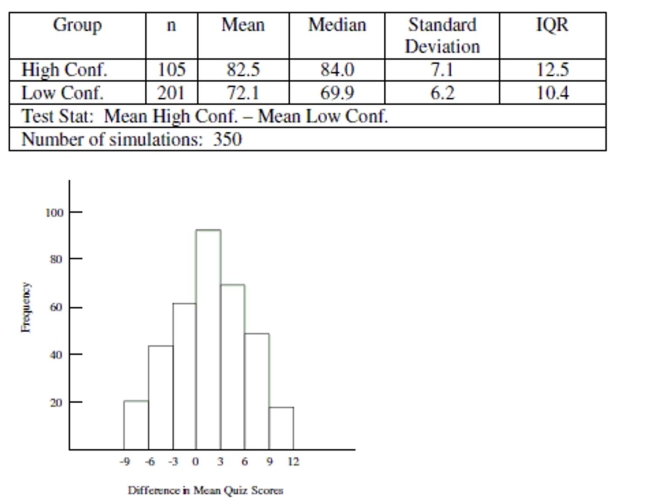
-State the null and alternative hypothesis and also the value of the test statistic for the professor's randomization test.
-State the null and alternative hypothesis and also the value of the test statistic for the professor's randomization test.
Question
Use the following information to answer the question. Math self-efficacy can be defined as one's belief in his or her own ability to perform mathematical tasks. A college math professor wishes to find out if her male students' math self-efficacy matches reality. To do this she gives a math quiz to the male students then asks them to rate their level of confidence in how well they did on the quiz. She plans to test whether those who had little confidence that they did well on the quiz actually performed worse than those who had a high level of confidence that they did well on the quiz. Shown below is the approximate sampling distribution of the difference in mean quiz scores. The table below shows the summary statistics for the two groups. Assume that all conditions for a randomization test have been satisfied. 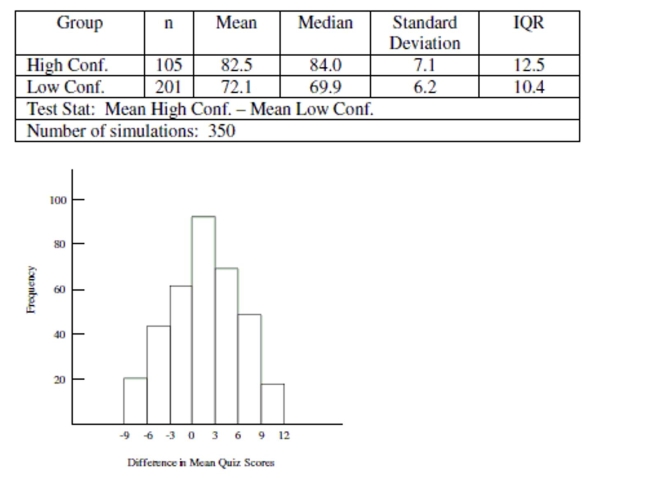
-Explain how you would use the histogram to get an approximate p-value and state your p-value estimation.
-Explain how you would use the histogram to get an approximate p-value and state your p-value estimation.
Question
Use the following information to answer the question. Suppose the Nielson Organization conducted a survey to find out how many minutes of crime dramas that people watched in one week. Assume that all conditions for the Mann been met. Use the following test output to answer the question. 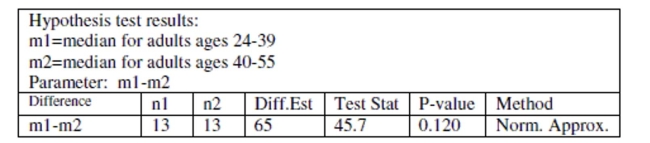
-State the null and alternative hypothesis to test the claim that adults between the ages of 24 and 39 and adults between the ages of 40 and 55 watch different amounts of crime dramas on television.
-State the null and alternative hypothesis to test the claim that adults between the ages of 24 and 39 and adults between the ages of 40 and 55 watch different amounts of crime dramas on television.

Unlock Deck
Sign up to unlock the cards in this deck!
Unlock Deck
Unlock Deck
1/60
Play
Full screen (f)
Deck 13: Inference Without Normality
1
Which of the following QQ plots most closely depicts data from a normally distributed population?
D
2
Use the following information to answer the question. Math self-efficacy can be defined as one's belief in his or her own
ability to perform mathematical tasks. A college math professor wishes to find out if her students' math self-efficacy matches
reality. To do this she gives a math quiz then asks her students to rate their level of confidence in how well they did on the
quiz. She plans to test whether those who had little confidence that they did well on the quiz actually performed worse than
those who had a high level of confidence that they did well on the quiz. Shown below is the approximate sampling
distribution of the difference in mean quiz scores. The table below shows the summary statistics for the two groups. Assume
that all conditions for a randomization test have been satisfied.
-Use the histogram to roughly estimate the p-value. Choose the answer that most closely approximates the p-value. (Approximations have been made to the nearest hundredth.)
A)
B)
C)
D) None of these
3
Use the following information to answer the question. Can stretching help you stay alert in class? Thirty-six subjects were
measured for alertness at the beginning of class; the subjects then participated in some light arm and neck stretches followed
by a forty-five minute lecture. Each subject was then measured for alertness at the end of the lecture. The hypothesis test
results for the sign test are summarized below. Assume that all conditions for testing have been met: Hypothesis test results:
Parameter: Median of variable
-What is the name and value of the test statistic?
A)
B)
C)
D)
4
Use the following information to answer the question. Suppose the manager of a large furniture store wants to estimate the amount spent by customers during the holiday season. She took a random sample of customers and recorded the amount they spent. A histogram of the data shows that the data is strongly left-skewed. The figures below show the confidence intervals for the mean amount spent using (A) raw (untransformed) data, and (B) log-transformed data, which showed a more normally distributed data set. Use this information to answer the question.
-Calculate the width of both intervals (note that you will need to convert the log-transformed interval back into dollars). Which interval is narrower?
A) Width of interval for untransformed data: 144.2; width of interval for transformed data: 129.8. The width of the interval for the log transformed data is narrower.
B) Width of interval for untransformed data: 72.1; width of interval for transformed data: 273. The width of the interval for the log transformed data is narrower.
C) Width of interval for untransformed data: 144.2; width of interval for transformed data: 152.5. The width of the interval for the untransformed data is narrower.
D) Cannot be determined with the given information
Unlock Deck
Unlock for access to all 60 flashcards in this deck.
Unlock Deck
k this deck
5
In the context of nonparametric inference, what information can the QQ provide?
A) It is a tool that can help you determine whether a sample is drawn from a normal population.
B) It is a tool that displays quartile locations of data values which can provide information about the sample distribution.
C) It is tool that displays the distribution of transformed data.
D) None of these
Unlock Deck
Unlock for access to all 60 flashcards in this deck.
Unlock Deck
k this deck
6
State the null and alternative hypothesis and also the value of the test statistic for the professor's randomization test.
Unlock Deck
Unlock for access to all 60 flashcards in this deck.
Unlock Deck
k this deck
7
Use the following information to answer the question. Suppose the manager of a large furniture store wants to estimate the
amount spent by customers during the holiday season. She took a random sample of customers and recorded the amount
they spent. A histogram of the data shows that the data is strongly left-skewed. The figures below show the confidence
intervals for the mean amount spent using (A) raw (untransformed) data, and (B) log-transformed data, which showed a
more normally distributed data set. Use this information to answer the question.
-Choose the statement that explains which confidence interval more precisely depicts the data and why.
A) The confidence interval for the untransformed data is more precise because the values are in actual dollars which is more meaningful.
B) The confidence interval for the geometric mean is more precise because the distribution of the
Log-transformed data is more symmetric.
C) The confidence interval for the untransformed data is more precise because it is strongly
Left-skewed and the confidence interval gives a wider interval.
D) None of these.
Unlock Deck
Unlock for access to all 60 flashcards in this deck.
Unlock Deck
k this deck
8
Which of the following QQ plots most closely depicts data from a skewed population?
Unlock Deck
Unlock for access to all 60 flashcards in this deck.
Unlock Deck
k this deck
9
A used car lot owner wanted to estimate the amount spent by customers during the summer months. She took a random sample of customers and recorded the amount they spent. A histogram
Showed the data was right-skewed so she took the log of each value and verified that the
Distribution of these values was more Normally distributed. What test/method should she use to
Estimate the mean amount spent during the summer months?
A) Mann-Whitney Test
B) Data transformation
C) Paired t-test
D) Sign Test
Unlock Deck
Unlock for access to all 60 flashcards in this deck.
Unlock Deck
k this deck
10
Use the following information to answer the question. Can deep-knee bends help you stay alert in class? Forty subjects were
measured for alertness at the beginning of class then voluntarily performed fifteen deep-knee bends followed by a forty-five
minute lecture. Each subject was then measured for alertness at the end of the lecture. The hypothesis test results for the sign
test are summarized below. Assume that all conditions for testing have been met: Hypothesis test results:
Parameter: Median of variable
-Choose the correct null and alternative hypothesis.
A) : The median difference in alertness is 1 . : The median difference in alertness is not 1 .
B) : The median difference in alertness is not 0 . : The median difference in alertness is 0 .
C) : The median difference in alertness is 0 . : The median difference in alertness is not 0 .
D) None of these.
Unlock Deck
Unlock for access to all 60 flashcards in this deck.
Unlock Deck
k this deck
11
Which of the following statements is not true about the sign test?
A) The binomial model is used to find an exact p-value.
B) Matched pairs must be independent of other pairs in the sample.
C) The p-value is based on the normal distribution.
D) The sign test relies on the signs (negative or positive) of the measured differences in pairs.
A) The binomial model is used to find an exact p-value.
B) Matched pairs must be independent of other pairs in the sample.
C) The p-value is based on the normal distribution.
D) The sign test relies on the signs (negative or positive) of the measured differences in pairs.
Unlock Deck
Unlock for access to all 60 flashcards in this deck.
Unlock Deck
k this deck
12
Choose the correct null and alternative hypothesis to test the claim that adults between the ages of 24 and 34 and adults between the ages of 35 and 45 watch different amounts of televised sporting
Events.
Events.
Unlock Deck
Unlock for access to all 60 flashcards in this deck.
Unlock Deck
k this deck
13
In the context of nonparametric inference, what information can the QQ provide?
A) It is tool that displays the distribution of transformed data.
B) It is a tool that displays quartile locations of data values which can provide information about the sample distribution.
C) It is a tool that can help you determine whether a sample is drawn from a normal population.
D) None of these
Unlock Deck
Unlock for access to all 60 flashcards in this deck.
Unlock Deck
k this deck
14
Which of the following is an indication that nonparametric inference might be necessary?
A) The data is strongly skewed.
B) The sample size is too small to assume the CLT holds.
C) The distribution of the population is not Normal.
D) All of these are indications that nonparametric inference might be necessary.
A) The data is strongly skewed.
B) The sample size is too small to assume the CLT holds.
C) The distribution of the population is not Normal.
D) All of these are indications that nonparametric inference might be necessary.
Unlock Deck
Unlock for access to all 60 flashcards in this deck.
Unlock Deck
k this deck
15
Find the mean, median, and geometric mean for the following numbers: 10, 300, 1500, and 33,000. Round to the nearest tenth.
A) 900.0, 1000.0, 8700.0
B) 8700.0, 620.8, 950.0
C) 8702.5, 900.0, 620.8
D) 8702.5, 900.0, 29.2
A) 900.0, 1000.0, 8700.0
B) 8700.0, 620.8, 950.0
C) 8702.5, 900.0, 620.8
D) 8702.5, 900.0, 29.2
Unlock Deck
Unlock for access to all 60 flashcards in this deck.
Unlock Deck
k this deck
16
Use the following information to answer the question. Math self-efficacy can be defined as one's belief in his or her own
ability to perform mathematical tasks. A college math professor wishes to find out if her female students' math self-efficacy
matches reality. To do this she gives a math quiz to the female students then asks them to rate their level of confidence in
how well they did on the quiz. She plans to test whether those who had little confidence that they did well on the quiz
actually performed worse than those who had a high level of confidence that they did well on the quiz. Shown below is the
approximate sampling distribution of the difference in mean quiz scores. The table below shows the summary statistics for
the two groups. Assume that all conditions for a randomization test have been satisfied.
-Carry out the randomization test. What is the professor's conclusion? Are differences in mean quiz scores due to chance?
A) Fail to reject . The professor should conclude that there is no difference in mean quiz scores for those with high confidence and those with low confidence. The student's self-efficacy does not match reality.
B) Reject . The professor should conclude that there is no difference in mean quiz scores for those with high confidence and those with low confidence. The student's self-efficacy does not match reality.
C) Fail to reject . The professor should conclude that typical quiz scores for those with high confidence is less than that of those with low confidence. The student's self-efficacy matches reality.
D) Reject . The professor should conclude that typical quiz scores for those with high confidence is greater than that of those with low confidence. The student's self-efficacy matches reality.
Unlock Deck
Unlock for access to all 60 flashcards in this deck.
Unlock Deck
k this deck
17
Use the following information to answer the question. Suppose the Nielson Organization conducted a survey to find out how many minutes of televised sporting events people watched in one week. Assume that all conditions for the Mann test have been met. Use the following test output to answer the question. Hypothesis test results:
median for adults ages
median for adults ages
Parameter:
-Using a significance level of 5%, state the correct decision regarding the null hypothesis and the concluding statement.
A) Reject . There is evidence to suggest that there is difference in the median amount of televised sporting events that adults in the two age groups watched.
B) Fail to reject . There is evidence to suggest that there is a difference in the median amount of televised sporting events that adults in the two age groups watched.
C) Reject . There is evidence to suggest that there is no difference in the median amount of televised sporting events that adults in the two age groups watched.
D) Fail to reject . There is evidence to suggest that there is no difference in the median amount of televised sporting events that adults in the two age groups watched.
median for adults ages
median for adults ages
Parameter:
-Using a significance level of 5%, state the correct decision regarding the null hypothesis and the concluding statement.
A) Reject . There is evidence to suggest that there is difference in the median amount of televised sporting events that adults in the two age groups watched.
B) Fail to reject . There is evidence to suggest that there is a difference in the median amount of televised sporting events that adults in the two age groups watched.
C) Reject . There is evidence to suggest that there is no difference in the median amount of televised sporting events that adults in the two age groups watched.
D) Fail to reject . There is evidence to suggest that there is no difference in the median amount of televised sporting events that adults in the two age groups watched.
Unlock Deck
Unlock for access to all 60 flashcards in this deck.
Unlock Deck
k this deck
18
Use the following information to answer the question. Suppose the Nielson Organization conducted a survey to find out how
many minutes of reality-type television programming people watched in one week. Assume that all conditions for the
Mann-Whitney test have been met. Use the following test output to answer the question. Hypothesis test results:
median for women
median for men
Parameter: m1-m2
-Choose the correct null and alternative hypothesis to test the claim that men and women watch different amounts of reality-type programming.
A) : The median for men and women are not equal.
: The median for men is equal to the median for women.
B) : The median for men is equal to the median for women.
: The median for men is less than the median for women.
C) : The median for men is equal to the median for women.
: The median for men and women are not equal.
D) : The median for men is equal to the median for women.
: The median for men is greater than the median for women.
Unlock Deck
Unlock for access to all 60 flashcards in this deck.
Unlock Deck
k this deck
19
Which of the following statements could be a reason to justify the use of the sign test?
A) The data are matched pairs
B) The sample size is small
C) The distribution of the population is unknown or not Normal
D) All of these
A) The data are matched pairs
B) The sample size is small
C) The distribution of the population is unknown or not Normal
D) All of these
Unlock Deck
Unlock for access to all 60 flashcards in this deck.
Unlock Deck
k this deck
20
Choose the statement that is not true about the Mann-Whitney Test.
A) The Mann-Whitney Test is used to compare the centers of two groups of numerical variables.
B) The Mann-Whitney Test can be used when the Normal condition of the t-test is not met.
C) The Mann-Whitney Test is based on the ranks of the observations, not on their actual values.
D) The Mann-Whitney Test is based on the number of pairs with negative differences.
Unlock Deck
Unlock for access to all 60 flashcards in this deck.
Unlock Deck
k this deck
21
You are presented with data from two independent samples. The variable being measured is continuous. The distribution of the population of each sample is right skewed. You wish to test the
Hypothesis that there is a difference in the median value of the variable for the samples. What type
Test/method should you use?
A) Mann-Whitney Test
B) Data transformation
C) Paired t-test
D) Sign Test
Hypothesis that there is a difference in the median value of the variable for the samples. What type
Test/method should you use?
A) Mann-Whitney Test
B) Data transformation
C) Paired t-test
D) Sign Test
Unlock Deck
Unlock for access to all 60 flashcards in this deck.
Unlock Deck
k this deck
22
Use the following information to answer the question. Can deep-knee bends help you stay alert in class? Forty subjects were
measured for alertness at the beginning of class then voluntarily performed fifteen deep-knee bends followed by a forty-five
minute lecture. Each subject was then measured for alertness at the end of the lecture. The hypothesis test results for the sign
test are summarized below. Assume that all conditions for testing have been met: Hypothesis test results:
Parameter: Median of variable
-Using a significance level of 5%, state the correct decision regarding the null hypothesis and concluding statement.
A) Reject . There is evidence to suggest that there is difference in alertness after deep knee bends before the lecture.
B) Fail to reject . There is evidence to suggest that there is a difference in alertness after deep knee bends before the lecture.
C) Fail to reject . There is evidence to suggest that there is no difference in alertness after deep knee bends before the lecture.
D) Reject . There is evidence to suggest that there is no difference in alertness after deep knee bends before the lecture.
Unlock Deck
Unlock for access to all 60 flashcards in this deck.
Unlock Deck
k this deck
23
Use the following information to answer the question. Suppose the Nielson Organization conducted a survey to find out how
many minutes of reality-type television programming people watched in one week. Assume that all conditions for the
Mann-Whitney test have been met. Use the following test output to answer the question. Hypothesis test results:
median for women
median for men
Parameter: m1-m2
-Using a significance level of 5%, state the correct decision regarding the null hypothesis and the concluding statement.
A) Fail to reject . There is evidence to suggest that there is a difference in the median amount of reality-type television that men and women watch.
B) Fail to reject . There is evidence to suggest that there is no difference in the median amount of reality-type television that men and women watch.
C) Reject . There is evidence to suggest that there is a difference in the median amount of reality-type television that men and women watch.
D) Reject . There is evidence to suggest that there is no difference in the median amount of reality-type television that men and women watch.
Unlock Deck
Unlock for access to all 60 flashcards in this deck.
Unlock Deck
k this deck
24
A used car lot owner wanted to estimate the amount spent by customers during the summer months. She took a random sample of customers and recorded the amount they spent. A histogram
Showed the data was right-skewed so she took the log of each value and verified that the
Distribution of these values was more Normally distributed. What test/method should she use to
Estimate the mean amount spent during the summer months?
A) Mann-Whitney Test
B) Paired t-test
C) Sign Test
D) Data transformation and t-interval
Unlock Deck
Unlock for access to all 60 flashcards in this deck.
Unlock Deck
k this deck
25
Choose the statement that is not true about the Mann-Whitney Test.
A) The Mann-Whitney Test can be used when the Normal condition of the t-test is not met.
B) The Mann-Whitney Test is based on the ranks of the observations, not on their actual values.
C) The Mann-Whitney Test is based on the number of pairs with positive differences.
D) The Mann-Whitney Test is used to compare the centers of two groups of numerical variables.
Unlock Deck
Unlock for access to all 60 flashcards in this deck.
Unlock Deck
k this deck
26
Calculate the width of both intervals (note that you will need to convert the log-transformed interval back into dollars). Which interval is narrower?
A) Width of interval for untransformed data: 55.6; width of interval for transformed data: 111.2. The width of the interval for the log transformed data is narrower.
B) Cannot be determined with the given information
C) Width of interval for untransformed data: 111.2; width of interval for transformed data: 204.6. The width of the interval for the untransformed data is narrower.
D) Width of interval for untransformed data: 111.2; width of interval for transformed data: 92.7. The width of the interval for the log transformed data is narrower.
Unlock Deck
Unlock for access to all 60 flashcards in this deck.
Unlock Deck
k this deck
27
Find the mean, median, and geometric mean for the following numbers: 120, 400, 1300, and 22,000. List from smallest to largest and round to the nearest tenth.
A) 400.0, 1082.4, 9273.8
B) 9273.8, 850.0, 1082.4
C) 9300.0, 850.0, 120.0
D) 4765.0, 850.0, 1185.5
A) 400.0, 1082.4, 9273.8
B) 9273.8, 850.0, 1082.4
C) 9300.0, 850.0, 120.0
D) 4765.0, 850.0, 1185.5
Unlock Deck
Unlock for access to all 60 flashcards in this deck.
Unlock Deck
k this deck
28
Use the following information to answer the question. Can stretching help you stay alert in class? Thirty-six subjects were
measured for alertness at the beginning of class; the subjects then participated in some light arm and neck stretches followed
by a forty-five minute lecture. Each subject was then measured for alertness at the end of the lecture. The hypothesis test
results for the sign test are summarized below. Assume that all conditions for testing have been met: Hypothesis test results:
Parameter: Median of variable
-Using a significance level of 5%, state the correct decision regarding the null hypothesis and the concluding statement.
A) Reject . There is evidence to suggest that there is no difference in alertness after light arm and neck stretches before the lecture.
B) Reject . There is evidence to suggest that there is difference in alertness after light arm and neck stretches before the lecture.
C) Fail to reject . There is evidence to suggest that there is no difference in alertness after light arm and neck stretches before the lecture.
D) Fail to reject . There is evidence to suggest that there is a difference in alertness after light arm and neck stretches before the lecture.
Unlock Deck
Unlock for access to all 60 flashcards in this deck.
Unlock Deck
k this deck
29
Use the following information to answer the question. Math self-efficacy can be defined as one's belief in his or her own
ability to perform mathematical tasks. A college math professor wishes to find out if her female students' math self-efficacy
matches reality. To do this she gives a math quiz to the female students then asks them to rate their level of confidence in
how well they did on the quiz. She plans to test whether those who had little confidence that they did well on the quiz
actually performed worse than those who had a high level of confidence that they did well on the quiz. Shown below is the
approximate sampling distribution of the difference in mean quiz scores. The table below shows the summary statistics for
the two groups. Assume that all conditions for a randomization test have been satisfied.
-State the null and alternative hypothesis and also the value of the test statistic for the professor's randomization test.
A) : The typical quiz score for those with high confidence is the same as that of those with low confidence.
: The typical quiz score for those with high confidence is greater than that of those with low confidence.
The Test Statistic is
B) : The typical quiz score for those with high confidence is the same as that of those with low confidence.
: The typical quiz score for those with high confidence is greater than that of those with low confidence.
The Test Statistic is .
C) : The typical quiz score for those with high confidence is the same as that of those with low confidence.
: The typical quiz score for those with high confidence is greater than that of those with low confidence.
The Test Statistic is .
D) : The typical quiz score for those with high confidence is greater than that of those with low confidence.
: The typical quiz score for those with high confidence is the same as that of those with low confidence.
The Test Statistic is .
Unlock Deck
Unlock for access to all 60 flashcards in this deck.
Unlock Deck
k this deck
30
Use the following information to answer the question. Can stretching help you stay alert in class? Thirty-six subjects were
measured for alertness at the beginning of class; the subjects then participated in some light arm and neck stretches followed
by a forty-five minute lecture. Each subject was then measured for alertness at the end of the lecture. The hypothesis test
results for the sign test are summarized below. Assume that all conditions for testing have been met: Hypothesis test results:
Parameter: Median of variable
-Choose the correct null and alternative hypothesis.
A) : The median difference in alertness is 1 . : The median difference in alertness is not 1 .
B) : The median difference in alertness is not 0 . : The median difference in alertness is 0 .
C) : The median difference in alertness is 0 . : The median difference in alertness is not 0 .
D) None of these.
Unlock Deck
Unlock for access to all 60 flashcards in this deck.
Unlock Deck
k this deck
31
Use the following information to answer the question. Suppose the manager of a large high-end jewelry store wants to
estimate the amount spent by customers during the holiday season. She took a random sample of customers and recorded the
amount they spent. A histogram of the data shows that the data is strongly left-skewed. The figures below show the
confidence intervals for the mean amount spent using (A) raw (untransformed) data, and (B) log-transformed data, which
showed a more normally distributed data set. Use this information to answer the question.
-Choose the statement that explains which confidence interval is likely to be a more precise estimate of amount spent and why.
A) The confidence interval for the geometric mean is more precise because the distribution of the log-transformed data is more symmetric.
B) The confidence interval for the untransformed data is more precise because the values are in
Actual dollars which is more meaningful.
C) The confidence interval for the untransformed data is more precise because it is strongly
Left-skewed and the confidence interval gives a wider interval.
D) None of these.
Unlock Deck
Unlock for access to all 60 flashcards in this deck.
Unlock Deck
k this deck
32
Which of the following statements is not true about the sign test?
A) The p-value is based on the normal distribution.
B) Matched pairs must be independent of other pairs in the sample.
C) The binomial model is used to find an exact p-value.
D) The sign test relies on the signs (negative or positive) of the measured differences in pairs.
A) The p-value is based on the normal distribution.
B) Matched pairs must be independent of other pairs in the sample.
C) The binomial model is used to find an exact p-value.
D) The sign test relies on the signs (negative or positive) of the measured differences in pairs.
Unlock Deck
Unlock for access to all 60 flashcards in this deck.
Unlock Deck
k this deck
33
Use the histogram to roughly estimate the p-value. Choose the answer that most closely approximates the p-value. (Approximations have been made to the nearest hundredth.)
Unlock Deck
Unlock for access to all 60 flashcards in this deck.
Unlock Deck
k this deck
34
You are presented with data from two independent samples. The variable being measured is continuous. The distribution of the population of each sample is right skewed. You wish to test the
Hypothesis that there is a difference in the median value of the variable for the samples. What type
Test/method should you use?
A) Mann-Whitney Test
B) Sign Test
C) Paired t-test
D) Data transformation and t-interval
Hypothesis that there is a difference in the median value of the variable for the samples. What type
Test/method should you use?
A) Mann-Whitney Test
B) Sign Test
C) Paired t-test
D) Data transformation and t-interval
Unlock Deck
Unlock for access to all 60 flashcards in this deck.
Unlock Deck
k this deck
35
Which of the following statements could be a reason to justify the use of the sign test?
A) The data are matched pairs
B) The distribution of the population is unknown or not Normal
C) The sample size is small
D) All of these
A) The data are matched pairs
B) The distribution of the population is unknown or not Normal
C) The sample size is small
D) All of these
Unlock Deck
Unlock for access to all 60 flashcards in this deck.
Unlock Deck
k this deck
36
Use the following information to answer the question. Can deep-knee bends help you stay alert in class? Forty subjects were
measured for alertness at the beginning of class then voluntarily performed fifteen deep-knee bends followed by a forty
minute lecture. Each subject was then measured for alertness at the end of the lecture. The hypothesis test results for the sign
test are summarized below. Assume that all conditions for testing have been met: Hypothesis test results:
Parameter: Median of variable
-What is the name and value of the test statistic?
A)
B)
C)
D)
Unlock Deck
Unlock for access to all 60 flashcards in this deck.
Unlock Deck
k this deck
37
Use the following information to answer the question. Math self-efficacy can be defined as one's belief in his or her own
ability to perform mathematical tasks. A college math professor wishes to find out if her students' math self-efficacy matches
reality. To do this she gives a math quiz then asks her students to rate their level of confidence in how well they did on the
quiz. She plans to test whether those who had little confidence that they did well on the quiz actually performed worse than
those who had a high level of confidence that they did well on the quiz. Shown below is the approximate sampling
distribution of the difference in mean quiz scores. The table below shows the summary statistics for the two groups. Assume
that all conditions for a randomization test have been satisfied.
-Carry out the randomization test. What is the professor's conclusion? Are differences in mean quiz scores due to chance?
A) Reject . The professor should conclude that typical quiz scores for those with high confidence is greater than that of those with low confidence. The student's self-efficacy matches reality.
B) Fail to reject . The professor should conclude that typical quiz scores for those with high confidence is greater than that of those with low confidence. The student's self-efficacy matches reality.
C) Fail to reject . The professor should conclude that there is no difference in mean quiz scores for those with high confidence and those with low confidence. The student's self-efficacy does not match reality.
D) Reject . The professor should conclude that there is no difference in mean quiz scores for those with high confidence and those with low confidence. The student's self-efficacy does not match reality.
Unlock Deck
Unlock for access to all 60 flashcards in this deck.
Unlock Deck
k this deck
38
Which of the following is not necessarily an indication that nonparametric inference might be necessary?
A) The distribution of the population is not Normal.
B) The sample size is too small to assume the CLT holds.
C) Variables must be matched pairs.
D) The data is strongly skewed.
A) The distribution of the population is not Normal.
B) The sample size is too small to assume the CLT holds.
C) Variables must be matched pairs.
D) The data is strongly skewed.
Unlock Deck
Unlock for access to all 60 flashcards in this deck.
Unlock Deck
k this deck
39
A new fiber bar is advertised to curb hunger for three hours. A sample of thirty-six hungry subjects were asked to record their level of hunger before eating the fiber bar and again three hours after
Eating the fiber bar. Which test should be used to test the hypothesis there is no difference in the
Level of hunger three hours after eating the fiber bar (i.e. the fiber bar curbed hunger for three
Hours)?
A) Paired t-test
B) Sign Test
C) Data transformation
D) Mann-Whitney Test
Eating the fiber bar. Which test should be used to test the hypothesis there is no difference in the
Level of hunger three hours after eating the fiber bar (i.e. the fiber bar curbed hunger for three
Hours)?
A) Paired t-test
B) Sign Test
C) Data transformation
D) Mann-Whitney Test
Unlock Deck
Unlock for access to all 60 flashcards in this deck.
Unlock Deck
k this deck
40
A new fiber bar is advertised to curb hunger for three hours. A sample of thirty-six hungry subjects were asked to record their level of hunger before eating the fiber bar and again three hours after
Eating the fiber bar. Which test should be used to test the hypothesis there is no difference in the
Level of hunger three hours after eating the fiber bar (i.e. the fiber bar curbed hunger for three
Hours)?
A) Mann-Whitney Test
B) Data transformation
C) Paired t-test
D) Sign Test
Eating the fiber bar. Which test should be used to test the hypothesis there is no difference in the
Level of hunger three hours after eating the fiber bar (i.e. the fiber bar curbed hunger for three
Hours)?
A) Mann-Whitney Test
B) Data transformation
C) Paired t-test
D) Sign Test
Unlock Deck
Unlock for access to all 60 flashcards in this deck.
Unlock Deck
k this deck
41
Use the following information to answer the question. Can dogs lower anxiety in math class?
Fifty subjects who reported anxiety about attending math class were measured for stress at the beginning of a math class then spent 15 minutes interacting with a dog followed by a forty-five minute math lecture. Each subject was then measured for stress at the end of the lecture. The hypothesis test results for the sign test are summarized below. Assume that all conditions for testing have been met:
-Calculate the value of the test statistic and state the value of the p-value.
Unlock Deck
Unlock for access to all 60 flashcards in this deck.
Unlock Deck
k this deck
42
Calculate the mean, median, and geometric mean for the following numbers:
110, 500, 1700, and 31,000. List from smallest to largest and round to the nearest tenth.
110, 500, 1700, and 31,000. List from smallest to largest and round to the nearest tenth.
Unlock Deck
Unlock for access to all 60 flashcards in this deck.
Unlock Deck
k this deck
43
Describe some conditions that might indicate that sign test should be used for inference.
Unlock Deck
Unlock for access to all 60 flashcards in this deck.
Unlock Deck
k this deck
44
Suppose you are asked to analyze sample data but you do not know the distribution of the population it came from. Explain how a QQ plot can be used to give you information about the population from which the samples was drawn.
Unlock Deck
Unlock for access to all 60 flashcards in this deck.
Unlock Deck
k this deck
45
Use the following information to answer the question. Can dogs lower anxiety in math class?
Fifty subjects who reported anxiety about attending math class were measured for stress at the beginning of a math class then spent 15 minutes interacting with a dog followed by a forty-five minute math lecture. Each subject was then measured for stress at the end of the lecture. The hypothesis test results for the sign test are summarized below. Assume that all conditions for testing have been met:
-Explain how the binomial model is used to calculate the p-value.
Unlock Deck
Unlock for access to all 60 flashcards in this deck.
Unlock Deck
k this deck
46
Use the following information to answer the question. Suppose the Nielson Organization conducted a survey to find out how many minutes of crime dramas that people watched in one week. Assume that all conditions for the Mann-Whitney test have been met. Use the following test output to answer the question.
-Using a significance level of 5%, state the correct decision regarding the null hypothesis and write a sentence which summarizes the conclusion and addresses the claim.
-Using a significance level of 5%, state the correct decision regarding the null hypothesis and write a sentence which summarizes the conclusion and addresses the claim.
Unlock Deck
Unlock for access to all 60 flashcards in this deck.
Unlock Deck
k this deck
47
Use the following information to answer the question. Suppose the manager of a large appliance and electronics store wants to estimate the amount spent by customers during the holiday season. He took a random sample of customers and recorded the amount they spent. A histogram of the data shows that the data is strongly left-skewed. The figures below show the confidence intervals for the mean amount spent using (A) raw (untransformed) data, and (B) log-transformed data, which showed a more normally distributed data set.
-Which interval should the manager report to the store owner about the typical amount of money spent during the holiday season?
Explain.
-Which interval should the manager report to the store owner about the typical amount of money spent during the holiday season?
Explain.
Unlock Deck
Unlock for access to all 60 flashcards in this deck.
Unlock Deck
k this deck
48
State the null and alternative hypothesis to test the claim that dogs can affect anxiety levels.
Unlock Deck
Unlock for access to all 60 flashcards in this deck.
Unlock Deck
k this deck
49
List three of the five conditions, pertaining to the sample, which must be met in order to use the Mann-Whitney test.
Unlock Deck
Unlock for access to all 60 flashcards in this deck.
Unlock Deck
k this deck
50
Use the following information to answer the question. Math self-efficacy can be defined as one's belief in his or her own ability to perform mathematical tasks. A college math professor wishes to find out if her male students' math self-efficacy matches reality. To do this she gives a math quiz to the male students then asks them to rate their level of confidence in how well they did on the quiz. She plans to test whether those who had little confidence that they did well on the quiz actually performed worse than those who had a high level of confidence that they did well on the quiz. Shown below is the approximate sampling distribution of the difference in mean quiz scores. The table below shows the summary statistics for the two groups. Assume that all conditions for a randomization test have been satisfied.
-Complete the randomization test by stating the proper decision regarding the null hypothesis and the professor's conclusion. Are differences in mean quiz scores due to chance?
-Complete the randomization test by stating the proper decision regarding the null hypothesis and the professor's conclusion. Are differences in mean quiz scores due to chance?
Unlock Deck
Unlock for access to all 60 flashcards in this deck.
Unlock Deck
k this deck
51
Suppose data was collected from ten women and twelve men about the length in minutes of their commute to work. The histogram for men was roughly normal, but the histogram for women was strongly skewed to the right. Explain why the t-test is not appropriate to test whether men and women have different commute times.
Unlock Deck
Unlock for access to all 60 flashcards in this deck.
Unlock Deck
k this deck
52
Explain some factors that might indicate that nonparametric inference might be necessary.
Unlock Deck
Unlock for access to all 60 flashcards in this deck.
Unlock Deck
k this deck
53
Refer to the following two histograms and QQ plots of the same data to answer the question.
-For which sample might a log transform be useful?
Explain. (There are no zeros or negative values in either data set.)
-For which sample might a log transform be useful?
Explain. (There are no zeros or negative values in either data set.)
Unlock Deck
Unlock for access to all 60 flashcards in this deck.
Unlock Deck
k this deck
54
Use the following information to answer the question. Suppose the manager of a large appliance and electronics store wants to estimate the amount spent by customers during the holiday season. He took a random sample of customers and recorded the amount they spent. A histogram of the data shows that the data is strongly left-skewed. The figures below show the confidence intervals for the mean amount spent using (A) raw (untransformed) data, and (B) log-transformed data, which showed a more normally distributed data set.
-Calculate the width of both intervals (note that you will need to convert the log-transformed interval back into dollars) and state which interval is narrower?
-Calculate the width of both intervals (note that you will need to convert the log-transformed interval back into dollars) and state which interval is narrower?
Unlock Deck
Unlock for access to all 60 flashcards in this deck.
Unlock Deck
k this deck
55
Refer to the following two histograms and QQ plots of the same data to answer the question.
-Match the histogram with the corresponding QQ plot.
-Match the histogram with the corresponding QQ plot.
Unlock Deck
Unlock for access to all 60 flashcards in this deck.
Unlock Deck
k this deck
56
You are presented with data from two independent samples. The variable being measured is continuous. The distribution of the population of each sample is right skewed. You wish to test the hypothesis that there is a difference in the median value of the variable for the samples. What type of test/method should you use?
Explain why the t-test is not appropriate in this situation.
Explain why the t-test is not appropriate in this situation.
Unlock Deck
Unlock for access to all 60 flashcards in this deck.
Unlock Deck
k this deck
57
Use the following information to answer the question. Can dogs lower anxiety in math class?
Fifty subjects who reported anxiety about attending math class were measured for stress at the beginning of a math class then spent 15 minutes interacting with a dog followed by a forty-five minute math lecture. Each subject was then measured for stress at the end of the lecture. The hypothesis test results for the sign test are summarized below. Assume that all conditions for testing have been met:
-Using a significance level of 5%, state the correct decision regarding the null hypothesis and write a sentence which summarizes the conclusion and addresses the claim.
Unlock Deck
Unlock for access to all 60 flashcards in this deck.
Unlock Deck
k this deck
58
Use the following information to answer the question. Math self-efficacy can be defined as one's belief in his or her own ability to perform mathematical tasks. A college math professor wishes to find out if her male students' math self-efficacy matches reality. To do this she gives a math quiz to the male students then asks them to rate their level of confidence in how well they did on the quiz. She plans to test whether those who had little confidence that they did well on the quiz actually performed worse than those who had a high level of confidence that they did well on the quiz. Shown below is the approximate sampling distribution of the difference in mean quiz scores. The table below shows the summary statistics for the two groups. Assume that all conditions for a randomization test have been satisfied.
-State the null and alternative hypothesis and also the value of the test statistic for the professor's randomization test.
-State the null and alternative hypothesis and also the value of the test statistic for the professor's randomization test.
Unlock Deck
Unlock for access to all 60 flashcards in this deck.
Unlock Deck
k this deck
59
Use the following information to answer the question. Math self-efficacy can be defined as one's belief in his or her own ability to perform mathematical tasks. A college math professor wishes to find out if her male students' math self-efficacy matches reality. To do this she gives a math quiz to the male students then asks them to rate their level of confidence in how well they did on the quiz. She plans to test whether those who had little confidence that they did well on the quiz actually performed worse than those who had a high level of confidence that they did well on the quiz. Shown below is the approximate sampling distribution of the difference in mean quiz scores. The table below shows the summary statistics for the two groups. Assume that all conditions for a randomization test have been satisfied.
-Explain how you would use the histogram to get an approximate p-value and state your p-value estimation.
-Explain how you would use the histogram to get an approximate p-value and state your p-value estimation.
Unlock Deck
Unlock for access to all 60 flashcards in this deck.
Unlock Deck
k this deck
60
Use the following information to answer the question. Suppose the Nielson Organization conducted a survey to find out how many minutes of crime dramas that people watched in one week. Assume that all conditions for the Mann been met. Use the following test output to answer the question.
-State the null and alternative hypothesis to test the claim that adults between the ages of 24 and 39 and adults between the ages of 40 and 55 watch different amounts of crime dramas on television.
-State the null and alternative hypothesis to test the claim that adults between the ages of 24 and 39 and adults between the ages of 40 and 55 watch different amounts of crime dramas on television.
Unlock Deck
Unlock for access to all 60 flashcards in this deck.
Unlock Deck
k this deck
Unlock Deck
Unlock for access to all 60 flashcards in this deck.


