Deck 9: Inferring Population Means
Full screen (f)
Question
Question
Question
Question
A sociologist wants to know whether there is a difference in the mean number of times that men and women in the U. S. check their Smartphone during the day. Test the hypothesis that the mean number of times that men and women in the U. S. check their Smartphone during the day is different. Following are the summary statistics: 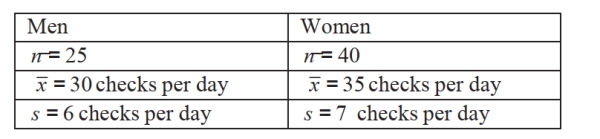 Assume that all conditions for testing have been met. Be sure to report the null and alternative hypothesis, test statistic, p-value, your decision regarding the null hypothesis, and your conclusion about the original claim. Round all values to the nearest thousandth.
Assume that all conditions for testing have been met. Be sure to report the null and alternative hypothesis, test statistic, p-value, your decision regarding the null hypothesis, and your conclusion about the original claim. Round all values to the nearest thousandth. Question
Question
Question
Question
The quality engineer at a paint manufacturer conducted a hypothesis test to test the claim that the mean volume of paint cans had changed after an adjustment in the manufacturing process. Mean volume in paint cans before the adjustment was 1.02 gallons. Assume that all conditions for testing have been met. She used technology to complete the hypothesis test. Following is the null and alternative hypothesis and the output from her graphing calculator. 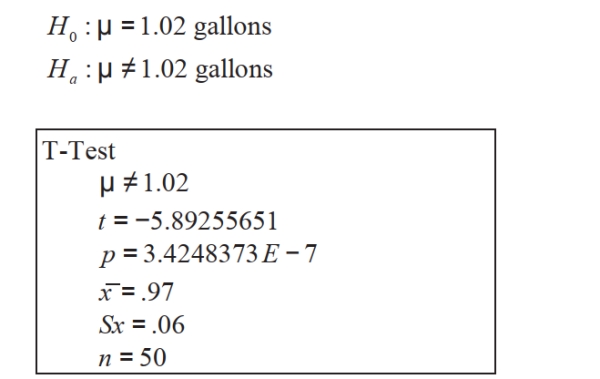 Write a statement explaining what her decision regarding the null hypothesis should be and a statement summarizing her conclusion regarding the claim that average volume of paint cans had changed. Has the adjustment in the manufacturing process changed the average volume of paint cans?
Write a statement explaining what her decision regarding the null hypothesis should be and a statement summarizing her conclusion regarding the claim that average volume of paint cans had changed. Has the adjustment in the manufacturing process changed the average volume of paint cans? Question
Question
Question
Question
Question
Question
Question
Question
Question
Question
Question
Question
Question
A researcher wants to know whether athletic men are more flexible than non-athletic men. For this experiment, a man who exercised vigorously at least four times per week was considered "athletic". Flexibility is measured in inches on a sit & reach box. Test the researcher's claim using the following summary statistics:
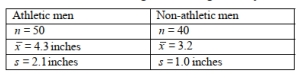
Assume that all conditions for testing have been met. Report the test statistic and p-value. At the 5% significance level, state your decision regarding the null hypothesis and your conclusion about the original claim. Round all values to the nearest thousandth.
A) t = 3.270; p = 0.001 ; Fail to reject the null hypothesis; there is not strong evidence to suggest that athletic men are more flexible than non-athletic men.
B) t = 3.270; p = 0.001 ; Reject the null hypothesis; there is strong evidence to suggest that athletic men are more flexible than non-athletic men.
C) t = −3.270; p = 0.002 ; Reject the null hypothesis; there is strong evidence to suggest that athletic men are more flexible than non-athletic men.
D) t = −3.270; p = 0.002 ; Reject the null hypothesis; there is not strong evidence to suggest that athletic men are more flexible than non-athletic men.
Question
Question
Question
Question
Question
Question
Question
Question
A researcher wants to know if mood is affected by music. She conducts a test on a sample of 4 randomly selected adults and measures mood rating before and after being exposed to classic rock music. Test the hypothesis that mood rating decreased after being exposed to classic rock music. Following are the mood ratings for the four participants:
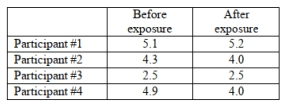
Assume that all conditions for testing have been met. Report the null and alternative hypothesis and P- value. At the 5% significance level, state your decision regarding the null hypothesis and your conclusion about the original claim. Round all values to the nearest thousandth.
A)
B)
C)
D)
Assume that all conditions for testing have been met. Report the null and alternative hypothesis and P- value. At the 5% significance level, state your decision regarding the null hypothesis and your conclusion about the original claim. Round all values to the nearest thousandth.
A)
B)
C)
D)
Question
An economist conducted a hypothesis test to test the claim that the average cost of eating a meal away from home decreased from 2012 to 2013. The average cost of eating a meal away from home in 2012 was $7.15 per person per meal. Assume that all conditions for testing have been met. He used technology to complete the hypothesis test. Following is his null and alternative hypothesis and the output from his graphing calculator.
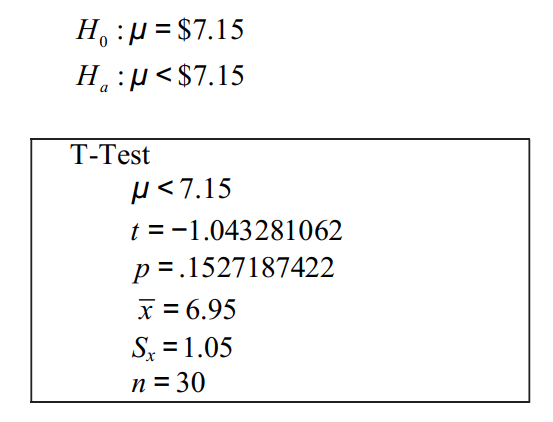
Choose the statement that contains the correct conclusion regarding the hypothesis and the original claim.
A) Reject the null hypothesis; there is sufficient evidence to support the claim that the average cost of eating away from home has decreased since 2012.
B) Reject the null hypothesis; there is not sufficient evidence to support the claim that the average cost of eating away from home has decreased since 2012.
C) Fail to reject the null hypothesis; there is sufficient evidence to support the claim that the average cost of eating away from home has decreased since 2012.
D) Fail to reject the null hypothesis; there is not sufficient evidence to support the claim that the average cost of eating away from home has decreased since 2012
Question
Question
Question
Question
Question
[Objective: Find a confidence interval for sample mean] The weights at birth of five randomly chosen baby Orca whales were 425,454,380,405, and 426 pounds. Assume the distribution of weights is normally distributed. Find a 95% confidence interval for the mean weight of all baby Orca whales. Use technology for your calculations. Give the confidence interval in the form "estimate ![<strong>[Objective: Find a confidence interval for sample mean] The weights at birth of five randomly chosen baby Orca whales were 425,454,380,405, and 426 pounds. Assume the distribution of weights is normally distributed. Find a 95% confidence interval for the mean weight of all baby Orca whales. Use technology for your calculations. Give the confidence interval in the form estimate margin of error. Round to the nearest tenth of a pound.</strong> A) B) C) D) <div style=padding-top: 35px>](https://d2lvgg3v3hfg70.cloudfront.net/TB34225555/11ec8efb_7250_4041_aaa3_070d0597ea3d_TB34225555_11.jpg) margin of error". Round to the nearest tenth of a pound.
margin of error". Round to the nearest tenth of a pound.
A)![<strong>[Objective: Find a confidence interval for sample mean] The weights at birth of five randomly chosen baby Orca whales were 425,454,380,405, and 426 pounds. Assume the distribution of weights is normally distributed. Find a 95% confidence interval for the mean weight of all baby Orca whales. Use technology for your calculations. Give the confidence interval in the form estimate margin of error. Round to the nearest tenth of a pound.</strong> A) B) C) D) <div style=padding-top: 35px>](https://d2lvgg3v3hfg70.cloudfront.net/TB34225555/11ec8efb_5030_710d_aaa3_4b384a288dea_TB34225555_11.jpg)
B)![<strong>[Objective: Find a confidence interval for sample mean] The weights at birth of five randomly chosen baby Orca whales were 425,454,380,405, and 426 pounds. Assume the distribution of weights is normally distributed. Find a 95% confidence interval for the mean weight of all baby Orca whales. Use technology for your calculations. Give the confidence interval in the form estimate margin of error. Round to the nearest tenth of a pound.</strong> A) B) C) D) <div style=padding-top: 35px>](https://d2lvgg3v3hfg70.cloudfront.net/TB34225555/11ec8efb_5032_e20e_aaa3_f778fa8d0cf3_TB34225555_11.jpg)
C)![<strong>[Objective: Find a confidence interval for sample mean] The weights at birth of five randomly chosen baby Orca whales were 425,454,380,405, and 426 pounds. Assume the distribution of weights is normally distributed. Find a 95% confidence interval for the mean weight of all baby Orca whales. Use technology for your calculations. Give the confidence interval in the form estimate margin of error. Round to the nearest tenth of a pound.</strong> A) B) C) D) <div style=padding-top: 35px>](https://d2lvgg3v3hfg70.cloudfront.net/TB34225555/11ec8efb_5033_7e4f_aaa3_e1f65e2df82c_TB34225555_11.jpg)
D)![<strong>[Objective: Find a confidence interval for sample mean] The weights at birth of five randomly chosen baby Orca whales were 425,454,380,405, and 426 pounds. Assume the distribution of weights is normally distributed. Find a 95% confidence interval for the mean weight of all baby Orca whales. Use technology for your calculations. Give the confidence interval in the form estimate margin of error. Round to the nearest tenth of a pound.</strong> A) B) C) D) <div style=padding-top: 35px>](https://d2lvgg3v3hfg70.cloudfront.net/TB34225555/11ec8efb_5033_f380_aaa3_e36e8cff5c5a_TB34225555_11.jpg)
margin of error". Round to the nearest tenth of a pound.A)
B)
C)
D)
Question
Question
Question
Question
Question
Question
Question
A)

B)

C)

D)
Question
Use the following information to answer questions (12)-(15). Many couples believe that it is getting too expensive to host an "average" wedding in the United States. According to a statistics study in the U.S., the average cost of a wedding in the U.S. in 2014 was $25,200. Recently, in a random sample of 35 weddings in the U.S. it was found that the average cost of a wedding was $24,224 with a standard deviation of $2,210.
a. Find the critical z value for the given level of confidence and multiply by the standard error using the formula
b. Find the critical t value for the given level of confidence and multiply by the standard error using the formula
c. Find the critical z value for the given level of confidence and multiply by the standard error using the formula
d. Find the critical t value for the given level of confidence and multiply by the standard error using the formula
Question
Question
[Objective: Understand the hypothesis test of the mean] Suppose a consumer product researcher wanted to find out whether a Sharpie lasted longer than the manufacturer's claim that their Sharpies could write continuously for a mean of 14 hours. The researcher tested 40 Sharpie's and recorded the number of continuous hours each Sharpie wrote before drying up. Test the hypothesis that Sharpies can write for more than a mean of 14 continuous hours. Following are the summary statistics: ![<strong>[Objective: Understand the hypothesis test of the mean] Suppose a consumer product researcher wanted to find out whether a Sharpie lasted longer than the manufacturer's claim that their Sharpies could write continuously for a mean of 14 hours. The researcher tested 40 Sharpie's and recorded the number of continuous hours each Sharpie wrote before drying up. Test the hypothesis that Sharpies can write for more than a mean of 14 continuous hours. Following are the summary statistics: =14.5 hours, s=1.2 hours At the 5% significance level, t=2.635 ; p=0.006. State your conclusion about the original claim.</strong> A) Do not reject the null hypothesis; there is not strong enough evidence to suggest that the Sharpies last longer than a mean of 14 hours. B) Reject the alternative hypothesis; there is strong evidence to suggest that the Sharpies last longer than a mean of 14 hours. C) Reject the null hypothesis; there is strong evidence to suggest that the Sharpies last longer than a mean of 14 hours. D) There needs to be more data to determine if the Sharpies last longer than a mean of 14 hours. <div style=padding-top: 35px>](https://d2lvgg3v3hfg70.cloudfront.net/TB34225555/11ec8efe_8e71_748a_aaa3_dd8c4034475b_TB34225555_11.jpg) =14.5 hours, s=1.2 hours
=14.5 hours, s=1.2 hours
At the 5% significance level, t=2.635 ; p=0.006. State your conclusion about the original claim.
A) Do not reject the null hypothesis; there is not strong enough evidence to suggest that the Sharpies last longer than a mean of 14 hours.
B) Reject the alternative hypothesis; there is strong evidence to suggest that the Sharpies last longer than a mean of 14 hours.
C) Reject the null hypothesis; there is strong evidence to suggest that the Sharpies last longer than a mean of 14 hours.
D) There needs to be more data to determine if the Sharpies last longer than a mean of 14 hours.
=14.5 hours, s=1.2 hoursAt the 5% significance level, t=2.635 ; p=0.006. State your conclusion about the original claim.
A) Do not reject the null hypothesis; there is not strong enough evidence to suggest that the Sharpies last longer than a mean of 14 hours.
B) Reject the alternative hypothesis; there is strong evidence to suggest that the Sharpies last longer than a mean of 14 hours.
C) Reject the null hypothesis; there is strong evidence to suggest that the Sharpies last longer than a mean of 14 hours.
D) There needs to be more data to determine if the Sharpies last longer than a mean of 14 hours.
Question
Question
Question
Question
Question
Question
Question
Question
Question
Question
Question
Question
[Objective: Conduct a hypothesis test on two independent samples] A researcher wants to know whether athletic women are more flexible than non-athletic women. For this experiment, a woman who exercised vigorously at least four times per week was considered "athletic". Flexibility is measured in inches on a sit & reach box. A researcher tested his claim using the following summary statistics:
![<strong>[Objective: Conduct a hypothesis test on two independent samples] A researcher wants to know whether athletic women are more flexible than non-athletic women. For this experiment, a woman who exercised vigorously at least four times per week was considered athletic. Flexibility is measured in inches on a sit & reach box. A researcher tested his claim using the following summary statistics: Assume that all conditions for testing have been met. ; At the 1% significance level, state your decision regarding the null hypothesis and your conclusion about the original claim.</strong> A) Fail to reject the null hypothesis; there is not strong enough evidence to suggest that athletic women are more flexible, on average, than non-athletic women. B) Reject the null hypothesis; there is strong evidence to suggest that athletic women are more flexible, on average, than non-athletic women. C) Reject the null hypothesis; there is strong evidence to suggest that non-athletic women are more flexible, on average, than athletic women. D) Fail to reject the null hypothesis; there is strong evidence to suggest that non-athletic women are more flexible, on average, than athletic women. <div style=padding-top: 35px>](https://d2lvgg3v3hfg70.cloudfront.net/TB34225555/11ec8eff_2171_237f_aaa3_ebc6ade4b70e_TB34225555_11.jpg)
Assume that all conditions for testing have been met.![<strong>[Objective: Conduct a hypothesis test on two independent samples] A researcher wants to know whether athletic women are more flexible than non-athletic women. For this experiment, a woman who exercised vigorously at least four times per week was considered athletic. Flexibility is measured in inches on a sit & reach box. A researcher tested his claim using the following summary statistics: Assume that all conditions for testing have been met. ; At the 1% significance level, state your decision regarding the null hypothesis and your conclusion about the original claim.</strong> A) Fail to reject the null hypothesis; there is not strong enough evidence to suggest that athletic women are more flexible, on average, than non-athletic women. B) Reject the null hypothesis; there is strong evidence to suggest that athletic women are more flexible, on average, than non-athletic women. C) Reject the null hypothesis; there is strong evidence to suggest that non-athletic women are more flexible, on average, than athletic women. D) Fail to reject the null hypothesis; there is strong evidence to suggest that non-athletic women are more flexible, on average, than athletic women. <div style=padding-top: 35px>](https://d2lvgg3v3hfg70.cloudfront.net/TB34225555/11ec8eff_2174_f410_aaa3_bd49a3017ec8_TB34225555_11.jpg)
; At the 1% significance level, state your decision regarding the null hypothesis and your conclusion about the original claim.
A) Fail to reject the null hypothesis; there is not strong enough evidence to suggest that athletic women are more flexible, on average, than non-athletic women.
B) Reject the null hypothesis; there is strong evidence to suggest that athletic women are more flexible, on average, than non-athletic women.
C) Reject the null hypothesis; there is strong evidence to suggest that non-athletic women are more flexible, on average, than athletic women.
D) Fail to reject the null hypothesis; there is strong evidence to suggest that non-athletic women are more flexible, on average, than athletic women.
Assume that all conditions for testing have been met.
; At the 1% significance level, state your decision regarding the null hypothesis and your conclusion about the original claim.
A) Fail to reject the null hypothesis; there is not strong enough evidence to suggest that athletic women are more flexible, on average, than non-athletic women.
B) Reject the null hypothesis; there is strong evidence to suggest that athletic women are more flexible, on average, than non-athletic women.
C) Reject the null hypothesis; there is strong evidence to suggest that non-athletic women are more flexible, on average, than athletic women.
D) Fail to reject the null hypothesis; there is strong evidence to suggest that non-athletic women are more flexible, on average, than athletic women.

Unlock Deck
Sign up to unlock the cards in this deck!
Unlock Deck
Unlock Deck
1/57
Play
Full screen (f)
Deck 9: Inferring Population Means
1
Explain what is meant when we say that the sample mean is an unbiased estimator.
When many samples of size n are taken from a population, the mean of the sampling distribution of sample means is equal to the population mean. Since sample mean is an accurate estimate of the population parameter, it is called an unbiased estimator.
2
Suppose that a major league baseball game has an average length of 2.9 hours with a standard deviation of 0.5 hours. It is known that game length is not normally distributed. Suppose a random sample of 36 games is taken from the population. What is the approximate probability that average game length will be greater than 3.15 hours or less than 2.75 hours? Round to the nearest thousandth.
0.037
3
Use the following information to answer questions (11)-(13). According to the website www.costofwedding.com, the
average cost of catering a wedding (with an open bar) is $100 per person. Recently, in a random sample of 40
weddings in the U. S. it was found that the average catering cost was $110, with a standard deviation of $12. On the
basis of this, a 95% confidence interval for the mean catering cost for a wedding is $106 to $114.
A popular wedding magazine states in an article on catering costs that "There is a 95% chance that the catering cost of your wedding will be between $106 and $114 per person." Explain what is wrong with this statement and write a better statement that correctly interprets the confidence interval.
A confidence interval does not describe a probability. The correct statement should be similar to the following: "We are 95% confident that the mean catering cost of a wedding will be between $106 and $114 per person."
4
A sociologist wants to know whether there is a difference in the mean number of times that men and women in the U. S. check their Smartphone during the day. Test the hypothesis that the mean number of times that men and women in the U. S. check their Smartphone during the day is different. Following are the summary statistics: Assume that all conditions for testing have been met. Be sure to report the null and alternative hypothesis, test statistic, p-value, your decision regarding the null hypothesis, and your conclusion about the original claim. Round all values to the nearest thousandth.
Assume that all conditions for testing have been met. Be sure to report the null and alternative hypothesis, test statistic, p-value, your decision regarding the null hypothesis, and your conclusion about the original claim. Round all values to the nearest thousandth. Unlock Deck
Unlock for access to all 57 flashcards in this deck.
Unlock Deck
k this deck
5
Suppose that a major league baseball game has an average length of 2.9 hours with a standard deviation of 0.5 hours. It is known that game length is not normally distributed. Suppose a random sample of 36 games is taken from the population. Sketch the probability distribution and shade in the region that corresponds to the probability. What is the approximate probability that average game length will be greater than 3.1 hours? Round to the nearest thousandth.
Unlock Deck
Unlock for access to all 57 flashcards in this deck.
Unlock Deck
k this deck
6
[Differentiate between dependent and independent samples] State whether the situation has dependent or independent samples. A researcher wants to know if reaction time is affected by the gender of the driver. He measures the reaction time of 30 female drivers while they drive a compact car, then he measures the reaction time of 30 male drivers while they drive a compact car.
Unlock Deck
Unlock for access to all 57 flashcards in this deck.
Unlock Deck
k this deck
7
Describe the circumstances under which a confidence interval and hypothesis test yield the same results?
Unlock Deck
Unlock for access to all 57 flashcards in this deck.
Unlock Deck
k this deck
8
The quality engineer at a paint manufacturer conducted a hypothesis test to test the claim that the mean volume of paint cans had changed after an adjustment in the manufacturing process. Mean volume in paint cans before the adjustment was 1.02 gallons. Assume that all conditions for testing have been met. She used technology to complete the hypothesis test. Following is the null and alternative hypothesis and the output from her graphing calculator. Write a statement explaining what her decision regarding the null hypothesis should be and a statement summarizing her conclusion regarding the claim that average volume of paint cans had changed. Has the adjustment in the manufacturing process changed the average volume of paint cans?
Write a statement explaining what her decision regarding the null hypothesis should be and a statement summarizing her conclusion regarding the claim that average volume of paint cans had changed. Has the adjustment in the manufacturing process changed the average volume of paint cans? Unlock Deck
Unlock for access to all 57 flashcards in this deck.
Unlock Deck
k this deck
9
Use the following information to answer questions (1) - (4). A sprint duathlon consists of a 5 km run, a 20 km
bike ride, followed by another 5 km run. The mean finish time of all male participants in a recent large duathlon
was 1.54 hours with a standard deviation of 0.22 hours. The distribution of finish times for males is right-skewed.
Suppose that a sample of 30 randomly selected male participants is selected.
What is the expected finish time for a male participant in the sample of 30? Will the expected mean finish time be the same for any sample of 30 males drawn from the population? Explain.
Unlock Deck
Unlock for access to all 57 flashcards in this deck.
Unlock Deck
k this deck
10
[Differentiate between dependent and independent samples] State whether the situation has dependent or independent samples. A researcher wants to know if reaction time is affected by body type of the vehicle being driven. He measures the reaction time of 40 drivers while they drive a compact car then he measures the reaction time while they drive an SUV.
Unlock Deck
Unlock for access to all 57 flashcards in this deck.
Unlock Deck
k this deck
11
How might the shapes of a population distribution and a sampling distribution look the same? How might they look different?
Unlock Deck
Unlock for access to all 57 flashcards in this deck.
Unlock Deck
k this deck
12
Use the following information to answer questions (11)-(13). According to the website www.costofwedding.com, the
average cost of catering a wedding (with an open bar) is $100 per person. Recently, in a random sample of 40
weddings in the U. S. it was found that the average catering cost was $110, with a standard deviation of $12. On the
basis of this, a 95% confidence interval for the mean catering cost for a wedding is $106 to $114.
Explain whether the confidence interval provides evidence that the mean catering cost of a wedding has increased. Be specific about the reasoning of using the confidence interval.
Unlock Deck
Unlock for access to all 57 flashcards in this deck.
Unlock Deck
k this deck
13
Unlock Deck
Unlock for access to all 57 flashcards in this deck.
Unlock Deck
k this deck
14
Use the following information to answer questions (11)-(13). According to the website www.costofwedding.com, the
average cost of catering a wedding (with an open bar) is $100 per person. Recently, in a random sample of 40
weddings in the U. S. it was found that the average catering cost was $110, with a standard deviation of $12. On the
basis of this, a 95% confidence interval for the mean catering cost for a wedding is $106 to $114.
Verify that the conditions for a valid confidence interval are met.
Unlock Deck
Unlock for access to all 57 flashcards in this deck.
Unlock Deck
k this deck
15
Use the following information to answer questions (1) - (4). A sprint duathlon consists of a 5 km run, a 20 km
bike ride, followed by another 5 km run. The mean finish time of all male participants in a recent large duathlon
was 1.54 hours with a standard deviation of 0.22 hours. The distribution of finish times for males is right-skewed.
Suppose that a sample of 30 randomly selected male participants is selected.
Is the number 1.54 a statistic or parameter? Explain.
Unlock Deck
Unlock for access to all 57 flashcards in this deck.
Unlock Deck
k this deck
16
Compare the normal distribution and the t- distribution. How are they similar? How are they different?
Unlock Deck
Unlock for access to all 57 flashcards in this deck.
Unlock Deck
k this deck
17
Describe the center and standard deviation of a sampling distribution.
Unlock Deck
Unlock for access to all 57 flashcards in this deck.
Unlock Deck
k this deck
18
The weights at birth of five randomly chosen baby hippopotamuses were 75, 99, 107, 82, and 63 pounds. Assume the distribution of weights is normally distributed. Find a 95% confidence interval for the mean weight of all baby hippopotamuses. Use technology for your calculations. Give the confidence interval in the form "estimate ± margin of error". Round to the nearest pound.
Unlock Deck
Unlock for access to all 57 flashcards in this deck.
Unlock Deck
k this deck
19
Use the following information to answer questions (1) - (4). A sprint duathlon consists of a 5 km run, a 20 km
bike ride, followed by another 5 km run. The mean finish time of all male participants in a recent large duathlon
was 1.54 hours with a standard deviation of 0.22 hours. The distribution of finish times for males is right-skewed.
Suppose that a sample of 30 randomly selected male participants is selected.
Suppose that the process of drawing samples of size 30 from the population of all male participants is repeated 100 times. If possible, sketch and describe what the sampling distribution of the means will look like and state the approximate mean value of the distribution. Round to the nearest thousandth.
Unlock Deck
Unlock for access to all 57 flashcards in this deck.
Unlock Deck
k this deck
20
Use the following information to answer questions (1) - (4). A sprint duathlon consists of a 5 km run, a 20 km
bike ride, followed by another 5 km run. The mean finish time of all male participants in a recent large duathlon
was 1.54 hours with a standard deviation of 0.22 hours. The distribution of finish times for males is right-skewed.
Suppose that a sample of 30 randomly selected male participants is selected.
Calculate the standard error for the mean finish time of 30 randomly selected male participants. Show all your work and round to the nearest thousandth.
Unlock Deck
Unlock for access to all 57 flashcards in this deck.
Unlock Deck
k this deck
21
A researcher wants to know whether athletic men are more flexible than non-athletic men. For this experiment, a man who exercised vigorously at least four times per week was considered "athletic". Flexibility is measured in inches on a sit & reach box. Test the researcher's claim using the following summary statistics:
Assume that all conditions for testing have been met. Report the test statistic and p-value. At the 5% significance level, state your decision regarding the null hypothesis and your conclusion about the original claim. Round all values to the nearest thousandth.
A) t = 3.270; p = 0.001 ; Fail to reject the null hypothesis; there is not strong evidence to suggest that athletic men are more flexible than non-athletic men.
B) t = 3.270; p = 0.001 ; Reject the null hypothesis; there is strong evidence to suggest that athletic men are more flexible than non-athletic men.
C) t = −3.270; p = 0.002 ; Reject the null hypothesis; there is strong evidence to suggest that athletic men are more flexible than non-athletic men.
D) t = −3.270; p = 0.002 ; Reject the null hypothesis; there is not strong evidence to suggest that athletic men are more flexible than non-athletic men.
Unlock Deck
Unlock for access to all 57 flashcards in this deck.
Unlock Deck
k this deck
22
Use the following information to answer questions (1) - (4). A sprint duathlon consists of a 5 km run, a 20 km
bike ride, followed by another 5 km run. The mean finish time of all participants in a recent large duathlon was
What is the standard error for the mean finish time of 30 randomly selected participants in the 40-44 age group? Round to the nearest thousandth.
A)0.046
B)0.300
C)0.250
D)0.055
bike ride, followed by another 5 km run. The mean finish time of all participants in a recent large duathlon was
What is the standard error for the mean finish time of 30 randomly selected participants in the 40-44 age group? Round to the nearest thousandth.
A)0.046
B)0.300
C)0.250
D)0.055
Unlock Deck
Unlock for access to all 57 flashcards in this deck.
Unlock Deck
k this deck
23
Use the following information to answer questions (1) - (5). Feature movie lengths (in hours) were measured for all movies shown in the past year in the U.S. The mean length of all feature length movies shown was 1.80 hours with a standard deviation of 0.15 hours. Suppose the length of a random sample of 20 movies was recorded from all movies released this year. The mean length of the feature length movies was found to be 1.72 hours with a standard
deviation of 0.18 hours.
Suppose we were to make a histogram of the feature length movie times of all movies in the past year. The histogram would be a display of which of the following?
A)population distribution
B)distribution of a sample
C)sampling distribution of means
D)Normal distribution
deviation of 0.18 hours.
Suppose we were to make a histogram of the feature length movie times of all movies in the past year. The histogram would be a display of which of the following?
A)population distribution
B)distribution of a sample
C)sampling distribution of means
D)Normal distribution
Unlock Deck
Unlock for access to all 57 flashcards in this deck.
Unlock Deck
k this deck
24
Use the following information to answer questions (1) - (4). A sprint duathlon consists of a 5 km run, a 20 km
bike ride, followed by another 5 km run. The mean finish time of all participants in a recent large duathlon was
Suppose we were to make a histogram of the finishing times of the 30 participants in the 40-44 age group. Would the histogram be a display of the population distribution, the distribution of a sample, or the sampling distribution of means?
A)population distribution
B)distribution of a sample
C)sampling distribution of means
D)normal distribution
Unlock Deck
Unlock for access to all 57 flashcards in this deck.
Unlock Deck
k this deck
25
The weight of King Salmon from Lake Michigan and Lake Superior are measured. Researchers want to know whether Lake Michigan King Salmon weigh less than those from Lake Superior. The samples
A)are dependent
B)are independent
C)follow a normal distribution
D)are not a type that can be determined
A)are dependent
B)are independent
C)follow a normal distribution
D)are not a type that can be determined
Unlock Deck
Unlock for access to all 57 flashcards in this deck.
Unlock Deck
k this deck
26
Use the following information to answer questions (11)-(13). According to the website www.costofwedding.com,
the average cost of flowers for a wedding is $698. Recently, in a random sample of 40 weddings in the U. S. it
was found that the average cost of the flowers was $734, with a standard deviation of $102. On the basis of this, a
95% confidence interval for the mean cost of flowers for a wedding is $701 to $767.
For this description, which of the following does not describe a condition for a valid confidence interval?
A)The description states that the sample was randomly selected, so we can assume that the condition which states that the data must represent a random sample is satisfied.
B)The sample observations are independent because knowledge about the cost of flowers for any one wedding tells us nothing about the cost of flowers for any other wedding in the sample.
C)The sample size of 40 is large enough that knowledge about the population distribution is not necessary and the condition that the population be normally distributed or sample size be
Larger than 25 is satisfied.
D)All of the above describe conditions for a valid confidence interval.
Unlock Deck
Unlock for access to all 57 flashcards in this deck.
Unlock Deck
k this deck
27
Use the following information to answer questions (1) - (4). A sprint duathlon consists of a 5 km run, a 20 km
bike ride, followed by another 5 km run. The mean finish time of all participants in a recent large duathlon was
Suppose the process of taking random samples of size 30 from the 40-44 age group is repeated 200 times and a histogram of the 200 sample means is created. Which statement best describes the shape of the histogram?
A)The histogram will be roughly symmetrical.
B)The histogram will be unimodal.
C)The histogram will be roughly bell-shaped.
D)All of the above statements are true.
Unlock Deck
Unlock for access to all 57 flashcards in this deck.
Unlock Deck
k this deck
28
The productivity of manufacturing plant workers is compared before and after the installation of air conditioning. The samples
A)are dependent
B)are independent
C)follow a normal distribution
D)are not a type that can be determined
A)are dependent
B)are independent
C)follow a normal distribution
D)are not a type that can be determined
Unlock Deck
Unlock for access to all 57 flashcards in this deck.
Unlock Deck
k this deck
29
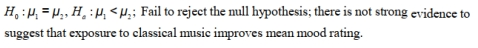
A researcher wants to know if mood is affected by music. She conducts a test on a sample of 4 randomly selected adults and measures mood rating before and after being exposed to classic rock music. Test the hypothesis that mood rating decreased after being exposed to classic rock music. Following are the mood ratings for the four participants:
Assume that all conditions for testing have been met. Report the null and alternative hypothesis and P- value. At the 5% significance level, state your decision regarding the null hypothesis and your conclusion about the original claim. Round all values to the nearest thousandth.
A)
B)
C)
D)
Assume that all conditions for testing have been met. Report the null and alternative hypothesis and P- value. At the 5% significance level, state your decision regarding the null hypothesis and your conclusion about the original claim. Round all values to the nearest thousandth.
A)
B)
C)
D)
Unlock Deck
Unlock for access to all 57 flashcards in this deck.
Unlock Deck
k this deck
30
An economist conducted a hypothesis test to test the claim that the average cost of eating a meal away from home decreased from 2012 to 2013. The average cost of eating a meal away from home in 2012 was $7.15 per person per meal. Assume that all conditions for testing have been met. He used technology to complete the hypothesis test. Following is his null and alternative hypothesis and the output from his graphing calculator.
Choose the statement that contains the correct conclusion regarding the hypothesis and the original claim.
A) Reject the null hypothesis; there is sufficient evidence to support the claim that the average cost of eating away from home has decreased since 2012.
B) Reject the null hypothesis; there is not sufficient evidence to support the claim that the average cost of eating away from home has decreased since 2012.
C) Fail to reject the null hypothesis; there is sufficient evidence to support the claim that the average cost of eating away from home has decreased since 2012.
D) Fail to reject the null hypothesis; there is not sufficient evidence to support the claim that the average cost of eating away from home has decreased since 2012
Unlock Deck
Unlock for access to all 57 flashcards in this deck.
Unlock Deck
k this deck
31
Use the following information to answer questions (11)-(13). According to the website www.costofwedding.com,
the average cost of flowers for a wedding is $698. Recently, in a random sample of 40 weddings in the U. S. it
was found that the average cost of the flowers was $734, with a standard deviation of $102. On the basis of this, a
95% confidence interval for the mean cost of flowers for a wedding is $701 to $767.
Which of the following statements is true about the t-distribution?
A)For small sample sizes, the t-distribution has the same properties of the normal curve.
B)For large sample sizes, the t-distribution has the same properties of the normal curve.
C)Like the Normal distribution, the t-distribution is symmetric for small n.
D)Since population standard deviation is usually unknown, the standard error uses the sample standard deviation to estimate population standard deviation.
Unlock Deck
Unlock for access to all 57 flashcards in this deck.
Unlock Deck
k this deck
32
Choose the statement that best describes what is meant when we say that the sample mean is unbiased when estimating the population mean.
A)The sample mean will always equal the population mean.
B)The standard deviation of the sampling distribution (also called the standard error) and the population standard deviation are equal.
C)On average, the sample mean is the same as the population mean.
D)We cannot say that the sample mean is unbiased.
Unlock Deck
Unlock for access to all 57 flashcards in this deck.
Unlock Deck
k this deck
33
Which of the following is a true statement about the Central Limit Theorem for sample means?
A)If the sample size is large, it doesn't matter what the distribution of the population it was drawn from is, the normal distribution can still be used to perform statistical inference.
B)If conditions are met, the mean of the sampling distribution is equal to the population mean.
C)The Central Limit Theorem helps us find probabilities for sample means when those means are based on a random sample from a population.
D)All of the statements are true about the Central Limit Theorem for sample means.
Unlock Deck
Unlock for access to all 57 flashcards in this deck.
Unlock Deck
k this deck
34
Choose the statement that describes a situation where a confidence interval and a hypothesis test will yield the same results.
A)Both (c) and (d) below.
B)Neither (c) nor (d).The confidence interval cannot yield results that are the same as the hypothesis test.
C)When the null hypothesis contains a population parameter that is equal to zero.
D)When the alternative hypothesis is two-tailed.
A)Both (c) and (d) below.
B)Neither (c) nor (d).The confidence interval cannot yield results that are the same as the hypothesis test.
C)When the null hypothesis contains a population parameter that is equal to zero.
D)When the alternative hypothesis is two-tailed.
Unlock Deck
Unlock for access to all 57 flashcards in this deck.
Unlock Deck
k this deck
35
[Objective: Find a confidence interval for sample mean] The weights at birth of five randomly chosen baby Orca whales were 425,454,380,405, and 426 pounds. Assume the distribution of weights is normally distributed. Find a 95% confidence interval for the mean weight of all baby Orca whales. Use technology for your calculations. Give the confidence interval in the form "estimate margin of error". Round to the nearest tenth of a pound.
A)
B)
C)
D)
margin of error". Round to the nearest tenth of a pound.A)
B)
C)
D)
Unlock Deck
Unlock for access to all 57 flashcards in this deck.
Unlock Deck
k this deck
36
When the mean of the sampling distribution is the same value as the population parameter, we can say that the statistic is
A)a representation of an unbiased parameter.
B)the standard error.
C)an unbiased estimator.
D)unlimited.
A)a representation of an unbiased parameter.
B)the standard error.
C)an unbiased estimator.
D)unlimited.
Unlock Deck
Unlock for access to all 57 flashcards in this deck.
Unlock Deck
k this deck
37
What is the approximate z-value with interpretation for the probability that the average Systolic blood pressure will be less than 122 mmHg? Round to the nearest hundredth.
A)z = -3.00 which is less than or equal to 3 standard deviations which is not a significant result.
B)z = -3.00 which is less than or equal to 3 standard deviations which is a significant result.
C)z = 3.00 which is greater than or equal to 3 standard deviations which is a significant result.
D)This probability cannot be determined because we do not know the distribution of the population.
Unlock Deck
Unlock for access to all 57 flashcards in this deck.
Unlock Deck
k this deck
38
What is the approximate z score with interpretation that the average Systolic blood pressure will be greater than 128 mmHg? Round to the nearest thousandth.
A)The probability for z = 3.00 or greater is greater than or equal to 3 standard deviations which is a significant result.
B)The probability for z = -3.00 or greater than or equal to 3 standard deviations which is not a significant result.
C)The probability for z = -3.00 or less is less than or equal to 3 standard deviations which is a significant result.
D)None of the above statements are correct.
Unlock Deck
Unlock for access to all 57 flashcards in this deck.
Unlock Deck
k this deck
39
Use the following information to answer questions (1) - (5). Feature movie lengths (in hours) were measured for all movies shown in the past year in the U.S. The mean length of all feature length movies shown was 1.80 hours with a standard deviation of 0.15 hours. Suppose the length of a random sample of 20 movies was recorded from all movies released this year. The mean length of the feature length movies was found to be 1.72 hours with a standard
deviation of 0.18 hours.
Suppose the process of taking random samples of size 20 is repeated 200 times and a histogram of the 200 sample means is created. The histogram would be a display of which of the following?
A)population distribution
B)distribution of a sample
C)sampling distribution of means
D)normal distribution
Unlock Deck
Unlock for access to all 57 flashcards in this deck.
Unlock Deck
k this deck
40
Use the following information to answer questions (1) - (5). Feature movie lengths (in hours) were measured for all movies shown in the past year in the U.S. The mean length of all feature length movies shown was 1.80 hours with a standard deviation of 0.15 hours. Suppose the length of a random sample of 20 movies was recorded from all movies released this year. The mean length of the feature length movies was found to be 1.72 hours with a standard
deviation of 0.18 hours.
In this example, the numerical values of 1.80 hours and 0.15 hours are .
deviation of 0.18 hours.
In this example, the numerical values of 1.80 hours and 0.15 hours are .
Unlock Deck
Unlock for access to all 57 flashcards in this deck.
Unlock Deck
k this deck
41
Choose the statement that best describes what is meant when we say that the sample mean is unbiased when estimating the population mean.
A)The sample mean will always equal the population mean.
B)On average, the sample mean is the same as the population mean.
C)The standard deviation of the sampling distribution (also called the standard error) and the population standard deviation are equal.
D)We cannot say that the sample mean is unbiased.
Unlock Deck
Unlock for access to all 57 flashcards in this deck.
Unlock Deck
k this deck
42
A)
B)
C)
D)
Unlock Deck
Unlock for access to all 57 flashcards in this deck.
Unlock Deck
k this deck
43
Use the following information to answer questions (12)-(15). Many couples believe that it is getting too expensive to host an "average" wedding in the United States. According to a statistics study in the U.S., the average cost of a wedding in the U.S. in 2014 was $25,200. Recently, in a random sample of 35 weddings in the U.S. it was found that the average cost of a wedding was $24,224 with a standard deviation of $2,210.
a. Find the critical z value for the given level of confidence and multiply by the standard error using the formula
b. Find the critical t value for the given level of confidence and multiply by the standard error using the formula
c. Find the critical z value for the given level of confidence and multiply by the standard error using the formula
d. Find the critical t value for the given level of confidence and multiply by the standard error using the formula
a. Find the critical z value for the given level of confidence and multiply by the standard error using the formula
b. Find the critical t value for the given level of confidence and multiply by the standard error using the formula
c. Find the critical z value for the given level of confidence and multiply by the standard error using the formula
d. Find the critical t value for the given level of confidence and multiply by the standard error using the formula
Unlock Deck
Unlock for access to all 57 flashcards in this deck.
Unlock Deck
k this deck
44
Use the following information to answer questions (12)-(15). Many couples believe that it is getting too expensive to host an "average" wedding in the United States. According to a statistics study in the U.S., the average cost of a wedding in the U.S. in 2014 was $25,200. Recently, in a random sample of 35 weddings in the U.S. it was found that the average cost of a wedding was $24,224 with a standard deviation of $2,210.
Which is the best interpretation of a 95% confidence interval for the sample mean.?
A)The 95% confidence interval means that we are 95% confident that the sample mean is between the low and high interval values.
B)The 95% confidence interval means that there is a 95% probability that the population mean is between the low and high interval values.
C)The 95% confidence interval means that we are 95% confident that the population mean is between the low and high interval values.
D)The 95% confidence interval means that there is a 95% probability that the sample mean is between the low and high interval values.
Unlock Deck
Unlock for access to all 57 flashcards in this deck.
Unlock Deck
k this deck
45
[Objective: Understand the hypothesis test of the mean] Suppose a consumer product researcher wanted to find out whether a Sharpie lasted longer than the manufacturer's claim that their Sharpies could write continuously for a mean of 14 hours. The researcher tested 40 Sharpie's and recorded the number of continuous hours each Sharpie wrote before drying up. Test the hypothesis that Sharpies can write for more than a mean of 14 continuous hours. Following are the summary statistics: =14.5 hours, s=1.2 hours
At the 5% significance level, t=2.635 ; p=0.006. State your conclusion about the original claim.
A) Do not reject the null hypothesis; there is not strong enough evidence to suggest that the Sharpies last longer than a mean of 14 hours.
B) Reject the alternative hypothesis; there is strong evidence to suggest that the Sharpies last longer than a mean of 14 hours.
C) Reject the null hypothesis; there is strong evidence to suggest that the Sharpies last longer than a mean of 14 hours.
D) There needs to be more data to determine if the Sharpies last longer than a mean of 14 hours.
=14.5 hours, s=1.2 hoursAt the 5% significance level, t=2.635 ; p=0.006. State your conclusion about the original claim.
A) Do not reject the null hypothesis; there is not strong enough evidence to suggest that the Sharpies last longer than a mean of 14 hours.
B) Reject the alternative hypothesis; there is strong evidence to suggest that the Sharpies last longer than a mean of 14 hours.
C) Reject the null hypothesis; there is strong evidence to suggest that the Sharpies last longer than a mean of 14 hours.
D) There needs to be more data to determine if the Sharpies last longer than a mean of 14 hours.
Unlock Deck
Unlock for access to all 57 flashcards in this deck.
Unlock Deck
k this deck
46
Which of the following statements is true about the t-distribution?
A)For small sample sizes, the t-distribution has the same properties as the normal curve.
B)For large sample sizes, the t-distribution has the same properties as the normal curve.
C)Like the Normal distribution, the t-distribution is symmetric for small n.
D)Since population standard deviation is usually unknown, the standard error uses the sample standard deviation to estimate population standard deviation.
Unlock Deck
Unlock for access to all 57 flashcards in this deck.
Unlock Deck
k this deck
47
The reading level of a random sample of men and a random sample of women is measured. Researchers want to know whether women typically read at a higher level than men. The samples
A)are dependent
B)are independent
C)follow a normal distribution
D)are not a type that can be determined
A)are dependent
B)are independent
C)follow a normal distribution
D)are not a type that can be determined
Unlock Deck
Unlock for access to all 57 flashcards in this deck.
Unlock Deck
k this deck
48
Use the following information to answer questions (8) - (10). Suppose that the mean Systolic blood pressure for
adults age 50-54 is 125 mmHg with a standard deviation of 5 mmHg. It is known that Systolic blood pressure is not
Normally distributed. Suppose a sample of 25 adult Systolic blood pressure measurements is taken from the
population.
What is the approximate probability with interpretation that the average diastolic blood pressure will be less than 122 mmHg, given the above information? Round to the nearest thousandth.
A)The probability for z = 3.00 or less is less than or equal to 3 standard deviations which is not a significant result.
B)The probability for z = -3.00 or less is less than or equal to 3 standard deviations which is a significant result, using an approximation of 0.5 of (1 - 99.7%) = 0.0015.
C)The probability for z = -3.00 or less is less than or equal to 3 standard deviations which is a significant result, using an approximation of 2*(1 - 99.7%) = 0.0060.
D)None of the above statements are correct.
Unlock Deck
Unlock for access to all 57 flashcards in this deck.
Unlock Deck
k this deck
49
Use the following information to answer questions (12)-(15). Many couples believe that it is getting too expensive to host an "average" wedding in the United States. According to a statistics study in the U.S., the average cost of a wedding in the U.S. in 2014 was $25,200. Recently, in a random sample of 35 weddings in the U.S. it was found that the average cost of a wedding was $24,224 with a standard deviation of $2,210.
If a 95% confidence interval for the mean for the wedding sample is ($23465, $24983), does this mean that the sample results are significantly different from the claimed value for the mean of $25,200?
A)Since the claimed population mean is outside of the 95% confidence interval, we conclude that the sample results are significantly different.
B)Since the claimed population mean is outside of the 95% confidence interval, we conclude that there is a 95% chance that the sample results are significantly different.
C)Since the accepted population average is outside of the 95% confidence interval, we conclude that there is a 5% chance that the sample results are significantly different.
D)Since the accepted population average is outside of the 95% confidence interval, we conclude that the sample results are not significantly different.
Unlock Deck
Unlock for access to all 57 flashcards in this deck.
Unlock Deck
k this deck
50
Use the following information to answer questions (1) - (5). Feature movie lengths (in hours) were measured for all movies shown in the past year in the U.S. The mean length of all feature length movies shown was 1.80 hours with a standard deviation of 0.15 hours. Suppose the length of a random sample of 20 movies was recorded from all movies released this year. The mean length of the feature length movies was found to be 1.72 hours with a standard
deviation of 0.18 hours.
What is the standard error for the estimated mean feature length movie time of the 20 randomly selected movies? Round to the nearest thousandth.
A)0.356
B)0.040
C)0.055
D)0.034
deviation of 0.18 hours.
What is the standard error for the estimated mean feature length movie time of the 20 randomly selected movies? Round to the nearest thousandth.
A)0.356
B)0.040
C)0.055
D)0.034
Unlock Deck
Unlock for access to all 57 flashcards in this deck.
Unlock Deck
k this deck
51
Use the following information to answer questions (8) - (10). Suppose that the mean Systolic blood pressure for
adults age 50-54 is 125 mmHg with a standard deviation of 5 mmHg. It is known that Systolic blood pressure is not
Normally distributed. Suppose a sample of 25 adult Systolic blood pressure measurements is taken from the
population.
What is the approximate standard error for the sampling distribution of mean blood pressures? Round to the nearest hundredth.
A)0.20
B)17.00
C)5.00
D)1.00
Unlock Deck
Unlock for access to all 57 flashcards in this deck.
Unlock Deck
k this deck
52
Use the following information to answer questions (12)-(15). Many couples believe that it is getting too expensive to host an "average" wedding in the United States. According to a statistics study in the U.S., the average cost of a wedding in the U.S. in 2014 was $25,200. Recently, in a random sample of 35 weddings in the U.S. it was found that the average cost of a wedding was $24,224 with a standard deviation of $2,210.
For this description, which of the following does not describe a required condition for a valid confidence interval based on the sample results?
A)The description states that the sample was randomly selected, so we can assume that the condition which states that the data must represent a random sample is satisfied.
B)The sample observations are independent because knowledge about the cost of any one wedding tells us nothing about the cost of any other wedding in the sample.
C)The sample distribution must be normally distributed in order to have a valid confidence interval. The problem does not describe the distribution of the sample, so this condition is not met.
D)The sample size of 35 is large enough that knowledge about the population distribution is not necessary and the condition that the population be normally distributed or sample size be
Larger than 25 is satisfied.
Unlock Deck
Unlock for access to all 57 flashcards in this deck.
Unlock Deck
k this deck
53
Choose the statement that describes a situation where a confidence interval and a hypothesis test would yield the same results.
A)When the null hypothesis contains a population parameter that is equal to zero.
B)When the alternative hypothesis is two-tailed.
C)Both (a) and (b)
D)Neither (a) nor (b).The confidence interval cannot yield results that are the same as the hypothesis test.
A)When the null hypothesis contains a population parameter that is equal to zero.
B)When the alternative hypothesis is two-tailed.
C)Both (a) and (b)
D)Neither (a) nor (b).The confidence interval cannot yield results that are the same as the hypothesis test.
Unlock Deck
Unlock for access to all 57 flashcards in this deck.
Unlock Deck
k this deck
54
Use the following information to answer questions (8) - (10). Suppose that the mean Systolic blood pressure for
adults age 50-54 is 125 mmHg with a standard deviation of 5 mmHg. It is known that Systolic blood pressure is not
Normally distributed. Suppose a sample of 25 adult Systolic blood pressure measurements is taken from the
population.
What is the interpretation of the z score used to find the probability that the average Systolic blood pressure will be less than 122 mmHg? Assume technology is not available and so the values must first be converted to standard units. Round to the nearest hundredth.
A)z = -3.00 which is less than or equal to 3 standard deviations above the mean.
B)z = -3.00 which is less than or equal to 3 standard deviations below the mean.
C)z = 3.00 which is less than or equal to 3 standard deviations above the mean.
D)This probability cannot be determined because we do not know the distribution of the population.
Unlock Deck
Unlock for access to all 57 flashcards in this deck.
Unlock Deck
k this deck
55
Which of the following is a true statement about the Central Limit Theorem for sample means?
A)The Normal distribution is a good approximation to the sampling distribution.
B)If conditions are met, the mean of the sampling distribution is equal to the population mean.
C)The Central Limit Theorem helps us find probabilities for sample means when those means are based on a random sample from a population.
D)All of the following statements are true about the Central Limit Theorem for sample means.
Unlock Deck
Unlock for access to all 57 flashcards in this deck.
Unlock Deck
k this deck
56
Use the following information to answer questions (1) - (5). Feature movie lengths (in hours) were measured for all movies shown in the past year in the U.S. The mean length of all feature length movies shown was 1.80 hours with a standard deviation of 0.15 hours. Suppose the length of a random sample of 20 movies was recorded from all movies released this year. The mean length of the feature length movies was found to be 1.72 hours with a standard
deviation of 0.18 hours.
If we create a sampling distribution of sample means, what would be the mean and standard deviation of that distribution given the sample size of 20?
A)The mean length would be 1.80 hours with a standard deviation of 0.18 hours.
B)The mean length would be 1.80 hours with a standard deviation of 0.15 hours.
C)The mean length would be 1.72 hours with a standard deviation of 0.18 hours.
D)The mean length would be 1.80 hours with a standard deviation of 0.034 hours.
Unlock Deck
Unlock for access to all 57 flashcards in this deck.
Unlock Deck
k this deck
57
[Objective: Conduct a hypothesis test on two independent samples] A researcher wants to know whether athletic women are more flexible than non-athletic women. For this experiment, a woman who exercised vigorously at least four times per week was considered "athletic". Flexibility is measured in inches on a sit & reach box. A researcher tested his claim using the following summary statistics:
Assume that all conditions for testing have been met.
; At the 1% significance level, state your decision regarding the null hypothesis and your conclusion about the original claim.
A) Fail to reject the null hypothesis; there is not strong enough evidence to suggest that athletic women are more flexible, on average, than non-athletic women.
B) Reject the null hypothesis; there is strong evidence to suggest that athletic women are more flexible, on average, than non-athletic women.
C) Reject the null hypothesis; there is strong evidence to suggest that non-athletic women are more flexible, on average, than athletic women.
D) Fail to reject the null hypothesis; there is strong evidence to suggest that non-athletic women are more flexible, on average, than athletic women.
Unlock Deck
Unlock for access to all 57 flashcards in this deck.
Unlock Deck
k this deck
Unlock Deck
Unlock for access to all 57 flashcards in this deck.


