Deck 8: Hypothesis Testing for Population Proportions
Full screen (f)
Question
Question
Question
Question
Question
Question
Question
The alternative hypothesis is a right-tailed with a z-score = 0.21 
Question
Question
Question
Question
Question
Question
Question
Question
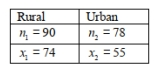
A sociologist believes that families that eat at least one meal a day together (without the interference of any other media) will have better communication skills. The sociologist conducts a study to see if there is a difference in the proportion of meals that are eaten together as a family for families living in a rural setting compared to families living in an urban setting.She collects a random sample from each population and records the proportion of test subjects that reported that they had eaten at least 3 meals per week together as a family. The data are summarized in the table below. Assume the all conditions for proceeding with a two-sample test have been met. 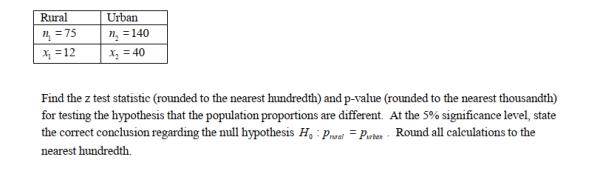
Question
Question
The alternative hypothesis is a two-tailed with a z-score = −1.88 
Question
Question
Two different students conduct a coin flipping experiment with a left- tailed alternative. They obtain the following test statistics:  Which of the test statistics has a smaller p-value and why?
Which of the test statistics has a smaller p-value and why? Question
Question
Which of the following is not one of the components of a hypothesis test?
A)State the null and alternative hypothesis about the population parameter.
B)Make a decision to either accept the null hypothesis or accept the alternative hypothesis.
C)State the level of significance, choose a test, and check the conditions for the test.
D)Calculate the test statistic and the p-value.
Question
[Objective: Understand the p-value] From the TI-84 graphing calculator screenshots below, there are specific shaded areas that represent p-values.
Choose the statement that best describes the interpretation of these p-values.
A)![<strong>[Objective: Understand the p-value] From the TI-84 graphing calculator screenshots below, there are specific shaded areas that represent p-values. Choose the statement that best describes the interpretation of these p-values.</strong> A) B) C) <div style=padding-top: 35px>](https://d2lvgg3v3hfg70.cloudfront.net/TB34225555/11ec8f01_4f1c_816b_aaa3_471bc062f7f1_TB34225555_11.jpg)
B)![<strong>[Objective: Understand the p-value] From the TI-84 graphing calculator screenshots below, there are specific shaded areas that represent p-values. Choose the statement that best describes the interpretation of these p-values.</strong> A) B) C) <div style=padding-top: 35px>](https://d2lvgg3v3hfg70.cloudfront.net/TB34225555/11ec8f01_4f1f_b5bc_aaa3_599db724b88d_TB34225555_11.jpg)
C)![<strong>[Objective: Understand the p-value] From the TI-84 graphing calculator screenshots below, there are specific shaded areas that represent p-values. Choose the statement that best describes the interpretation of these p-values.</strong> A) B) C) <div style=padding-top: 35px>](https://d2lvgg3v3hfg70.cloudfront.net/TB34225555/11ec8f01_4f21_8a7d_aaa3_e32656bfa749_TB34225555_11.jpg)
Choose the statement that best describes the interpretation of these p-values.
A)
B)
C)
Question
Question
Question
Read the following problem description then choose the correct null and alternative hypothesis. A new drug is being tested to see whether it can reduce the diastolic blood pressure measurement for adults age 45-60 years. The upper limit for diastolic blood pressure measurement should be 90 mmHg.
A)
B)
C)
D)
A)
B)
C)
D)
Question
[Objective: Test a hypothesis for a population proportion] Suppose a city official conducts a hypothesis test to test the claim that the majority of voters support a proposed tax to build sidewalks. Assume that all the conditions for proceeding with a one-sample test on proportions have been met. The calculated test statistic is approximately 1.40 with an associated p-value of approximately 0.081. Choose the conclusion that provides the best interpretation for the p-value at a significance level of ![<strong>[Objective: Test a hypothesis for a population proportion] Suppose a city official conducts a hypothesis test to test the claim that the majority of voters support a proposed tax to build sidewalks. Assume that all the conditions for proceeding with a one-sample test on proportions have been met. The calculated test statistic is approximately 1.40 with an associated p-value of approximately 0.081. Choose the conclusion that provides the best interpretation for the p-value at a significance level of </strong> A) If the null hypothesis is true, then the probability of getting a test statistic that is as extreme or more extreme than the calculated test statistic of 1.40 is 0.081. This result is surprising and could not easily happen by chance. B) If the null hypothesis is true, then the probability of getting a test statistic as large or larger than 1.40 is 0.081. This result is not surprising and could easily happen by chance. C) The p-value should be considered extreme; therefore the hypothesis test proves that the null hypothesis is true. D) If the null hypothesis is true, then the probability of getting a test statistic that is as extreme or more extreme than the calculated test statistic of 1.40 is 0.081. The result should be doubled for a two-sided test. This result is not surprising and easily happen by chance. <div style=padding-top: 35px>](https://d2lvgg3v3hfg70.cloudfront.net/TB34225555/11ec8f03_4344_aacc_aaa3_49240bdfad65_TB34225555_11.jpg)
A) If the null hypothesis is true, then the probability of getting a test statistic that is as extreme or more extreme than the calculated test statistic of 1.40 is 0.081. This result is surprising and could not easily happen by chance.
B) If the null hypothesis is true, then the probability of getting a test statistic as large or larger than 1.40 is 0.081. This result is not surprising and could easily happen by chance.
C) The p-value should be considered extreme; therefore the hypothesis test proves that the null hypothesis is true.
D) If the null hypothesis is true, then the probability of getting a test statistic that is as extreme or more extreme than the calculated test statistic of 1.40 is 0.081. The result should be doubled for a two-sided test. This result is not surprising and easily happen by chance.
Question
Question
Question
Question
[Objective: Understand the components of hypothesis testing] Read the following problem description then choose the correct null and alternative hypothesis: A new drug is being tested to see whether it can reduce the rate of food-related allergic reactions in children ages 1 to 3 with food allergies. The rate of allergic reactions in the population of concern is 0.03 .
A)![<strong>[Objective: Understand the components of hypothesis testing] Read the following problem description then choose the correct null and alternative hypothesis: A new drug is being tested to see whether it can reduce the rate of food-related allergic reactions in children ages 1 to 3 with food allergies. The rate of allergic reactions in the population of concern is 0.03 .</strong> A) B) C) D) Use the following information to answer questions (3) - (5). A janitor at a large office building believes that his supply of light bulbs has a defect rate that is higher than the defect rate stated by the manufacturer. The janitor's null hypothesis is that the supply of light bulbs has a manufacturer's defect rate of p=0.09. He performs a test at a significance level of 0.01. The null and alternative hypothesis are as follows: <div style=padding-top: 35px>](https://d2lvgg3v3hfg70.cloudfront.net/TB34225555/11ec8f00_0e6a_ba26_aaa3_93af2f49d6e4_TB34225555_11.jpg)
B)![<strong>[Objective: Understand the components of hypothesis testing] Read the following problem description then choose the correct null and alternative hypothesis: A new drug is being tested to see whether it can reduce the rate of food-related allergic reactions in children ages 1 to 3 with food allergies. The rate of allergic reactions in the population of concern is 0.03 .</strong> A) B) C) D) Use the following information to answer questions (3) - (5). A janitor at a large office building believes that his supply of light bulbs has a defect rate that is higher than the defect rate stated by the manufacturer. The janitor's null hypothesis is that the supply of light bulbs has a manufacturer's defect rate of p=0.09. He performs a test at a significance level of 0.01. The null and alternative hypothesis are as follows: <div style=padding-top: 35px>](https://d2lvgg3v3hfg70.cloudfront.net/TB34225555/11ec8f00_0e6c_19b7_aaa3_15b469888b5d_TB34225555_11.jpg)
C)![<strong>[Objective: Understand the components of hypothesis testing] Read the following problem description then choose the correct null and alternative hypothesis: A new drug is being tested to see whether it can reduce the rate of food-related allergic reactions in children ages 1 to 3 with food allergies. The rate of allergic reactions in the population of concern is 0.03 .</strong> A) B) C) D) Use the following information to answer questions (3) - (5). A janitor at a large office building believes that his supply of light bulbs has a defect rate that is higher than the defect rate stated by the manufacturer. The janitor's null hypothesis is that the supply of light bulbs has a manufacturer's defect rate of p=0.09. He performs a test at a significance level of 0.01. The null and alternative hypothesis are as follows: <div style=padding-top: 35px>](https://d2lvgg3v3hfg70.cloudfront.net/TB34225555/11ec8f00_0e6c_b5f8_aaa3_ef7df5b39636_TB34225555_11.jpg)
D)![<strong>[Objective: Understand the components of hypothesis testing] Read the following problem description then choose the correct null and alternative hypothesis: A new drug is being tested to see whether it can reduce the rate of food-related allergic reactions in children ages 1 to 3 with food allergies. The rate of allergic reactions in the population of concern is 0.03 .</strong> A) B) C) D) Use the following information to answer questions (3) - (5). A janitor at a large office building believes that his supply of light bulbs has a defect rate that is higher than the defect rate stated by the manufacturer. The janitor's null hypothesis is that the supply of light bulbs has a manufacturer's defect rate of p=0.09. He performs a test at a significance level of 0.01. The null and alternative hypothesis are as follows: <div style=padding-top: 35px>](https://d2lvgg3v3hfg70.cloudfront.net/TB34225555/11ec8f00_0e6d_7949_aaa3_dd6287d92775_TB34225555_11.jpg)
Use the following information to answer questions (3) - (5). A janitor at a large office building believes that his supply of light bulbs has a defect rate that is higher than the defect rate stated by the manufacturer. The janitor's null hypothesis is that the supply of light bulbs has a manufacturer's defect rate of p=0.09. He performs a test at a significance level of 0.01. The null and alternative hypothesis are as follows:![<strong>[Objective: Understand the components of hypothesis testing] Read the following problem description then choose the correct null and alternative hypothesis: A new drug is being tested to see whether it can reduce the rate of food-related allergic reactions in children ages 1 to 3 with food allergies. The rate of allergic reactions in the population of concern is 0.03 .</strong> A) B) C) D) Use the following information to answer questions (3) - (5). A janitor at a large office building believes that his supply of light bulbs has a defect rate that is higher than the defect rate stated by the manufacturer. The janitor's null hypothesis is that the supply of light bulbs has a manufacturer's defect rate of p=0.09. He performs a test at a significance level of 0.01. The null and alternative hypothesis are as follows: <div style=padding-top: 35px>](https://d2lvgg3v3hfg70.cloudfront.net/TB34225555/11ec8f00_292c_65ca_aaa3_93a25d444af4_TB34225555_11.jpg)
A)
B)
C)
D)
Use the following information to answer questions (3) - (5). A janitor at a large office building believes that his supply of light bulbs has a defect rate that is higher than the defect rate stated by the manufacturer. The janitor's null hypothesis is that the supply of light bulbs has a manufacturer's defect rate of p=0.09. He performs a test at a significance level of 0.01. The null and alternative hypothesis are as follows:
Question
[Objective: Calculate the observed value of the z-statistic from sample data] Suppose that the following is to be tested: ![<strong>[Objective: Calculate the observed value of the z-statistic from sample data] Suppose that the following is to be tested: and Calculate the observed z-statistic for the following sample data: Sixty-eight out of ninety test subjects have the characteristic of interest. Round to the nearest thousandth.</strong> A) B) C) D) <div style=padding-top: 35px>](https://d2lvgg3v3hfg70.cloudfront.net/TB34225555/11ec8f02_cd4b_1936_aaa3_7fd6cbf27c46_TB34225555_11.jpg) and
and ![<strong>[Objective: Calculate the observed value of the z-statistic from sample data] Suppose that the following is to be tested: and Calculate the observed z-statistic for the following sample data: Sixty-eight out of ninety test subjects have the characteristic of interest. Round to the nearest thousandth.</strong> A) B) C) D) <div style=padding-top: 35px>](https://d2lvgg3v3hfg70.cloudfront.net/TB34225555/11ec8f02_cd4c_9fd7_aaa3_3355e9ebdbbf_TB34225555_11.jpg) Calculate the observed z-statistic for the following sample data: Sixty-eight out of ninety test subjects have the characteristic of interest. Round to the nearest thousandth.
Calculate the observed z-statistic for the following sample data: Sixty-eight out of ninety test subjects have the characteristic of interest. Round to the nearest thousandth.
A)![<strong>[Objective: Calculate the observed value of the z-statistic from sample data] Suppose that the following is to be tested: and Calculate the observed z-statistic for the following sample data: Sixty-eight out of ninety test subjects have the characteristic of interest. Round to the nearest thousandth.</strong> A) B) C) D) <div style=padding-top: 35px>](https://d2lvgg3v3hfg70.cloudfront.net/TB34225555/11ec8f02_cd4d_1508_aaa3_19c2ee00c814_TB34225555_11.jpg)
B)![<strong>[Objective: Calculate the observed value of the z-statistic from sample data] Suppose that the following is to be tested: and Calculate the observed z-statistic for the following sample data: Sixty-eight out of ninety test subjects have the characteristic of interest. Round to the nearest thousandth.</strong> A) B) C) D) <div style=padding-top: 35px>](https://d2lvgg3v3hfg70.cloudfront.net/TB34225555/11ec8f02_cd4d_8a39_aaa3_c73df6e0b206_TB34225555_11.jpg)
C)![<strong>[Objective: Calculate the observed value of the z-statistic from sample data] Suppose that the following is to be tested: and Calculate the observed z-statistic for the following sample data: Sixty-eight out of ninety test subjects have the characteristic of interest. Round to the nearest thousandth.</strong> A) B) C) D) <div style=padding-top: 35px>](https://d2lvgg3v3hfg70.cloudfront.net/TB34225555/11ec8f02_cd4d_d85a_aaa3_35910ac535ac_TB34225555_11.jpg)
D)![<strong>[Objective: Calculate the observed value of the z-statistic from sample data] Suppose that the following is to be tested: and Calculate the observed z-statistic for the following sample data: Sixty-eight out of ninety test subjects have the characteristic of interest. Round to the nearest thousandth.</strong> A) B) C) D) <div style=padding-top: 35px>](https://d2lvgg3v3hfg70.cloudfront.net/TB34225555/11ec8f02_cd4e_4d8b_aaa3_4974a75d66eb_TB34225555_11.jpg)
and Calculate the observed z-statistic for the following sample data: Sixty-eight out of ninety test subjects have the characteristic of interest. Round to the nearest thousandth.A)
B)
C)
D)
Question
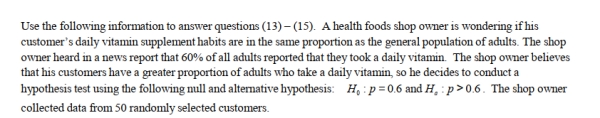
A researcher believes that children who attend elementary school in a rural setting have lower obesity rates then children who attend elementary school in an urban setting. The researcher collects a random sample from each population and records the proportion of children in each sample who were clinically obese. The data are summarized in the table below. Assume all the conditions for proceeding with a two-sample test have been met.
Find the z-statistic (rounded to the nearest hundredth) and p-value (rounded to the nearest thousandth) for this hypothesis test. Using a 5% significance level, state the correct conclusion regarding the null hypothesis
A)
B)
C)
D)
Find the z-statistic (rounded to the nearest hundredth) and p-value (rounded to the nearest thousandth) for this hypothesis test. Using a 5% significance level, state the correct conclusion regarding the null hypothesis
A)
B)
C)
D)
Question
Question
[Objective: Understand the hypothesis test of proportions from two populations] A researcher believes that the proportion of women that exercise with a friend is greater than the proportion men. He takes a random sample from each population and records the response to the question, "Have you exercised with a friend at least once in the last seven days?" The null hypothesis is ![<strong>[Objective: Understand the hypothesis test of proportions from two populations] A researcher believes that the proportion of women that exercise with a friend is greater than the proportion men. He takes a random sample from each population and records the response to the question, Have you exercised with a friend at least once in the last seven days? The null hypothesis is Choose the correct altemative hypothesis.</strong> A) B) C) D) <div style=padding-top: 35px>](https://d2lvgg3v3hfg70.cloudfront.net/TB34225555/11ec8f03_8c6f_bf0d_aaa3_d7676cccd307_TB34225555_11.jpg)
Choose the correct altemative hypothesis.
A)![<strong>[Objective: Understand the hypothesis test of proportions from two populations] A researcher believes that the proportion of women that exercise with a friend is greater than the proportion men. He takes a random sample from each population and records the response to the question, Have you exercised with a friend at least once in the last seven days? The null hypothesis is Choose the correct altemative hypothesis.</strong> A) B) C) D) <div style=padding-top: 35px>](https://d2lvgg3v3hfg70.cloudfront.net/TB34225555/11ec8f03_8c70_825e_aaa3_bff654c797f6_TB34225555_11.jpg)
B)![<strong>[Objective: Understand the hypothesis test of proportions from two populations] A researcher believes that the proportion of women that exercise with a friend is greater than the proportion men. He takes a random sample from each population and records the response to the question, Have you exercised with a friend at least once in the last seven days? The null hypothesis is Choose the correct altemative hypothesis.</strong> A) B) C) D) <div style=padding-top: 35px>](https://d2lvgg3v3hfg70.cloudfront.net/TB34225555/11ec8f03_8c71_45af_aaa3_39d38689a3b4_TB34225555_11.jpg)
C)![<strong>[Objective: Understand the hypothesis test of proportions from two populations] A researcher believes that the proportion of women that exercise with a friend is greater than the proportion men. He takes a random sample from each population and records the response to the question, Have you exercised with a friend at least once in the last seven days? The null hypothesis is Choose the correct altemative hypothesis.</strong> A) B) C) D) <div style=padding-top: 35px>](https://d2lvgg3v3hfg70.cloudfront.net/TB34225555/11ec8f03_8c71_b9e0_aaa3_df24bad320f7_TB34225555_11.jpg)
D)![<strong>[Objective: Understand the hypothesis test of proportions from two populations] A researcher believes that the proportion of women that exercise with a friend is greater than the proportion men. He takes a random sample from each population and records the response to the question, Have you exercised with a friend at least once in the last seven days? The null hypothesis is Choose the correct altemative hypothesis.</strong> A) B) C) D) <div style=padding-top: 35px>](https://d2lvgg3v3hfg70.cloudfront.net/TB34225555/11ec8f03_8c72_5621_aaa3_27dbe18c455c_TB34225555_11.jpg)
Choose the correct altemative hypothesis.
A)
B)
C)
D)
Question
Question
Question
From the TI-84 graphing calculator screenshots below, choose the
screenshot whose shaded area correctly depicts the following hypothesis test results:

A)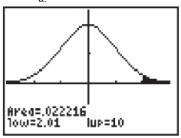
B)
C)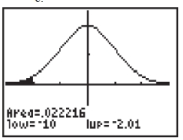
screenshot whose shaded area correctly depicts the following hypothesis test results:
A)
B)
C)
Question
[Objective: Understand the components of hypothesis testing] Complete the statement by filling in the blanks. The null hypothesis H0 is the statement of and always has a hypothesis. It is a statement about the hypothesis H2 is the of a hypothesis. It is a statement about the value of a ___ that we intend to test.
A)![<strong>[Objective: Understand the components of hypothesis testing] Complete the statement by filling in the blanks. The null hypothesis H<sub>0</sub> is the statement of and always has a hypothesis. It is a statement about the hypothesis H<sub>2</sub> is the of a hypothesis. It is a statement about the value of a ___ that we intend to test.</strong> A) B) C) D) <div style=padding-top: 35px>](https://d2lvgg3v3hfg70.cloudfront.net/TB34225555/11ec8f04_1523_0328_aaa3_9d1a3e831856_TB34225555_11.jpg)
B)![<strong>[Objective: Understand the components of hypothesis testing] Complete the statement by filling in the blanks. The null hypothesis H<sub>0</sub> is the statement of and always has a hypothesis. It is a statement about the hypothesis H<sub>2</sub> is the of a hypothesis. It is a statement about the value of a ___ that we intend to test.</strong> A) B) C) D) <div style=padding-top: 35px>](https://d2lvgg3v3hfg70.cloudfront.net/TB34225555/11ec8f04_1525_2609_aaa3_5331136adf49_TB34225555_11.jpg)
C)![<strong>[Objective: Understand the components of hypothesis testing] Complete the statement by filling in the blanks. The null hypothesis H<sub>0</sub> is the statement of and always has a hypothesis. It is a statement about the hypothesis H<sub>2</sub> is the of a hypothesis. It is a statement about the value of a ___ that we intend to test.</strong> A) B) C) D) <div style=padding-top: 35px>](https://d2lvgg3v3hfg70.cloudfront.net/TB34225555/11ec8f04_1525_c24a_aaa3_617a39096b00_TB34225555_11.jpg)
D)![<strong>[Objective: Understand the components of hypothesis testing] Complete the statement by filling in the blanks. The null hypothesis H<sub>0</sub> is the statement of and always has a hypothesis. It is a statement about the hypothesis H<sub>2</sub> is the of a hypothesis. It is a statement about the value of a ___ that we intend to test.</strong> A) B) C) D) <div style=padding-top: 35px>](https://d2lvgg3v3hfg70.cloudfront.net/TB34225555/11ec8f04_1526_5e8b_aaa3_b7d43eca78b7_TB34225555_11.jpg)
A)
B)
C)
D)
Question
A research firm carried out a hypothesis test on a population proportion using a left-tailed alternative hypothesis. Which of the following z-scores would be associated with a p-value of 0.025? Round to the nearest hundredth.
A)
B)
C)
D)
A)
B)
C)
D)
Question
Question
[Objective: Understand the p-value] From the TI-84 graphing calculator screenshots below, choose the
screenshot whose shaded area correctly depicts the following hypothesis test results:
![<strong>[Objective: Understand the p-value] From the TI-84 graphing calculator screenshots below, choose the screenshot whose shaded area correctly depicts the following hypothesis test results: </strong> A) B) C) <div style=padding-top: 35px>](https://d2lvgg3v3hfg70.cloudfront.net/TB34225555/11ec8f05_590c_4ed3_aaa3_271ed3093a45_TB34225555_11.jpg)
A)![<strong>[Objective: Understand the p-value] From the TI-84 graphing calculator screenshots below, choose the screenshot whose shaded area correctly depicts the following hypothesis test results: </strong> A) B) C) <div style=padding-top: 35px>](https://d2lvgg3v3hfg70.cloudfront.net/TB34225555/11ec8f05_590f_0df4_aaa3_97ce48aa6640_TB34225555_11.jpg)
B)![<strong>[Objective: Understand the p-value] From the TI-84 graphing calculator screenshots below, choose the screenshot whose shaded area correctly depicts the following hypothesis test results: </strong> A) B) C) <div style=padding-top: 35px>](https://d2lvgg3v3hfg70.cloudfront.net/TB34225555/11ec8f05_5910_bba5_aaa3_d7414c6aea64_TB34225555_11.jpg)
C)![<strong>[Objective: Understand the p-value] From the TI-84 graphing calculator screenshots below, choose the screenshot whose shaded area correctly depicts the following hypothesis test results: </strong> A) B) C) <div style=padding-top: 35px>](https://d2lvgg3v3hfg70.cloudfront.net/TB34225555/11ec8f05_5912_4246_aaa3_7b09f4cec8ee_TB34225555_11.jpg)
screenshot whose shaded area correctly depicts the following hypothesis test results:
A)
B)
C)
Question
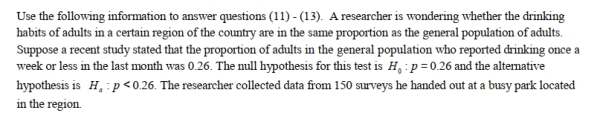
Use the following information to answer questions (10)- (12). A researcher is wondering whether the smoking habits of young adults (18-25 years of age) in a certain city in the U.S. are the same as the proportion of the general population of young adults in the U.S. A recent study stated that the proportion of young adults who reported smoking at least twice a week or more in the last month was 0.16. The researcher collected data from a random
sample of 75 adults in the city of interest.
[Objective: Understand the four steos of the hypothesis test] State the hypotheses to be tested for this study.
A)![<strong>Use the following information to answer questions (10)- (12). A researcher is wondering whether the smoking habits of young adults (18-25 years of age) in a certain city in the U.S. are the same as the proportion of the general population of young adults in the U.S. A recent study stated that the proportion of young adults who reported smoking at least twice a week or more in the last month was 0.16. The researcher collected data from a random sample of 75 adults in the city of interest. [Objective: Understand the four steos of the hypothesis test] State the hypotheses to be tested for this study.</strong> A) B) C) D) <div style=padding-top: 35px>](https://d2lvgg3v3hfg70.cloudfront.net/TB34225555/11ec8f05_b198_eaec_aaa3_5fa77377b09e_TB34225555_11.jpg)
B)![<strong>Use the following information to answer questions (10)- (12). A researcher is wondering whether the smoking habits of young adults (18-25 years of age) in a certain city in the U.S. are the same as the proportion of the general population of young adults in the U.S. A recent study stated that the proportion of young adults who reported smoking at least twice a week or more in the last month was 0.16. The researcher collected data from a random sample of 75 adults in the city of interest. [Objective: Understand the four steos of the hypothesis test] State the hypotheses to be tested for this study.</strong> A) B) C) D) <div style=padding-top: 35px>](https://d2lvgg3v3hfg70.cloudfront.net/TB34225555/11ec8f05_b19a_bfad_aaa3_a9adc2857836_TB34225555_11.jpg)
C)![<strong>Use the following information to answer questions (10)- (12). A researcher is wondering whether the smoking habits of young adults (18-25 years of age) in a certain city in the U.S. are the same as the proportion of the general population of young adults in the U.S. A recent study stated that the proportion of young adults who reported smoking at least twice a week or more in the last month was 0.16. The researcher collected data from a random sample of 75 adults in the city of interest. [Objective: Understand the four steos of the hypothesis test] State the hypotheses to be tested for this study.</strong> A) B) C) D) <div style=padding-top: 35px>](https://d2lvgg3v3hfg70.cloudfront.net/TB34225555/11ec8f05_b19b_aa0e_aaa3_d78493367121_TB34225555_11.jpg)
D)![<strong>Use the following information to answer questions (10)- (12). A researcher is wondering whether the smoking habits of young adults (18-25 years of age) in a certain city in the U.S. are the same as the proportion of the general population of young adults in the U.S. A recent study stated that the proportion of young adults who reported smoking at least twice a week or more in the last month was 0.16. The researcher collected data from a random sample of 75 adults in the city of interest. [Objective: Understand the four steos of the hypothesis test] State the hypotheses to be tested for this study.</strong> A) B) C) D) <div style=padding-top: 35px>](https://d2lvgg3v3hfg70.cloudfront.net/TB34225555/11ec8f05_b19c_946f_aaa3_6d44b5ef841c_TB34225555_11.jpg)
sample of 75 adults in the city of interest.
[Objective: Understand the four steos of the hypothesis test] State the hypotheses to be tested for this study.
A)
B)
C)
D)
Question
From the TI-84 graphing calculator screenshots below, there are specific shaded areas that represent p-values. Choose the statement that best describes the interpretation of these p-values. 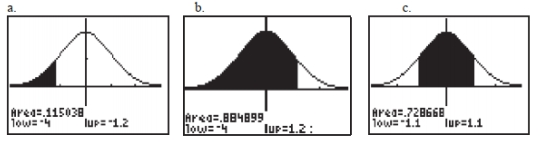
A) The p-values shown in graphics a and b display one-sided tests while c displays a shaded area showing a two-sided p-value.
B) The p-value shown in graphic c displays a one-sided test with a small p-value.
C) The p-value shown in graphic c displays a small two-sided p-value.
D) The p-value shown in graphic b displays a one-sided test with a small p-value.
Question
[Objective: Test a hypothesis for a population proportion] A medical researcher conducts a hypothesis test to test the claim that U.S. adult males have gained weight over the past 15 years. Assume that all the conditions for proceeding with a one-sample test on proportions have been met. The calculated test statistic is approximately 1.71 with an associated p-value of approximately 0.0436. Choose the conclusion that provides the best interpretation for the P-value at a significance level of ![<strong>[Objective: Test a hypothesis for a population proportion] A medical researcher conducts a hypothesis test to test the claim that U.S. adult males have gained weight over the past 15 years. Assume that all the conditions for proceeding with a one-sample test on proportions have been met. The calculated test statistic is approximately 1.71 with an associated p-value of approximately 0.0436. Choose the conclusion that provides the best interpretation for the P-value at a significance level of </strong> A) If the null hypothesis is true, then the probability of getting a test statistic that is as extreme or more extreme than the calculated test statistic of 1.71 is 0.0436. This result is not surprising and could easily happen by chance. B) If the null hypothesis is true, then the probability of getting a test statistic that is as extreme or more extreme than the calculated test statistic of 1.71 is 0.0436. This result is surprising and could not easily happen by chance. C) The p-value should be considered extreme; therefore the hypothesis test proves that the null hypothesis is true. D) If the null hypothesis is true, then the probability of getting a test statistic that is as extreme or more extreme than the calculated test statistic of 1.71 is 0.0436. The result should be doubled for a two-sided test. This result is not surprising and could easily happen by chance. <div style=padding-top: 35px>](https://d2lvgg3v3hfg70.cloudfront.net/TB34225555/11ec8f06_540c_bf54_aaa3_d1ead4832905_TB34225555_11.jpg)
A) If the null hypothesis is true, then the probability of getting a test statistic that is as extreme or more extreme than the calculated test statistic of 1.71 is 0.0436. This result is not surprising and could easily happen by chance.
B) If the null hypothesis is true, then the probability of getting a test statistic that is as extreme or more extreme than the calculated test statistic of 1.71 is 0.0436. This result is surprising and could not easily happen by chance.
C) The p-value should be considered extreme; therefore the hypothesis test proves that the null hypothesis is true.
D) If the null hypothesis is true, then the probability of getting a test statistic that is as extreme or more extreme than the calculated test statistic of 1.71 is 0.0436. The result should be doubled for a two-sided test. This result is not surprising and could easily happen by chance.
Question
[Objective: Understand the components of hypothesis testing] A quality control manager believes that there are too many defective light bulbs being produced, higher than the advertised rate. The manager's null hypothesis is that the production line of light bulbs has a defect rate of p=0.025 (the light bulb's stated defect rate). He does a hypothesis test with a significance level of 0.05. Symbolically, the null and altemative hypothesis are as follows: ![<strong>[Objective: Understand the components of hypothesis testing] A quality control manager believes that there are too many defective light bulbs being produced, higher than the advertised rate. The manager's null hypothesis is that the production line of light bulbs has a defect rate of p=0.025 (the light bulb's stated defect rate). He does a hypothesis test with a significance level of 0.05. Symbolically, the null and altemative hypothesis are as follows: Choose the statement that best describes the significance level in the context of the hypothesis test.</strong> A) The significance level of 0.05 is the defect rate we believe is the true defect rate. B) The significance level of 0.05 is the probability of concluding that the defect rate is higher than 0.025 when in fact the defect rate is equal to 0.025. C) The significance level of 0.05 is the probability of concluding that the defect rate is equal to 0.025 when in fact it is greater than 0.025. D) The significance level of 0.05 is the test statistic that we will use to compare the observed outcome to the null hypothesis. <div style=padding-top: 35px>](https://d2lvgg3v3hfg70.cloudfront.net/TB34225555/11ec8f04_6ae2_2760_aaa3_31c413424014_TB34225555_11.jpg)
Choose the statement that best describes the significance level in the context of the hypothesis test.
A) The significance level of 0.05 is the defect rate we believe is the true defect rate.
B) The significance level of 0.05 is the probability of concluding that the defect rate is higher than 0.025 when in fact the defect rate is equal to 0.025.
C) The significance level of 0.05 is the probability of concluding that the defect rate is equal to 0.025 when in fact it is greater than 0.025.
D) The significance level of 0.05 is the test statistic that we will use to compare the observed outcome to the null hypothesis.
Question
Use the following information to answer questions (10)- (12). A researcher is wondering whether the smoking habits of young adults (18-25 years of age) in a certain city in the U.S. are the same as the proportion of the general population of young adults in the U.S. A recent study stated that the proportion of young adults who reported smoking at least twice a week or more in the last month was 0.16. The researcher collected data from a random
sample of 75 adults in the city of interest.
[Objective: Test a hypothesis for a population proportion] A researcher completes a hypothesis test with a
resulting p-value = 0.076. Choose the best statement to interpret the results
A) The p-value for a two-sided test is divided by 2 resulting in a value less than a standard cutoff value of![<strong>Use the following information to answer questions (10)- (12). A researcher is wondering whether the smoking habits of young adults (18-25 years of age) in a certain city in the U.S. are the same as the proportion of the general population of young adults in the U.S. A recent study stated that the proportion of young adults who reported smoking at least twice a week or more in the last month was 0.16. The researcher collected data from a random sample of 75 adults in the city of interest. [Objective: Test a hypothesis for a population proportion] A researcher completes a hypothesis test with a resulting p-value = 0.076. Choose the best statement to interpret the results</strong> A) The p-value for a two-sided test is divided by 2 resulting in a value less than a standard cutoff value of supporting the hypothesis that the city of interest has a different proportion of smokers than the general public. B) The standard cutoff value of is multiplied by two for a two-sided test and the resulting value of 0.10 is greater than the p-value. Therefore there is no evidence to support that the city of interest has a different proportion of smokers than the general public. C) The p-value is above a standard cutoff value of and therefore there is insufficient evidence to support that the city of interest has a different proportion of smokers than the general public. D) The p-value is above a standard cutoff value of and therefore there is sufficient evidence to support that the city of interest has a different proportion of smokers than the general public. <div style=padding-top: 35px>](https://d2lvgg3v3hfg70.cloudfront.net/TB34225555/11ec8f05_e1a1_84a0_aaa3_0f052ca3a5a0_TB34225555_11.jpg) supporting the hypothesis that the city of interest has a different proportion of smokers than the general public.
supporting the hypothesis that the city of interest has a different proportion of smokers than the general public.
B) The standard cutoff value of![<strong>Use the following information to answer questions (10)- (12). A researcher is wondering whether the smoking habits of young adults (18-25 years of age) in a certain city in the U.S. are the same as the proportion of the general population of young adults in the U.S. A recent study stated that the proportion of young adults who reported smoking at least twice a week or more in the last month was 0.16. The researcher collected data from a random sample of 75 adults in the city of interest. [Objective: Test a hypothesis for a population proportion] A researcher completes a hypothesis test with a resulting p-value = 0.076. Choose the best statement to interpret the results</strong> A) The p-value for a two-sided test is divided by 2 resulting in a value less than a standard cutoff value of supporting the hypothesis that the city of interest has a different proportion of smokers than the general public. B) The standard cutoff value of is multiplied by two for a two-sided test and the resulting value of 0.10 is greater than the p-value. Therefore there is no evidence to support that the city of interest has a different proportion of smokers than the general public. C) The p-value is above a standard cutoff value of and therefore there is insufficient evidence to support that the city of interest has a different proportion of smokers than the general public. D) The p-value is above a standard cutoff value of and therefore there is sufficient evidence to support that the city of interest has a different proportion of smokers than the general public. <div style=padding-top: 35px>](https://d2lvgg3v3hfg70.cloudfront.net/TB34225555/11ec8f05_e1a4_91e1_aaa3_9f5e08bd4c93_TB34225555_11.jpg) is multiplied by two for a two-sided test and the resulting value of 0.10 is greater than the p-value. Therefore there is no evidence to support that the city of interest has a different proportion of smokers than the general public.
is multiplied by two for a two-sided test and the resulting value of 0.10 is greater than the p-value. Therefore there is no evidence to support that the city of interest has a different proportion of smokers than the general public.
C) The p-value is above a standard cutoff value of![<strong>Use the following information to answer questions (10)- (12). A researcher is wondering whether the smoking habits of young adults (18-25 years of age) in a certain city in the U.S. are the same as the proportion of the general population of young adults in the U.S. A recent study stated that the proportion of young adults who reported smoking at least twice a week or more in the last month was 0.16. The researcher collected data from a random sample of 75 adults in the city of interest. [Objective: Test a hypothesis for a population proportion] A researcher completes a hypothesis test with a resulting p-value = 0.076. Choose the best statement to interpret the results</strong> A) The p-value for a two-sided test is divided by 2 resulting in a value less than a standard cutoff value of supporting the hypothesis that the city of interest has a different proportion of smokers than the general public. B) The standard cutoff value of is multiplied by two for a two-sided test and the resulting value of 0.10 is greater than the p-value. Therefore there is no evidence to support that the city of interest has a different proportion of smokers than the general public. C) The p-value is above a standard cutoff value of and therefore there is insufficient evidence to support that the city of interest has a different proportion of smokers than the general public. D) The p-value is above a standard cutoff value of and therefore there is sufficient evidence to support that the city of interest has a different proportion of smokers than the general public. <div style=padding-top: 35px>](https://d2lvgg3v3hfg70.cloudfront.net/TB34225555/11ec8f05_e1a5_5532_aaa3_c9d4be72e52b_TB34225555_11.jpg) and therefore there is insufficient evidence to support that the city of interest has a different proportion of smokers than the general public.
and therefore there is insufficient evidence to support that the city of interest has a different proportion of smokers than the general public.
D) The p-value is above a standard cutoff value of![<strong>Use the following information to answer questions (10)- (12). A researcher is wondering whether the smoking habits of young adults (18-25 years of age) in a certain city in the U.S. are the same as the proportion of the general population of young adults in the U.S. A recent study stated that the proportion of young adults who reported smoking at least twice a week or more in the last month was 0.16. The researcher collected data from a random sample of 75 adults in the city of interest. [Objective: Test a hypothesis for a population proportion] A researcher completes a hypothesis test with a resulting p-value = 0.076. Choose the best statement to interpret the results</strong> A) The p-value for a two-sided test is divided by 2 resulting in a value less than a standard cutoff value of supporting the hypothesis that the city of interest has a different proportion of smokers than the general public. B) The standard cutoff value of is multiplied by two for a two-sided test and the resulting value of 0.10 is greater than the p-value. Therefore there is no evidence to support that the city of interest has a different proportion of smokers than the general public. C) The p-value is above a standard cutoff value of and therefore there is insufficient evidence to support that the city of interest has a different proportion of smokers than the general public. D) The p-value is above a standard cutoff value of and therefore there is sufficient evidence to support that the city of interest has a different proportion of smokers than the general public. <div style=padding-top: 35px>](https://d2lvgg3v3hfg70.cloudfront.net/TB34225555/11ec8f05_e1a5_a353_aaa3_976f3682f113_TB34225555_11.jpg) and therefore there is sufficient evidence to support that the city of interest has a different proportion of smokers than the general public.
and therefore there is sufficient evidence to support that the city of interest has a different proportion of smokers than the general public.
sample of 75 adults in the city of interest.
[Objective: Test a hypothesis for a population proportion] A researcher completes a hypothesis test with a
resulting p-value = 0.076. Choose the best statement to interpret the results
A) The p-value for a two-sided test is divided by 2 resulting in a value less than a standard cutoff value of
supporting the hypothesis that the city of interest has a different proportion of smokers than the general public.B) The standard cutoff value of
is multiplied by two for a two-sided test and the resulting value of 0.10 is greater than the p-value. Therefore there is no evidence to support that the city of interest has a different proportion of smokers than the general public.C) The p-value is above a standard cutoff value of
and therefore there is insufficient evidence to support that the city of interest has a different proportion of smokers than the general public.D) The p-value is above a standard cutoff value of
and therefore there is sufficient evidence to support that the city of interest has a different proportion of smokers than the general public. Question
Question
Question
[Objective: Understand the p-value] A quality control manager thinks that there is a higher defective rate on the production line than the advertised value of p=0.025. She does a hypothesis test with a significance level of 0.05. Symbolically, the null and alternative hypothesis are as follows: ![<strong>[Objective: Understand the p-value] A quality control manager thinks that there is a higher defective rate on the production line than the advertised value of p=0.025. She does a hypothesis test with a significance level of 0.05. Symbolically, the null and alternative hypothesis are as follows: She calculates a p-value for the hypothesis test of defective light bulbs to be approximately 0.067. Choose the correct interpretation for the p-value.</strong> A) The p-value tells us that if the defect rate is 0.025, then the probability that she would observe the percentage she actually observed or higher is 0.067. At a significance level of 0.05, this would not be an unusual outcome. B) The p-value tells us that the probability of concluding that the defect rate is equal to 0.025, when in fact it is greater than 0.025, is approximately 0.067. C) The p-value tells us that the true population rate of defective light bulbs is approximately 0.067. D) The p-value tells us that the result is significantly higher than the advertised value using a significance level of 0.05. <div style=padding-top: 35px>](https://d2lvgg3v3hfg70.cloudfront.net/TB34225555/11ec8f04_80b2_69b1_aaa3_9b1f19e3d4aa_TB34225555_11.jpg)
She calculates a p-value for the hypothesis test of defective light bulbs to be approximately 0.067. Choose the correct interpretation for the p-value.
A) The p-value tells us that if the defect rate is 0.025, then the probability that she would observe the percentage she actually observed or higher is 0.067. At a significance level of 0.05, this would not be an unusual outcome.
B) The p-value tells us that the probability of concluding that the defect rate is equal to 0.025, when in fact it is greater than 0.025, is approximately 0.067.
C) The p-value tells us that the true population rate of defective light bulbs is approximately 0.067.
D) The p-value tells us that the result is significantly higher than the advertised value using a significance level of 0.05.
Question
[Objective: Interpret the parts of the hypothesis test] A researcher conducts a hypothesis test on a population proportion. Her null and alternative hypothesis are ![<strong>[Objective: Interpret the parts of the hypothesis test] A researcher conducts a hypothesis test on a population proportion. Her null and alternative hypothesis are . The test statistic and p-value for the test are z=-3.01 and p-value =0.0013. For a significance level of , choose the correct conclusion regarding the null hypothesis.</strong> A) There is not sufficient evidence to reject the null hypothesis that the population proportion is equal to 0.4. B) There is sufficient evidence to accept the null hypothesis that the population proportion is equal to 0.4. C) There is sufficient evidence to conclude that the population proportion is significantly different from 0.4. D) There is not sufficient evidence to conclude that the population proportion is significantly different from 0.4. <div style=padding-top: 35px>](https://d2lvgg3v3hfg70.cloudfront.net/TB34225555/11ec8f07_09d5_75cd_aaa3_0ba0464786ff_TB34225555_11.jpg) . The test statistic and p-value for the test are z=-3.01 and p-value =0.0013. For a significance level of
. The test statistic and p-value for the test are z=-3.01 and p-value =0.0013. For a significance level of ![<strong>[Objective: Interpret the parts of the hypothesis test] A researcher conducts a hypothesis test on a population proportion. Her null and alternative hypothesis are . The test statistic and p-value for the test are z=-3.01 and p-value =0.0013. For a significance level of , choose the correct conclusion regarding the null hypothesis.</strong> A) There is not sufficient evidence to reject the null hypothesis that the population proportion is equal to 0.4. B) There is sufficient evidence to accept the null hypothesis that the population proportion is equal to 0.4. C) There is sufficient evidence to conclude that the population proportion is significantly different from 0.4. D) There is not sufficient evidence to conclude that the population proportion is significantly different from 0.4. <div style=padding-top: 35px>](https://d2lvgg3v3hfg70.cloudfront.net/TB34225555/11ec8f07_09d6_ae4e_aaa3_9116418a1d99_TB34225555_11.jpg) , choose the correct conclusion regarding the null hypothesis.
, choose the correct conclusion regarding the null hypothesis.
A) There is not sufficient evidence to reject the null hypothesis that the population proportion is equal to 0.4.
B) There is sufficient evidence to accept the null hypothesis that the population proportion is equal to 0.4.
C) There is sufficient evidence to conclude that the population proportion is significantly different from 0.4.
D) There is not sufficient evidence to conclude that the population proportion is significantly different from 0.4.
. The test statistic and p-value for the test are z=-3.01 and p-value =0.0013. For a significance level of , choose the correct conclusion regarding the null hypothesis.A) There is not sufficient evidence to reject the null hypothesis that the population proportion is equal to 0.4.
B) There is sufficient evidence to accept the null hypothesis that the population proportion is equal to 0.4.
C) There is sufficient evidence to conclude that the population proportion is significantly different from 0.4.
D) There is not sufficient evidence to conclude that the population proportion is significantly different from 0.4.
Question
Question
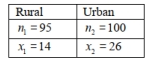
A researcher believes that children who attend elementary school in a rural setting are more physically active then children who attend elementary school in an urban setting. The researcher collects a random sample from each population and records the proportion of children in each sample who reported participating in at least one hour of rigorous activity a day. The data is summarized in the table below. Assume all the conditions for proceeding with a two-sample test have been met.
Find the z-statistic (rounded to the nearest hundredth) and p-value (rounded to the nearest thousandth) for this hypothesis test. Using a 5% significance level, state the correct conclusion regarding the null hypothesis:
A) z=-1.79 There is insufficient evidence to reject the null hypothesis.
B) z=1.79 There is sufficient evidence to reject the null hypothesis
C) z=0.82 There is sufficient evidence to accept the null hypothesis.
D) z=0.71 There is sufficient evidence to reject the null hypothesis.
Question
[Objective: Understand the hypothesis test of proportions from two populations] Which of the following is not a condition that must be checked before proceeding with a two-sample test?
A) Both samples must be large enough so that the product of each sample size ( n1 and n2 ) and the pooled estimate,![<strong>[Objective: Understand the hypothesis test of proportions from two populations] Which of the following is not a condition that must be checked before proceeding with a two-sample test?</strong> A) Both samples must be large enough so that the product of each sample size ( n<sub>1</sub> and n<sub>2 </sub>) and the pooled estimate, is greater than or equal to 10 . B) Each sample must be a random sample. C) The samples must be independent of each other. D) Each sample must be from populations with the same standard deviation. <div style=padding-top: 35px>](https://d2lvgg3v3hfg70.cloudfront.net/TB34225555/11ec8f06_afba_e6ba_aaa3_7da667da0804_TB34225555_11.jpg) is greater than or equal to 10 .
is greater than or equal to 10 .
B) Each sample must be a random sample.
C) The samples must be independent of each other.
D) Each sample must be from populations with the same standard deviation.
A) Both samples must be large enough so that the product of each sample size ( n1 and n2 ) and the pooled estimate,
is greater than or equal to 10 .B) Each sample must be a random sample.
C) The samples must be independent of each other.
D) Each sample must be from populations with the same standard deviation.
Question
[Objective: Understand the hypothesis test of proportions from two populations] A researcher believes that the exercise habits of men and women are different. He takes a random sample from each population and records the response to the question, "Did you exercise for at least 30 minutes twice a week?" The null hypothesis is ![<strong>[Objective: Understand the hypothesis test of proportions from two populations] A researcher believes that the exercise habits of men and women are different. He takes a random sample from each population and records the response to the question, Did you exercise for at least 30 minutes twice a week? The null hypothesis is Choose the correct alternative hypothesis.</strong> A) B) C) D) <div style=padding-top: 35px>](https://d2lvgg3v3hfg70.cloudfront.net/TB34225555/11ec8f06_982b_b655_aaa3_bbd18797cf1d_TB34225555_11.jpg) Choose the correct alternative hypothesis.
Choose the correct alternative hypothesis.
A)![<strong>[Objective: Understand the hypothesis test of proportions from two populations] A researcher believes that the exercise habits of men and women are different. He takes a random sample from each population and records the response to the question, Did you exercise for at least 30 minutes twice a week? The null hypothesis is Choose the correct alternative hypothesis.</strong> A) B) C) D) <div style=padding-top: 35px>](https://d2lvgg3v3hfg70.cloudfront.net/TB34225555/11ec8f06_982c_eed6_aaa3_13ff0b7d0547_TB34225555_11.jpg)
B)![<strong>[Objective: Understand the hypothesis test of proportions from two populations] A researcher believes that the exercise habits of men and women are different. He takes a random sample from each population and records the response to the question, Did you exercise for at least 30 minutes twice a week? The null hypothesis is Choose the correct alternative hypothesis.</strong> A) B) C) D) <div style=padding-top: 35px>](https://d2lvgg3v3hfg70.cloudfront.net/TB34225555/11ec8f06_982d_6407_aaa3_b3a5fd2aa216_TB34225555_11.jpg)
C)![<strong>[Objective: Understand the hypothesis test of proportions from two populations] A researcher believes that the exercise habits of men and women are different. He takes a random sample from each population and records the response to the question, Did you exercise for at least 30 minutes twice a week? The null hypothesis is Choose the correct alternative hypothesis.</strong> A) B) C) D) <div style=padding-top: 35px>](https://d2lvgg3v3hfg70.cloudfront.net/TB34225555/11ec8f06_982e_0048_aaa3_cbdf6c4acb66_TB34225555_11.jpg)
D)![<strong>[Objective: Understand the hypothesis test of proportions from two populations] A researcher believes that the exercise habits of men and women are different. He takes a random sample from each population and records the response to the question, Did you exercise for at least 30 minutes twice a week? The null hypothesis is Choose the correct alternative hypothesis.</strong> A) B) C) D) <div style=padding-top: 35px>](https://d2lvgg3v3hfg70.cloudfront.net/TB34225555/11ec8f06_982e_4e69_aaa3_19605403efec_TB34225555_11.jpg)
Choose the correct alternative hypothesis.A)
B)
C)
D)
Question
Question
[Objective: Calculate the observed value of the \mathrm{z}-statistic from sample data] Two researchers are comparing a blood pressure reducing drug with a two-sided altemative hypothesis. Their test statistics show that the following z values: ![<strong>[Objective: Calculate the observed value of the \mathrm{z}-statistic from sample data] Two researchers are comparing a blood pressure reducing drug with a two-sided altemative hypothesis. Their test statistics show that the following z values: Which one of these have the smaller p-value and why?</strong> A) B) C) D) <div style=padding-top: 35px>](https://d2lvgg3v3hfg70.cloudfront.net/TB34225555/11ec8f05_9499_d267_aaa3_e79c3e5114d7_TB34225555_11.jpg)
Which one of these have the smaller p-value and why?
A)![<strong>[Objective: Calculate the observed value of the \mathrm{z}-statistic from sample data] Two researchers are comparing a blood pressure reducing drug with a two-sided altemative hypothesis. Their test statistics show that the following z values: Which one of these have the smaller p-value and why?</strong> A) B) C) D) <div style=padding-top: 35px>](https://d2lvgg3v3hfg70.cloudfront.net/TB34225555/11ec8f05_949a_e3d8_aaa3_2dd86d787fde_TB34225555_11.jpg)
B)![<strong>[Objective: Calculate the observed value of the \mathrm{z}-statistic from sample data] Two researchers are comparing a blood pressure reducing drug with a two-sided altemative hypothesis. Their test statistics show that the following z values: Which one of these have the smaller p-value and why?</strong> A) B) C) D) <div style=padding-top: 35px>](https://d2lvgg3v3hfg70.cloudfront.net/TB34225555/11ec8f05_949b_ce39_aaa3_6facf399f974_TB34225555_11.jpg)
C)![<strong>[Objective: Calculate the observed value of the \mathrm{z}-statistic from sample data] Two researchers are comparing a blood pressure reducing drug with a two-sided altemative hypothesis. Their test statistics show that the following z values: Which one of these have the smaller p-value and why?</strong> A) B) C) D) <div style=padding-top: 35px>](https://d2lvgg3v3hfg70.cloudfront.net/TB34225555/11ec8f05_949d_54da_aaa3_fd87f6720d4c_TB34225555_11.jpg)
D)![<strong>[Objective: Calculate the observed value of the \mathrm{z}-statistic from sample data] Two researchers are comparing a blood pressure reducing drug with a two-sided altemative hypothesis. Their test statistics show that the following z values: Which one of these have the smaller p-value and why?</strong> A) B) C) D) <div style=padding-top: 35px>](https://d2lvgg3v3hfg70.cloudfront.net/TB34225555/11ec8f05_949f_c5db_aaa3_e3cdde63bf6a_TB34225555_11.jpg)
Which one of these have the smaller p-value and why?
A)
B)
C)
D)
Question

Unlock Deck
Sign up to unlock the cards in this deck!
Unlock Deck
Unlock Deck
1/57
Play
Full screen (f)
Deck 8: Hypothesis Testing for Population Proportions
1
2
Use the following information to answer questions (3) - (7). A survey claims that 9 out of 10 doctors recommend
aspirin for their patients with headaches. To test whether the claim is true or not, a random sample of 100 doctors is
obtained. Of these doctors, 82 indicated that they recommend aspirin for headaches. Is the claim accurate? Test with a
significance level of 0.05.
Explain how you can determine the significance by using the calculated z-value.
The cutoff z-value for a significance level of 0.05 is +/-1.9Answer:The calculated value of -2.667 is greater than the cutoff value and therefore the result is significant.
3
For the following description, state whether a one- proportion z-test or a two-proportion z-test would be appropriate, and name the population. A researcher asks people who are 20-29 years old and senior citizens (people over 65) whether they support a new tax on income. He wants to determine whether the proportions that support the tax differ for these age groups.
Two-proportion z-test. One population is all people in the 20-29 age bracket, the other population is all senior citizens.
4
Explain why failing to reject the null hypothesis does not prove that the null hypothesis is true.
Unlock Deck
Unlock for access to all 57 flashcards in this deck.
Unlock Deck
k this deck
5
Use the following information to answer questions (3) - (7). A survey claims that 9 out of 10 doctors recommend
aspirin for their patients with headaches. To test whether the claim is true or not, a random sample of 100 doctors is
obtained. Of these doctors, 82 indicated that they recommend aspirin for headaches. Is the claim accurate? Test with a
significance level of 0.05.
Calculate the z test statistic for the sample results. Round to the nearest hundredth.
Unlock Deck
Unlock for access to all 57 flashcards in this deck.
Unlock Deck
k this deck
6
Unlock Deck
Unlock for access to all 57 flashcards in this deck.
Unlock Deck
k this deck
7
The alternative hypothesis is a right-tailed with a z-score = 0.21
Unlock Deck
Unlock for access to all 57 flashcards in this deck.
Unlock Deck
k this deck
8
The worker at a carnival game claims that he can communicate with a small magic rock and to prove it he tells you to hide it in your hand behind your back and he will identify the hand holding the rock. Being a wise student of statistics, you decide to stand back and observe the outcome of the next ten games before deciding whether to pay your three dollars to play the game. You have just conducted an informal hypothesis test. State the null and alternative hypothesis.
Unlock Deck
Unlock for access to all 57 flashcards in this deck.
Unlock Deck
k this deck
9
Based on a 5% significance level, write a conclusion by interpreting the p- value. Be sure to clearly state the decision regarding the null hypothesis.
Unlock Deck
Unlock for access to all 57 flashcards in this deck.
Unlock Deck
k this deck
10
Unlock Deck
Unlock for access to all 57 flashcards in this deck.
Unlock Deck
k this deck
11
List and briefly summarize the four steps of the hypothesis test.
Unlock Deck
Unlock for access to all 57 flashcards in this deck.
Unlock Deck
k this deck
12
Use the following information to answer questions (3) - (7). A survey claims that 9 out of 10 doctors recommend
aspirin for their patients with headaches. To test whether the claim is true or not, a random sample of 100 doctors is
obtained. Of these doctors, 82 indicated that they recommend aspirin for headaches. Is the claim accurate? Test with a
significance level of 0.05.
State and explain the null and alternative hypothesis that should be used to test the claim.
Unlock Deck
Unlock for access to all 57 flashcards in this deck.
Unlock Deck
k this deck
13
List and verify that the conditions hold so that the sampling distribution of the z test statistic will approximately follow the standard normal distribution.
Unlock Deck
Unlock for access to all 57 flashcards in this deck.
Unlock Deck
k this deck
14
Use the following information to answer questions (3) - (7). A survey claims that 9 out of 10 doctors recommend
aspirin for their patients with headaches. To test whether the claim is true or not, a random sample of 100 doctors is
obtained. Of these doctors, 82 indicated that they recommend aspirin for headaches. Is the claim accurate? Test with a
significance level of 0.05.
Write a statement describing the meaning of the level of significance in the context of the hypothesis test.
Unlock Deck
Unlock for access to all 57 flashcards in this deck.
Unlock Deck
k this deck
15
A sociologist believes that families that eat at least one meal a day together (without the interference of any other media) will have better communication skills. The sociologist conducts a study to see if there is a difference in the proportion of meals that are eaten together as a family for families living in a rural setting compared to families living in an urban setting.She collects a random sample from each population and records the proportion of test subjects that reported that they had eaten at least 3 meals per week together as a family. The data are summarized in the table below. Assume the all conditions for proceeding with a two-sample test have been met.
Unlock Deck
Unlock for access to all 57 flashcards in this deck.
Unlock Deck
k this deck
16
Use the following information to answer questions (3) - (7). A survey claims that 9 out of 10 doctors recommend
aspirin for their patients with headaches. To test whether the claim is true or not, a random sample of 100 doctors is
obtained. Of these doctors, 82 indicated that they recommend aspirin for headaches. Is the claim accurate? Test with a
significance level of 0.05.
Write a statement explaining what the p-value means and how it should be interpreted. For questions (8) and (9), shade the approximate area that would represent the p-value for the alternative hypothesis and z-score, and then calculate the p-value. Round to the nearest thousandth.
Unlock Deck
Unlock for access to all 57 flashcards in this deck.
Unlock Deck
k this deck
17
The alternative hypothesis is a two-tailed with a z-score = −1.88
Unlock Deck
Unlock for access to all 57 flashcards in this deck.
Unlock Deck
k this deck
18
When a two-sample test of proportions is conducted, there are two conditions of independence that must be checked. State the two conditions of independence. Be sure that your statement clearly states the difference between the two conditions.
Unlock Deck
Unlock for access to all 57 flashcards in this deck.
Unlock Deck
k this deck
19
Two different students conduct a coin flipping experiment with a left- tailed alternative. They obtain the following test statistics: Which of the test statistics has a smaller p-value and why?
Which of the test statistics has a smaller p-value and why? Unlock Deck
Unlock for access to all 57 flashcards in this deck.
Unlock Deck
k this deck
20
A researcher wishes to test the claim that the proportion of children with blue eyes in his region is different than one in six, the national rate of blue eyes in children. State and explain the null and alternative hypothesis that should be used to test the claim.
Unlock Deck
Unlock for access to all 57 flashcards in this deck.
Unlock Deck
k this deck
21
Which of the following is not one of the components of a hypothesis test?
A)State the null and alternative hypothesis about the population parameter.
B)Make a decision to either accept the null hypothesis or accept the alternative hypothesis.
C)State the level of significance, choose a test, and check the conditions for the test.
D)Calculate the test statistic and the p-value.
A)State the null and alternative hypothesis about the population parameter.
B)Make a decision to either accept the null hypothesis or accept the alternative hypothesis.
C)State the level of significance, choose a test, and check the conditions for the test.
D)Calculate the test statistic and the p-value.
Unlock Deck
Unlock for access to all 57 flashcards in this deck.
Unlock Deck
k this deck
22
[Objective: Understand the p-value] From the TI-84 graphing calculator screenshots below, there are specific shaded areas that represent p-values.
Choose the statement that best describes the interpretation of these p-values.
A)
B)
C)
Choose the statement that best describes the interpretation of these p-values.
A)
B)
C)
Unlock Deck
Unlock for access to all 57 flashcards in this deck.
Unlock Deck
k this deck
23
A polling agency is interested in testing whether the proportion of women who support a female candidate for office is less than the proportion of men. The null hypothesis is that there is no difference in the proportions of men and women who support the female candidate. The alternative hypothesis is that the proportion of women who support the female candidate is less than the proportion of men. The test results in a p-value of 0.041. Which of the following is the best interpretation of the p-value?
A)The p-value is the probability of getting a result that is as extreme as or more extreme than the one obtained, assuming that the proportion of women who support the female candidate is less
Than the proportion of men.
B)The p-value is the probability that the majority of women will support the female candidate.
C)The p-value is the probability of getting a result that is as extreme as or more extreme than the one obtained, assuming that there is no difference in the proportions.
D)The p-value is the probability that the majority of men will support the female candidate.
Unlock Deck
Unlock for access to all 57 flashcards in this deck.
Unlock Deck
k this deck
24
Check that the conditions hold so that the sampling distribution of the z-statistic will approximately follow the standard Normal distribution. Are the conditions satisfied? If not, choose the condition that is not satisfied.
A)No the conditions are not satisfied; the researcher did not collect a random sample.
B)Yes, the population of proportions can be assumed to be roughly symmetric.
C)No, the population of interest is not large enough to assume independence.
D)Yes, all the conditions are satisfied.
A)No the conditions are not satisfied; the researcher did not collect a random sample.
B)Yes, the population of proportions can be assumed to be roughly symmetric.
C)No, the population of interest is not large enough to assume independence.
D)Yes, all the conditions are satisfied.
Unlock Deck
Unlock for access to all 57 flashcards in this deck.
Unlock Deck
k this deck
25
Read the following problem description then choose the correct null and alternative hypothesis. A new drug is being tested to see whether it can reduce the diastolic blood pressure measurement for adults age 45-60 years. The upper limit for diastolic blood pressure measurement should be 90 mmHg.
A)
B)
C)
D)
A)
B)
C)
D)
Unlock Deck
Unlock for access to all 57 flashcards in this deck.
Unlock Deck
k this deck
26
[Objective: Test a hypothesis for a population proportion] Suppose a city official conducts a hypothesis test to test the claim that the majority of voters support a proposed tax to build sidewalks. Assume that all the conditions for proceeding with a one-sample test on proportions have been met. The calculated test statistic is approximately 1.40 with an associated p-value of approximately 0.081. Choose the conclusion that provides the best interpretation for the p-value at a significance level of
A) If the null hypothesis is true, then the probability of getting a test statistic that is as extreme or more extreme than the calculated test statistic of 1.40 is 0.081. This result is surprising and could not easily happen by chance.
B) If the null hypothesis is true, then the probability of getting a test statistic as large or larger than 1.40 is 0.081. This result is not surprising and could easily happen by chance.
C) The p-value should be considered extreme; therefore the hypothesis test proves that the null hypothesis is true.
D) If the null hypothesis is true, then the probability of getting a test statistic that is as extreme or more extreme than the calculated test statistic of 1.40 is 0.081. The result should be doubled for a two-sided test. This result is not surprising and easily happen by chance.
Unlock Deck
Unlock for access to all 57 flashcards in this deck.
Unlock Deck
k this deck
27
Which of the following is not true about the alternative hypothesis?
A)It is sometimes called the research hypothesis.
B)It is assumed to be true.
C)Like the null hypothesis, it is always a statement about a population parameter.
D)It is usually a statement that the researcher hopes to demonstrate is true.
A)It is sometimes called the research hypothesis.
B)It is assumed to be true.
C)Like the null hypothesis, it is always a statement about a population parameter.
D)It is usually a statement that the researcher hopes to demonstrate is true.
Unlock Deck
Unlock for access to all 57 flashcards in this deck.
Unlock Deck
k this deck
28
Which of the following is not a condition that must be checked before proceeding with a two-sample test?
A)The observations within each sample must be independent of one another.
B)Each sample must be a random sample.
C)The samples must be independent of each other.
D)All of the above are conditions that must be checked to proceed with a two-sample test.
A)The observations within each sample must be independent of one another.
B)Each sample must be a random sample.
C)The samples must be independent of each other.
D)All of the above are conditions that must be checked to proceed with a two-sample test.
Unlock Deck
Unlock for access to all 57 flashcards in this deck.
Unlock Deck
k this deck
29
[Objective: Interpret the z test statistic] Suppose the janitor tests 300 light bulbs and finds that 33 bulbs are defective. The calculated test statistic is z=1.21. Select the appropriate interpretation of the test statistic.
A) A test statistic of 1.21 is 1.21 standard deviations greater than the mean (between 1 and 2 ) indicating that the result is not significant at a level of 0.01 using a one-sided alternative hypothesis.
B) A test statistic of 1.21 is 1.21 standard deviations greater than the mean (between 1 and 2 ) indicating that the result could be significant using a two-sided alternative hypothesis.
C) A test statistic of -1.21 is 1.21 standard deviations less than the mean (between 1 and 2 ) indicating that the result could be significant at a level of 0.01 using a one-sided alternative hypothesis.
D) A test statistic of 1.21 is 1.21 standard deviations less than the mean (between 1 and 2 ) indicating that the result is not significant.
Unlock Deck
Unlock for access to all 57 flashcards in this deck.
Unlock Deck
k this deck
30
[Objective: Understand the components of hypothesis testing] Read the following problem description then choose the correct null and alternative hypothesis: A new drug is being tested to see whether it can reduce the rate of food-related allergic reactions in children ages 1 to 3 with food allergies. The rate of allergic reactions in the population of concern is 0.03 .
A)
B)
C)
D)
Use the following information to answer questions (3) - (5). A janitor at a large office building believes that his supply of light bulbs has a defect rate that is higher than the defect rate stated by the manufacturer. The janitor's null hypothesis is that the supply of light bulbs has a manufacturer's defect rate of p=0.09. He performs a test at a significance level of 0.01. The null and alternative hypothesis are as follows:
Unlock Deck
Unlock for access to all 57 flashcards in this deck.
Unlock Deck
k this deck
31
[Objective: Calculate the observed value of the z-statistic from sample data] Suppose that the following is to be tested: and Calculate the observed z-statistic for the following sample data: Sixty-eight out of ninety test subjects have the characteristic of interest. Round to the nearest thousandth.
A)
B)
C)
D)
and Calculate the observed z-statistic for the following sample data: Sixty-eight out of ninety test subjects have the characteristic of interest. Round to the nearest thousandth.A)
B)
C)
D)
Unlock Deck
Unlock for access to all 57 flashcards in this deck.
Unlock Deck
k this deck
32
A researcher believes that children who attend elementary school in a rural setting have lower obesity rates then children who attend elementary school in an urban setting. The researcher collects a random sample from each population and records the proportion of children in each sample who were clinically obese. The data are summarized in the table below. Assume all the conditions for proceeding with a two-sample test have been met.
Find the z-statistic (rounded to the nearest hundredth) and p-value (rounded to the nearest thousandth) for this hypothesis test. Using a 5% significance level, state the correct conclusion regarding the null hypothesis
A)
B)
C)
D)
Find the z-statistic (rounded to the nearest hundredth) and p-value (rounded to the nearest thousandth) for this hypothesis test. Using a 5% significance level, state the correct conclusion regarding the null hypothesis
A)
B)
C)
D)
Unlock Deck
Unlock for access to all 57 flashcards in this deck.
Unlock Deck
k this deck
33
Complete the statement by filling in the blanks. A research hypothesis is always expressed in terms of ________ __________ because we are interested in making statements about the _________ based on _______ statistics.
A)sample; statistics; population; sample
B)population; statistics; population; parameter
C)population; parameters; population; sample
D)population; parameters; sample; population
A)sample; statistics; population; sample
B)population; statistics; population; parameter
C)population; parameters; population; sample
D)population; parameters; sample; population
Unlock Deck
Unlock for access to all 57 flashcards in this deck.
Unlock Deck
k this deck
34
[Objective: Understand the hypothesis test of proportions from two populations] A researcher believes that the proportion of women that exercise with a friend is greater than the proportion men. He takes a random sample from each population and records the response to the question, "Have you exercised with a friend at least once in the last seven days?" The null hypothesis is
Choose the correct altemative hypothesis.
A)
B)
C)
D)
Choose the correct altemative hypothesis.
A)
B)
C)
D)
Unlock Deck
Unlock for access to all 57 flashcards in this deck.
Unlock Deck
k this deck
35
Which statement best describes the significance level of a hypothesis test?
A)The probability of rejecting the null hypothesis when the null hypothesis is true.
B)The probability of rejecting the null hypothesis when the null hypothesis is not true.
C)The probability of failing to reject the null hypothesis when the null hypothesis is not true.
D)None of the above
A)The probability of rejecting the null hypothesis when the null hypothesis is true.
B)The probability of rejecting the null hypothesis when the null hypothesis is not true.
C)The probability of failing to reject the null hypothesis when the null hypothesis is not true.
D)None of the above
Unlock Deck
Unlock for access to all 57 flashcards in this deck.
Unlock Deck
k this deck
36
Choose the statement that best describes the significance level in the context of the hypothesis test.
A)The significance level of 0.01 is the probability of concluding the defect rate is more than 0.09 when it is equal to 0.09.
B)The significance level of 0.01 is the defect rate we believe is the true defect rate.
C)The significance level of 0.01 is the z-statistic that we will use to compare the observed outcome to the null hypothesis.
D)The significance level of 0.01 is the probability of concluding that the defect rate is equal to 0.09 when in fact it is greater than 0.09.
Unlock Deck
Unlock for access to all 57 flashcards in this deck.
Unlock Deck
k this deck
37
From the TI-84 graphing calculator screenshots below, choose the
screenshot whose shaded area correctly depicts the following hypothesis test results:
A)
B)
C)
screenshot whose shaded area correctly depicts the following hypothesis test results:
A)
B)
C)
Unlock Deck
Unlock for access to all 57 flashcards in this deck.
Unlock Deck
k this deck
38
[Objective: Understand the components of hypothesis testing] Complete the statement by filling in the blanks. The null hypothesis H0 is the statement of and always has a hypothesis. It is a statement about the hypothesis H2 is the of a hypothesis. It is a statement about the value of a ___ that we intend to test.
A)
B)
C)
D)
A)
B)
C)
D)
Unlock Deck
Unlock for access to all 57 flashcards in this deck.
Unlock Deck
k this deck
39
A research firm carried out a hypothesis test on a population proportion using a left-tailed alternative hypothesis. Which of the following z-scores would be associated with a p-value of 0.025? Round to the nearest hundredth.
A)
B)
C)
D)
A)
B)
C)
D)
Unlock Deck
Unlock for access to all 57 flashcards in this deck.
Unlock Deck
k this deck
40
Read the following then choose the appropriate test and name the population(s). A researcher asks a random sample of 200 men whether they had made an online purchase in the last three months. He wants to determine whether the proportion of men who make online purchases is less than 0.18.
A)Two-proportion z-test; the population is the 200 men surveyed.
B)One-proportion z-test; the population is all men.
C)One-proportion z-test; the population is all adults who make online purchases.
D)Two-proportion z-test; one population is all men who make online purchases and the other population is all men who do not make online purchases.
Unlock Deck
Unlock for access to all 57 flashcards in this deck.
Unlock Deck
k this deck
41
[Objective: Understand the p-value] From the TI-84 graphing calculator screenshots below, choose the
screenshot whose shaded area correctly depicts the following hypothesis test results:
A)
B)
C)
screenshot whose shaded area correctly depicts the following hypothesis test results:
A)
B)
C)
Unlock Deck
Unlock for access to all 57 flashcards in this deck.
Unlock Deck
k this deck
42
Use the following information to answer questions (10)- (12). A researcher is wondering whether the smoking habits of young adults (18-25 years of age) in a certain city in the U.S. are the same as the proportion of the general population of young adults in the U.S. A recent study stated that the proportion of young adults who reported smoking at least twice a week or more in the last month was 0.16. The researcher collected data from a random
sample of 75 adults in the city of interest.
[Objective: Understand the four steos of the hypothesis test] State the hypotheses to be tested for this study.
A)
B)
C)
D)
sample of 75 adults in the city of interest.
[Objective: Understand the four steos of the hypothesis test] State the hypotheses to be tested for this study.
A)
B)
C)
D)
Unlock Deck
Unlock for access to all 57 flashcards in this deck.
Unlock Deck
k this deck
43
From the TI-84 graphing calculator screenshots below, there are specific shaded areas that represent p-values. Choose the statement that best describes the interpretation of these p-values.
A) The p-values shown in graphics a and b display one-sided tests while c displays a shaded area showing a two-sided p-value.
B) The p-value shown in graphic c displays a one-sided test with a small p-value.
C) The p-value shown in graphic c displays a small two-sided p-value.
D) The p-value shown in graphic b displays a one-sided test with a small p-value.
Unlock Deck
Unlock for access to all 57 flashcards in this deck.
Unlock Deck
k this deck
44
[Objective: Test a hypothesis for a population proportion] A medical researcher conducts a hypothesis test to test the claim that U.S. adult males have gained weight over the past 15 years. Assume that all the conditions for proceeding with a one-sample test on proportions have been met. The calculated test statistic is approximately 1.71 with an associated p-value of approximately 0.0436. Choose the conclusion that provides the best interpretation for the P-value at a significance level of
A) If the null hypothesis is true, then the probability of getting a test statistic that is as extreme or more extreme than the calculated test statistic of 1.71 is 0.0436. This result is not surprising and could easily happen by chance.
B) If the null hypothesis is true, then the probability of getting a test statistic that is as extreme or more extreme than the calculated test statistic of 1.71 is 0.0436. This result is surprising and could not easily happen by chance.
C) The p-value should be considered extreme; therefore the hypothesis test proves that the null hypothesis is true.
D) If the null hypothesis is true, then the probability of getting a test statistic that is as extreme or more extreme than the calculated test statistic of 1.71 is 0.0436. The result should be doubled for a two-sided test. This result is not surprising and could easily happen by chance.
Unlock Deck
Unlock for access to all 57 flashcards in this deck.
Unlock Deck
k this deck
45
[Objective: Understand the components of hypothesis testing] A quality control manager believes that there are too many defective light bulbs being produced, higher than the advertised rate. The manager's null hypothesis is that the production line of light bulbs has a defect rate of p=0.025 (the light bulb's stated defect rate). He does a hypothesis test with a significance level of 0.05. Symbolically, the null and altemative hypothesis are as follows:
Choose the statement that best describes the significance level in the context of the hypothesis test.
A) The significance level of 0.05 is the defect rate we believe is the true defect rate.
B) The significance level of 0.05 is the probability of concluding that the defect rate is higher than 0.025 when in fact the defect rate is equal to 0.025.
C) The significance level of 0.05 is the probability of concluding that the defect rate is equal to 0.025 when in fact it is greater than 0.025.
D) The significance level of 0.05 is the test statistic that we will use to compare the observed outcome to the null hypothesis.
Unlock Deck
Unlock for access to all 57 flashcards in this deck.
Unlock Deck
k this deck
46
Use the following information to answer questions (10)- (12). A researcher is wondering whether the smoking habits of young adults (18-25 years of age) in a certain city in the U.S. are the same as the proportion of the general population of young adults in the U.S. A recent study stated that the proportion of young adults who reported smoking at least twice a week or more in the last month was 0.16. The researcher collected data from a random
sample of 75 adults in the city of interest.
[Objective: Test a hypothesis for a population proportion] A researcher completes a hypothesis test with a
resulting p-value = 0.076. Choose the best statement to interpret the results
A) The p-value for a two-sided test is divided by 2 resulting in a value less than a standard cutoff value of supporting the hypothesis that the city of interest has a different proportion of smokers than the general public.
B) The standard cutoff value of is multiplied by two for a two-sided test and the resulting value of 0.10 is greater than the p-value. Therefore there is no evidence to support that the city of interest has a different proportion of smokers than the general public.
C) The p-value is above a standard cutoff value of and therefore there is insufficient evidence to support that the city of interest has a different proportion of smokers than the general public.
D) The p-value is above a standard cutoff value of and therefore there is sufficient evidence to support that the city of interest has a different proportion of smokers than the general public.
sample of 75 adults in the city of interest.
[Objective: Test a hypothesis for a population proportion] A researcher completes a hypothesis test with a
resulting p-value = 0.076. Choose the best statement to interpret the results
A) The p-value for a two-sided test is divided by 2 resulting in a value less than a standard cutoff value of
supporting the hypothesis that the city of interest has a different proportion of smokers than the general public.B) The standard cutoff value of
is multiplied by two for a two-sided test and the resulting value of 0.10 is greater than the p-value. Therefore there is no evidence to support that the city of interest has a different proportion of smokers than the general public.C) The p-value is above a standard cutoff value of
and therefore there is insufficient evidence to support that the city of interest has a different proportion of smokers than the general public.D) The p-value is above a standard cutoff value of
and therefore there is sufficient evidence to support that the city of interest has a different proportion of smokers than the general public. Unlock Deck
Unlock for access to all 57 flashcards in this deck.
Unlock Deck
k this deck
47
Use the following information to answer questions (10)- (12). A researcher is wondering whether the smoking habits of young adults (18-25 years of age) in a certain city in the U.S. are the same as the proportion of the general population of young adults in the U.S. A recent study stated that the proportion of young adults who reported smoking at least twice a week or more in the last month was 0.16. The researcher collected data from a random
sample of 75 adults in the city of interest.
Check that the conditions hold so that the sampling distribution of the z-statistic will approximately follow the standard normal distribution. Are the conditions satisfied? If not, choose the condition that is not satisfied.
A)Yes, all the conditions are satisfied.
B)No, the researcher did not collect a random sample.
C)No, the researcher did not collect a large enough sample.
D)No, the population of interest is not large enough to assume independence.
Unlock Deck
Unlock for access to all 57 flashcards in this deck.
Unlock Deck
k this deck
48
A polling agency is interested in testing whether the proportion of women who support a female candidate for office is greater than the proportion of men. The null hypothesis is that there is no difference in the proportion of men and women who support the female candidate. The alternative hypothesis is that the proportion of women who support the female candidate is greater than the proportion of men. The test results in a p-value of 0.112. Which of the following is the best interpretation of the p-value?
A)The p-value is the probability of getting a result that is as extreme as or more extreme than the one obtained, assuming that the proportion of women who support the female candidate is
Greater than the proportion of men.
B)The p-value is the probability of getting a result that is as extreme as or more extreme than the one obtained, assuming that there is no difference in the proportions.
C)The p-value is the probability that men will support the female candidate.
D)The p-value is the probability that women will support the female candidate.
Unlock Deck
Unlock for access to all 57 flashcards in this deck.
Unlock Deck
k this deck
49
[Objective: Understand the p-value] A quality control manager thinks that there is a higher defective rate on the production line than the advertised value of p=0.025. She does a hypothesis test with a significance level of 0.05. Symbolically, the null and alternative hypothesis are as follows:
She calculates a p-value for the hypothesis test of defective light bulbs to be approximately 0.067. Choose the correct interpretation for the p-value.
A) The p-value tells us that if the defect rate is 0.025, then the probability that she would observe the percentage she actually observed or higher is 0.067. At a significance level of 0.05, this would not be an unusual outcome.
B) The p-value tells us that the probability of concluding that the defect rate is equal to 0.025, when in fact it is greater than 0.025, is approximately 0.067.
C) The p-value tells us that the true population rate of defective light bulbs is approximately 0.067.
D) The p-value tells us that the result is significantly higher than the advertised value using a significance level of 0.05.
Unlock Deck
Unlock for access to all 57 flashcards in this deck.
Unlock Deck
k this deck
50
[Objective: Interpret the parts of the hypothesis test] A researcher conducts a hypothesis test on a population proportion. Her null and alternative hypothesis are . The test statistic and p-value for the test are z=-3.01 and p-value =0.0013. For a significance level of , choose the correct conclusion regarding the null hypothesis.
A) There is not sufficient evidence to reject the null hypothesis that the population proportion is equal to 0.4.
B) There is sufficient evidence to accept the null hypothesis that the population proportion is equal to 0.4.
C) There is sufficient evidence to conclude that the population proportion is significantly different from 0.4.
D) There is not sufficient evidence to conclude that the population proportion is significantly different from 0.4.
. The test statistic and p-value for the test are z=-3.01 and p-value =0.0013. For a significance level of , choose the correct conclusion regarding the null hypothesis.A) There is not sufficient evidence to reject the null hypothesis that the population proportion is equal to 0.4.
B) There is sufficient evidence to accept the null hypothesis that the population proportion is equal to 0.4.
C) There is sufficient evidence to conclude that the population proportion is significantly different from 0.4.
D) There is not sufficient evidence to conclude that the population proportion is significantly different from 0.4.
Unlock Deck
Unlock for access to all 57 flashcards in this deck.
Unlock Deck
k this deck
51
[Objective: Understand the hypothesis test of proportions from two populations] Two movie reviewers give movies "thumbs Up" and "thumbs down" ratings. You sample 100 movies that they both have rated and find that they both gave "thumbs up" to 25 movies, both gave "thumbs down" to 30 movies, Sarah gave "thumbs up" and Jessica "thumb down" to 28 movies, and the remaining movies Sarah gave "thumbs down" and Jessica "thumbs up". Test whether there is a tendency for one reviewer to give more movies "thumbs up" (proportion 1) than the other (proportion 2).
A) z=1.56 For a two-sided test at \alpha=0.05 level, there is insufficient evidence to reject the null hypothesis because the cutoff z-value is at 1.96.
B) z=-1.56 For a two-sided test at \alpha=0.05 level, there is insufficient evidence to reject the null hypothesis because the cutoff z-value is at 1.96.
C) z=1.96 There is sufficient evidence to accept the null hypothesis.
D) z=-1.96 There is sufficient evidence to reject the null hypothesis.
Unlock Deck
Unlock for access to all 57 flashcards in this deck.
Unlock Deck
k this deck
52
A researcher believes that children who attend elementary school in a rural setting are more physically active then children who attend elementary school in an urban setting. The researcher collects a random sample from each population and records the proportion of children in each sample who reported participating in at least one hour of rigorous activity a day. The data is summarized in the table below. Assume all the conditions for proceeding with a two-sample test have been met.
Find the z-statistic (rounded to the nearest hundredth) and p-value (rounded to the nearest thousandth) for this hypothesis test. Using a 5% significance level, state the correct conclusion regarding the null hypothesis:
A) z=-1.79 There is insufficient evidence to reject the null hypothesis.
B) z=1.79 There is sufficient evidence to reject the null hypothesis
C) z=0.82 There is sufficient evidence to accept the null hypothesis.
D) z=0.71 There is sufficient evidence to reject the null hypothesis.
Find the z-statistic (rounded to the nearest hundredth) and p-value (rounded to the nearest thousandth) for this hypothesis test. Using a 5% significance level, state the correct conclusion regarding the null hypothesis:
A) z=-1.79 There is insufficient evidence to reject the null hypothesis.
B) z=1.79 There is sufficient evidence to reject the null hypothesis
C) z=0.82 There is sufficient evidence to accept the null hypothesis.
D) z=0.71 There is sufficient evidence to reject the null hypothesis.
Unlock Deck
Unlock for access to all 57 flashcards in this deck.
Unlock Deck
k this deck
53
[Objective: Understand the hypothesis test of proportions from two populations] Which of the following is not a condition that must be checked before proceeding with a two-sample test?
A) Both samples must be large enough so that the product of each sample size ( n1 and n2 ) and the pooled estimate, is greater than or equal to 10 .
B) Each sample must be a random sample.
C) The samples must be independent of each other.
D) Each sample must be from populations with the same standard deviation.
A) Both samples must be large enough so that the product of each sample size ( n1 and n2 ) and the pooled estimate,
is greater than or equal to 10 .B) Each sample must be a random sample.
C) The samples must be independent of each other.
D) Each sample must be from populations with the same standard deviation.
Unlock Deck
Unlock for access to all 57 flashcards in this deck.
Unlock Deck
k this deck
54
[Objective: Understand the hypothesis test of proportions from two populations] A researcher believes that the exercise habits of men and women are different. He takes a random sample from each population and records the response to the question, "Did you exercise for at least 30 minutes twice a week?" The null hypothesis is Choose the correct alternative hypothesis.
A)
B)
C)
D)
Choose the correct alternative hypothesis.A)
B)
C)
D)
Unlock Deck
Unlock for access to all 57 flashcards in this deck.
Unlock Deck
k this deck
55
A researcher asks random samples of residents of two separate counties as to whether they had purchased organically grown food in the last three months. He wants to determine whether the proportion of residents of one county who purchase organically grown food is greater than the proportion of residents of the second county who purchase organically grown food. Choose the appropriate test and name the population(s).
A)One-proportion z-test; the population is all residents of a state.
B)One-proportion z-test; the population is all residents of the first county.
C)Two-proportion z-test; one population is all residents of the first county and the other population is residents of the second county.
D)Two-proportion z-test; one population is all adults who buy organically grown food and the other population is all adults who do not buy organically grown food.
Unlock Deck
Unlock for access to all 57 flashcards in this deck.
Unlock Deck
k this deck
56
[Objective: Calculate the observed value of the \mathrm{z}-statistic from sample data] Two researchers are comparing a blood pressure reducing drug with a two-sided altemative hypothesis. Their test statistics show that the following z values:
Which one of these have the smaller p-value and why?
A)
B)
C)
D)
Which one of these have the smaller p-value and why?
A)
B)
C)
D)
Unlock Deck
Unlock for access to all 57 flashcards in this deck.
Unlock Deck
k this deck
57
Which of the following is not one of the four steps of the hypothesis test?
A)State the null and alternative hypothesis about the population parameter.
B)Make a decision to reject or not reject the null hypothesis.
C)State the level of significance, choose a test, and check the conditions for the test.
D)All of the above are steps of the hypothesis test.
A)State the null and alternative hypothesis about the population parameter.
B)Make a decision to reject or not reject the null hypothesis.
C)State the level of significance, choose a test, and check the conditions for the test.
D)All of the above are steps of the hypothesis test.
Unlock Deck
Unlock for access to all 57 flashcards in this deck.
Unlock Deck
k this deck
Unlock Deck
Unlock for access to all 57 flashcards in this deck.


